Fact Sheet 2009–3030
|
Organic compounds studied in this U.S. Geological Survey (USGS) assessment generally are man-made, including pesticides, gasoline hydrocarbons, solvents, personal care and domestic-use products, disinfection by-products, and manufacturing additives. In all, 56 compounds were detected in samples collected approximately monthly during 2003–05 at the intake for the Clackamas River Water plant, one of four community water systems on the lower Clackamas River. The diversity of compounds detected suggests a variety of different sources and uses (including wastewater discharges, industrial, agricultural, domestic, and others) and different pathways to drinking-water supplies (point sources, precipitation, overland runoff, ground-water discharge, and formation during water treatment). A total of 20 organic compounds were commonly detected (in at least 20 percent of the samples) in source water and (or) finished water. Fifteen compounds were commonly detected in source water, and five of these compounds (benzene, m- and p-xylene, diuron, simazine, and chloroform) also were commonly detected in finished water. With the exception of gasoline hydrocarbons, disinfection by-products, chloromethane, and the herbicide diuron, concentrations in source and finished water were less than 0.1 microgram per liter and always less than human-health benchmarks, which are available for about 60 percent of the compounds detected. On the basis of this screening-level assessment, adverse effects to human health are assumed to be negligible (subject to limitations of available human-health benchmarks).
IntroductionAn investigation by the USGS National Water-Quality Assessment (NAWQA) Program characterized the occurrence of 277 organic compounds in source water (stream water collected at a surface-water intake prior to water treatment) and finished water (water that has passed through treatment processes but prior to distribution) from the Clackamas River Water plant, one of four community water systems that use the lower Clackamas River as its primary source of water supply (fig. 1). Samples were collected approximately monthly during 2003–05, and included 34 source water and 15 finished water samples. Samples were collected during winter-spring high flow and summer-fall low flow, but storm events were not targeted during this Source Water-Quality Assessment (SWQA) study. Samples were analyzed for pesticides and degradates, gasoline hydrocarbons, solvents, disinfection by-products, personal care and domestic-use products, and other compounds. Community water systems are required to monitor for regulated organic compounds under the Safe Drinking Water Act of 1996 (U.S. Environmental Protection Agency, 1998); however, most compounds included in this study are not regulated by Federal drinking-water standards (U.S. Environmental Protection Agency, 2007a). The Clackamas River study is part of an ongoing NAWQA investigation of community water systems across the United States. Additional study details are given by Carter and others (2007). 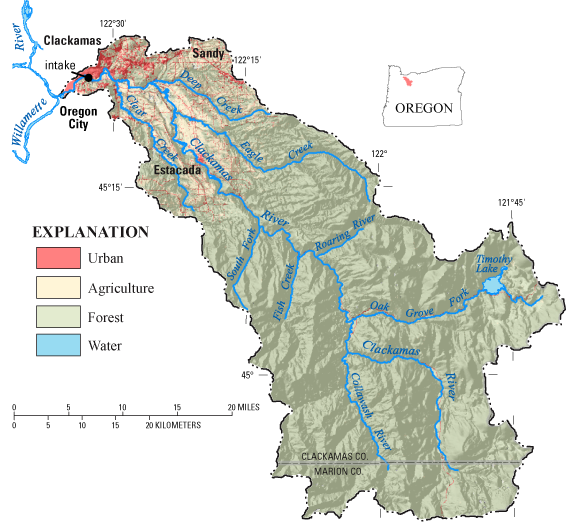
Figure 1. About 937 square miles of the Clackamas River basin are upstream of the community water system intake. Most of the basin is forested (82 percent of the area, mostly within the Mount Hood National Forest). Agricultural and urban land in the lower basin composes 7 and 3 percent of the area, respectively, and can potentially affect source water quality. Four public water utilities in the lower Clackamas River provide drinking water for about 300,000 people. The Clackamas River Water plant provides drinking water to about 25 percent of these customers. Occurrence of Organic Compounds in Source WaterAbout 20 percent of 277 compounds were detected in the Clackamas River. These compounds represent many different sources and uses and include pesticides, gasoline hydrocarbons, domestic-use products, organic synthesis compounds, and solvents. Table 1. A total of 15 of 277 organic compounds were commonly detected (in at least 20 percent of the samples) in source water (bold) and five organic compounds were commonly detected in finished water. [Black text indicates compounds detected in both source water and finished water; orange text indicates compounds detected only in source water]
1 Throughout this report, m- & p-Xylene are considered as one compound. Fifty-three of 277 compounds were detected in the Clackamas River (Carter and others, 2007; Kingsbury and others, 2008). This is partly because recent advances in laboratory analytical methods have given scientists the tools to detect contaminants in the environment at low concentrations (see inset "What 'Detections' May Mean to Human Healthy"). Fifteen organic compounds were detected in at least 20 percent of the source-water samples (defined in this study as “commonly detected”; table 1). These included herbicides (diuron, atrazine, hexazinone, and simazine), gasoline hydrocarbons (benzene, toluene, ethylbenzene, xylene, and others), and disinfection by-products (particularly chloroform). These compounds are among the most commonly detected in surface and groundwater across the Nation (Gilliom and others, 2006; Zogorski and others, 2006). The highest concentrations and total numbers of organic compounds were detected during moderate streamflows in spring and fall, often following several days of rain. Concentrations of organic compounds typically were less in summer and winter, when lack of runoff or dilution from high streamflow, respectively, resulted in improved source-water quality. The initial rains in the fall of 2002 coincided with a spike in the concentration of chloroform and other disinfection by-products (compounds formed when chlorine or bromine react with organic carbon). Pesticide concentrations were highest during “first flush” storm events in the fall (Carpenter and others, 2008), whereas gasoline hydrocarbons, which were detected in two-thirds of source-water samples, peaked during springtime. Comparisons Between Source Water and Finished WaterFive compounds commonly detected in source water also were commonly detected in finished water. With the exception of the disinfection by-products and diuron, concentrations of individual compounds in finished water were equal to or less than 0.1 microgram per liter. What “Detections” May Mean to Human HealthThe analytical methods used in this study have low detection levels—often 100 to 1,000 times lower than State and Federal standards and guidelines for protecting water quality. Detections, therefore, do not necessarily indicate a concern to human health but rather help to identify the environmental presence of a wide variety of chemicals not commonly monitored in water resources and to track changes in occurrence and concentrations of these chemicals over time. These findings complement ongoing drinking-water monitoring required by Federal, State, and local programs, which focus primarily on post-treatment compliance monitoring of contaminants regulated in drinking water by the U.S. Environmental Protection Agency (USEPA). Many of the compounds analyzed by USGS are not included in other source- and finished-water monitoring programs such as the Unregulated Contaminant Monitoring Program (U.S. Environmental Protection Agency, 2007b) and the U.S. Department of Agriculture’s Pesticide Data Program (U.S. Department of Agriculture, 2008). Comparisons between source water and finished water were not intended to characterize treatment efficacy (see inset "Finished Water Sampling, Water Treatment, and Significance of Comparisons to Source Water"), but do provide a preliminary indication of the tendency for contaminants to pass through the treatment process. Five of the 15 compounds commonly detected in source water were commonly detected in finished water, often at similarly low concentrations (fig. 2). Five compounds were commonly detected in finished water but not commonly detected in source water. These include bromodichloromethane and dibromochloromethane (disinfection by-products), tris(2-chloroethyl)phosphate and tributyl phosphate (flame retardants), and chloromethane. 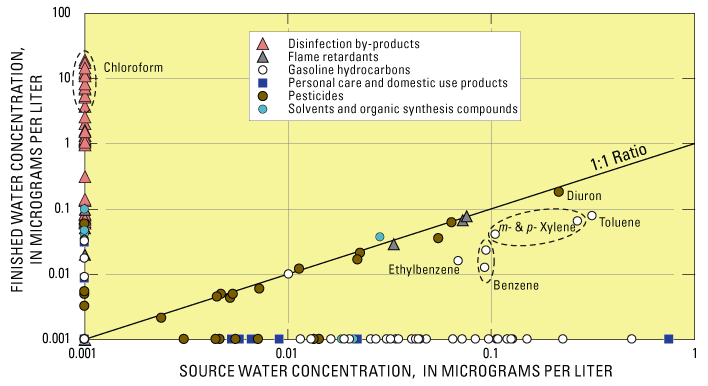
Figure 2. Comparisons between source and finished drinking water. Some pesticides (diuron, for example), flame retardants, and organic synthesis compounds were detected at similar concentrations in source and finished water (data points along the 1:1 line). Some compounds commonly detected in source water were removed or transformed during treatment and, therefore were not detected in finished water (data points on horizontal x-axis). Concentrations of disinfection by-products (compounds formed during treatment) plot along the vertical y-axis. Chloroform, which was occasionally detected in source water during the first phase of the study, was not detected in source water during the second phase, when both source and finished water were analyzed. Although chloroform was detected in 23 percent of source-water samples during the first phase of the study, it and one other disinfection by-product (bromodichloromethane) were detected in 100 percent of finished water samples. These compounds form when organic carbon present in source water reacts with disinfectants such as chlorine and (or) bromine, and their presence in finished drinking water is an expected outcome of the water treatment process (Krasner and others, 2006). Finished Water Sampling, Water Treatment, and Significance of Comparisons to Source WaterThe direct filtration treatment process used by the Clackamas River Water plant includes pre-screening, disinfection with chlorine, coagulation (aluminum chlorhydrate), flocculation and sedimentation, addition of polymer filter aid, filtration through anthracite and sand, post-filtration disinfection with chlorine, pH adjustment with soda ash, occasional addition of powdered activated carbon, clear well and reservoir storage, and distribution. Finished water samples were collected approximately 90 minutes after source-water samples to account for treatment plant retention time of the water. Some differences between source- and finished-water quality might be attributable to changes in source-water quality that are not represented by the finished water samples because of sample timing and variations in retention time, and potential analytic variability associated with low concentrations at or near laboratory reporting levels (Kingsbury and others, 2008). Some compounds detected in source water also may be transformed during the treatment process into compounds that were not monitored as part of this study. The study sampling design and resulting comparisons were not intended to characterize treatment efficacy, but to provide a preliminary indication of the potential importance of compounds detected in source water to the quality of finished water prior to distribution. In general, the type of treatment used was not specifically designed to remove most of the organic compounds monitored in this study. A Closer Look at Gasoline Hydrocarbons and PesticidesGasoline hydrocarbons and pesticides were the most commonly detected organic compounds in the Clackamas River during the Source Water-Quality Assessment (SWQA) study. These compounds originate from a variety of sources and occur in source and finished water. Gasoline hydrocarbons—Compared with the other eight community water systems sampled during the USGS SWQA study, concentrations of several gasoline hydrocarbons, including toluene, xylene, and benzene, were highest in the Clackamas River (Kingsbury and others, 2008). In all, 14 gasoline hydrocarbons were detected, and the frequent occurrence of these compounds indicates a persistent source during much of the year (fig. 3). Sources of these compounds include vehicle emissions and fumes from fueling stations, runoff from roads and parking lots, ground-water discharge contaminated by leaky underground gasoline storage tanks, and exhaust from water craft, particularly two-stroke engines. The frequent occurrence of benzene likely is related to the naturally high concentrations in crude oil from Alaska, which is the primary source for gasoline refineries in the Pacific Northwest (Oregon Department of Environmental Quality, 2007). New USEPA legislation will require most refineries to reduce benzene levels before 2012, which should help reduce the amount of benzene from gasoline that enters the Clackamas River. 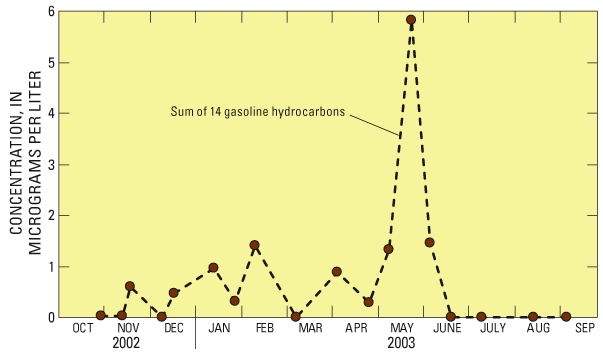
Figure 3. Fourteen gasoline hydrocarbons (benzene, toluene, ethylbenzene, and xylene, plus ten others) were detected in the Clackamas River. Pesticides—Although 15 pesticide compounds were detected during the SWQA study, 63 pesticides have been detected by the USGS in the Clackamas River basin since 2000 (Carpenter and others, 2008), with most detections occurring during storms. The greatest number of compounds detected and highest pesticide concentrations were found in tributaries of the lower Clackamas River that drain predominantly agricultural and (or) urban land. Pesticide concentrations and loads were highest in Deep and Rock Creeks, which drain mostly nursery and rural residential land. Pesticide yields (loads per unit area) were highest in streams draining urban and industrial areas (Cow, Carli, and Sieben Creeks). Potential uses of pesticides in the Clackamas River basin include applications to Christmas trees, nursery stock and other agricultural crops, landscaping and lawns, roads and other right-of-ways, golf courses, and forestland. Potential Effects on Human HealthHuman-Health Benchmarks Used in This AssessmentConcentrations of regulated compounds were compared to USEPA Maximum Contaminant Levels (MCLs), and concentrations of unregulated compounds that have USEPA published toxicity information were compared to USGS Health-Based Screening Levels (HBSLs; Toccalino and others, 2007). About 40 percent of the detected compounds do not have human-health benchmarks or adequate toxicity information for evaluating results in a human-health context. Additionally, human-health benchmarks are developed for individual compounds and not mixtures. The screening-level assessment provides an initial perspective on the potential importance of “man-made” organic compounds in source water; it is not a substitute for a comprehensive risk assessment, which includes many more factors, such as additional avenues of exposure. With the exception of gasoline hydrocarbons, disinfection by-products and the herbicide diuron, concentrations in source and finished water were less than or equal to 0.1 microgram per liter and always less than human-health benchmarks, which are available for about 60 percent of the compounds detected. On the basis of this screening-level assessment, adverse effects to human health are expected to be negligible (subject to limitations of available human-health benchmarks; see inset "Human Health Benchmarks Used in This Assessment"). Concentrations of organic compounds generally were less than 0.1 microgram per liter (µg/L) in finished drinking water; however, concentrations of 14 compounds commonly detected in source and (or) finished water were greater than or equal to 0.1 microgram per liter (table 2). In general, compounds with concentrations greater than 0.1 microgram per liter, such as gasoline hydrocarbons and the herbicide diuron, reflect their widespread use in the Clackamas River basin and their physical properties that allow them to persist in the environment (Gilliom and others, 2006; Zogorski and others, 2006). Concentrations did not exceed USEPA drinking-water standards (Maximum Contaminant Level; MCLs) for regulated compounds in any sample (table 2). Concentrations also were less than USGS Health-Based Screening Levels (HBSLs) established for selected unregulated compounds (see inset "Human Health Benchmarks Used in This Assessment"). The NAWQA screening-level assessment identified two compounds (diuron and chloroform) that occurred at concentrations within a factor of 10 of their USEPA-MCL or USGS-HBSL human-health benchmarks (table 2). Concentrations of benzene in source water approached this “10 times below the benchmark” screening level, and given the frequent detection of this and other gasoline hydrocarbons, may warrant their consideration in low-concentration trends monitoring. Human-health benchmarks are not available for the remaining five compounds that were commonly detected at concentrations greater than 0.1 microgram per liter (table 2). Table 2. Fourteen compounds that were commonly detected in source and (or) finished water had concentrations greater than 0.1 microgram per liter. None of these concentrations exceeded a human-health benchmark; however, benchmarks are only available for 9 of the 14 compounds shown in this table. [Percent occurrence of samples with concentrations greater than or equal to 0.1 µg/L. Reporting level shown is higher value of either source or finished water. MCL values in bold. µg/L, microgram per liter; E, estimated concentration; MCL, Maximum Contaminant Level; HBSL, Health-Based Screening Level; ND, not detected; >, greater than; –, no human-health benchmark available]
1MCL of 10,000 µg/L is for sum of m- & p- plus o-Xylene (mixed xylenes). 2MCL of 80 µg/L is for total THMs (trihalomethanes), including chloroform, bromodichloromethane, dibromochloromethane, and bromoform; Water utility comparison to the MCL is based on a moving annual average of quarterly samples collected at specific points in the distribution system (4 per treatment plant). An important consideration in assessing potential effects for human health is the occurrence of mixtures of organic compounds in source and finished water. The median number of organic compounds detected in source- and finished-water samples from the Clackamas River was four and five compounds, respectively. This was typical of findings at comparable community water systems sampled during the SWQA study having relatively small amounts of agricultural and urban land (Kingsbury and others, 2008). The potential human-health effects of mixtures of co-occurring organic compounds are largely unknown and have not been extensively studied. The effect of one compound on another’s toxicity may be additive, synergistic (Hayes and others, 2006), antagonistic, or may have no effect. With a few exceptions for pesticides with common modes of action, human-health benchmarks generally are not available for specific mixtures. Continued research is needed because human-health benchmarks generally are based on toxicity data for individual compounds, and the effects of low-level mixtures are not well understood (Gilliom and others, 2006). Clackamas River Findings in a National Context, and Possible ImplicationsOverall, the compounds detected in the Clackamas River are among those most frequently detected in ambient stream water and groundwater across the Nation (Gilliom and others, 2006; Zogorski and others, 2006). In addition, with the exception of the gasoline hydrocarbons, which were elevated in the Clackamas River compared with the other SWQA studies, the occurrence and concentrations of organic compounds in source and finished water from the Clackamas River generally were less than those detected at other community water systems (Kingsbury and others, 2008; see inset "Source Water-Quality Assessments by the NAWQA Program Conducted Across the Nation"). Continued research is needed to better understand sources, transport mechanisms, fate in the environment, and possible linkages of these compounds to human health. USGS will continue to collaborate with, and complement the work of other Federal, State, and local organizations, and continue to communicate findings and possible implications and future needs, including, for example:
Source Water-Quality Assessments by the NAWQA Program Conducted Across the NationBeginning in 2002, the USGS NAWQA Program initiated “Source Water-Quality Assessments” (SWQAs) at selected community water systems across the United States (Delzer and Hamilton, 2007). The long-term goal is to complete SWQAs at about 30 systems that withdraw water from streams by 2012 using standard protocols and nationally consistent methods (U.S. Geological Survey, 1997–2006). This USGS Fact Sheet highlights findings from the Clackamas River study, which is one of the first nine community water systems sampled. The fact sheet serves as a companion product to a USGS Scientific Investigations Report and a Data Series Report that present findings for the nine systems across the United States (Carter and others, 2007; Kingsbury and others, 2008). http://water.usgs.gov/nawqa/swqa/. Additional information on the Clackamas River basin Water Quality Assessment is available on the World Wide Web at http://or.water.usgs.gov/clackamas/. References CitedCarpenter, K.D., Sobieszczyk, Steven, Arnsberg, A.J., and Rinella, F.A., 2008, Pesticide occurrence and distribution in the lower Clackamas River basin, Oregon, 2000–2005: U.S. Geological Survey Scientific Investigations Report 2008–5027, 98 p. (https://pubs.usgs.gov/sir/2008/5027) Carter, J.M., Delzer, G.C., Kingsbury, J.A., and Hopple, J.A., 2007, Concentration data for anthropogenic organic compounds in ground water, surface water, and finished water of selected community water systems in the United States, 2002–05: U.S. Geological Survey Data Series 268, 30 p. (https://pubs.usgs.gov/ds/2007/268) Delzer, G.C., and Hamilton, P.A., 2007, National Water-Quality Assessment Program—Source Water-Quality Assessments: U.S. Geological Survey Fact Sheet 2007–3069, 2 p. (http://pubs.er.usgs.gov/usgspubs/fs/fs20073069) Gilliom, R.J., Barbash, J.E., Crawford, C.G., Hamilton, P.A., Martin, J.D., Nakagaki, Naomi, Nowell, L.H., Scott, J.C., Stackelberg, P.E., Thelin, G.P., and Wolock, D.M., 2006, The quality of our Nation’s waters—Pesticides in the Nation’s streams and ground water, 1992–2001: U.S. Geological Survey Circular 1291, 172 p. (http://pubs.er.usgs.gov/usgspubs/cir/cir1291) Hayes, T.B., Case, P. Chui, S., Chung, D., Haeffele, C., Haston, K., Lee, M., Mai, V.P., Jarjuoa, Y., Parker, J., and Tsui, M., 2006, Pesticide mixtures, endocrine disruption, and amphibian declines—Are we underestimating the impact?: Environmental Health Perspectives, v. 114, supplement No. 1, p. 40-50. Kingsbury, J.A., Delzer, G.C., and Hopple, J.A., 2008, Anthropogenic organic compounds in source water of nine community water systems that withdraw from streams, 2002–05: U.S. Geological Survey Scientific Investigations Report 2008–5208, 66 p. (https://pubs.usgs.gov/sir/5208/.) Krasner, S.W., Weinberg, H.S., Richardson, S.D., Pastor, S.J., Chinn, R., Sclimenti, M.J., Onstad, G.D., and Thurston, A.D., Jr., 2006, Occurrence of a new generation of disinfection byproducts: Environmental Science & Technology, v. 40, no. 23, p. 7175–7185. Oregon Department of Environmental Quality, 2007, Benzene in Oregon’s air: Oregon Department of Environmental Quality Fact Sheet DEQ 06-AQ-018a, 1 p. Toccalino, P.L., Norman, J.E., Booth, N.L., and Zogorski, J.S., 2007, Health-Based Screening Levels—A tool for evaluating what water-quality data may mean to human health: U.S. Geological Survey, National Water-Quality Assessment Program, accessed November 24, 2008, at http://water.usgs.gov/nawqa/HBSL/. U.S. Department of Agriculture, 2008, Agricultural Research Service (ARS), Pesticide properties database, accessed March 6, 2008, at http://www.ams.usda.gov/science/pdp/. U.S. Environmental Protection Agency, 1998, Code of Federal Regulations, title 40—Protection of environment, chapter 1—Environmental Protection Agency, subchapter D—Water programs, part 141—National primary drinking water regulations, 40 CFR 141.24: National Archives and Records Administration, September 19, 1997; amended June 19, 1998, accessed January 30, 2009 at http://www.gpoaccess.gov/ecfr/ U.S. Environmental Protection Agency, 2007a, Setting standards for safe drinking water: U.S. Environmental Protection Agency, Office of Ground Water and Drinking Water, accessed June 1, 2007, at http://www.epa.gov/safewater/standard/setting.html U.S. Environmental Protection Agency, 2007b, Unregulated Contaminant Monitoring Program, accessed January 11, 2009, at http://www.epa.gov/safewater/ucmr/ U.S. Geological Survey, 1997–2006, National field manual for the collection of water-quality data: U.S. Geological Survey Techniques of Water-Resources Investigations, book 9, chaps. A1–A9, available at http://water.usgs.gov/owq/FieldManual/ (chapters were originally published during 1997–1999; updates and revisions are ongoing and are summarized at http://water.usgs.gov/owq/FieldManual/mastererata.html). Zogorski, J.S., Carter, J.M., Ivahnenko, Tamara, Lapham, W.W., Moran, M.J., Rowe, B.L., Squillace, P.J., and Toccalino, P.L., 2006, The quality of our Nation’s waters—Volatile organic compounds in the Nation’s ground water and drinking-water supply wells: U.S. Geological Survey Circular 1292, 101 p. (http://pubs.er.usgs.gov/usgspubs/cir/cir1292) USGS promotes public access to water-quality informationThis fact sheet, the USGS national data and investigations reports, and other information are available on the World Wide Web at http://water.usgs.gov/nawqa/swqa. Included at this web site are downloadable data on organic compound occurrence, information on sampling designs and methodology, background on data analyses, and frequently asked questions. |
For additional information contact: Kurt Carpenter, U.S. Geological Survey Gordon McGhee, Clackamas River Water Greg Delzer, U.S. Geological Survey, SWQA Coordinator Part or all of this report is presented in Portable Document Format (PDF); the latest version of Adobe Reader or similar software is required to view it. Download the latest version of Adobe Reader, free of charge. |
|||||||||||||||||||||||||||||||||||||||||||||||||||||||||||||||||||||||||||||||||||||||||||||||||||||||||||||||||||||||||||||||||||||||||||||||||||||||||||||||||||||||||||||||||||||||||||||||||||||||||||||||||||||||||||||||
Carpenter, K.D., and McGhee, Gordon, 2009, Organic compounds in Clackamas River water used for public supply near Portland, Oregon, 2003-05: U.S. Geological Survey Fact Sheet 2009-3030, 6 p.

![]() U.S. Department of the Interior |
U.S. Geological Survey
U.S. Department of the Interior |
U.S. Geological Survey
URL: http://
pubsdata.usgs.gov
/pubs/fs/2009/3030/index.html
Page Contact Information: GS Pubs Web Contact
Page Last Modified: Tuesday, 29-Nov-2016 17:32:29 EST
