Introduction
The input of freshwater and associated nutrients into Lynch Cove and lower Hood Canal (fig. 1) from sources such as groundwater seeps, small streams, and ephemeral creeks may play a major role in the nutrient loading and hydrodynamics of this low dissolved-oxygen (hypoxic) system. These disbursed sources exhibit a high degree of spatial variability. However, few in-situ measurements of groundwater seepage rates and nutrient concentrations are available and thus may not represent adequately the large spatial variability of groundwater discharge in the area. As a result, our understanding of these processes and their effect on hypoxic conditions in Hood Canal is limited.
To determine the spatial variability and relative intensity of these sources, the U.S. Geological Survey Washington Water Science Center collaborated with the University of Washington Applied Physics Laboratory to obtain thermal infrared (TIR) images of the nearshore and intertidal regions of Lynch Cove at or near low tide. In the summer, cool freshwater discharges from seeps and streams, flows across the exposed, sun-warmed beach, and out on the warm surface of the marine water. These temperature differences are readily apparent in aerial thermal infrared imagery that we acquired during the summers of 2008 and 2009. When combined with co-incident video camera images, these temperature differences allow identification of the location, the type, and the relative intensity of the sources.
|
 Figure 1. Location of Lynch Cove and Hood Canal in Puget Sound, Washington.
|
|
 An area of Lynch Cove during low tide showing diffuse nature of freshwater inputs as small rivulets and dispersed seepage.
|
How does it work?
The aerial imaging system consists of a thermal infrared camera and a video camera mounted on a small aircraft. The thermal camera is an ICI 320×240-pixel microbolometer with a 19 degree field-of-view that measures long-wave infrared radiation at 8–12 microns. It is sensitive to changes in temperature of 0.1 degree Celsius, which is adequate to observe the fine surface-temperature structure in seawater, where variations of 0.5 to several degrees Celsius are typical. The video camera is an uncalibrated, visible band RGB (red, green, blue), 1392×1040-pixel Lumenera™, with a 30 degree field-of-view, which is used to record color images for later reference and can be used to qualitatively assess the relative abundance of near surface phytoplankton blooms and turbidity. The location and orientation of each image is measured using a Global Positioning System, digital compass, and accelerometers, logged once per second on a laptop, and combined later for geo-registration.
For each of the 2 years, these surveys yielded approximately 1,500 images of the shoreline, and most images showed some evidence of cool (that is, fresh) water flowing into Lynch Cove. Each TIR image was referenced to a uniform temperature scene from the middle of Lynch Cove to provide a common reference and colorized to accentuate the cool signatures. The coldest temperature differences (less than negative 0.5 degrees Celsius) are indicated by the bright cyan color; the color shifts to black as the temperature differences approach plus 0.5 degrees Celsius. Temperature differences greater than 0.5 degrees Celsius are mapped to a grey scale where white corresponds to plus 5.0 degrees Celsius.
|
Why use TIR?
Aerial TIR imaging allows researchers to identify freshwater inputs to the nearshore over a large area in a relatively short period. This ‘snapshot’ or synoptic view of the shoreline at a given time provides a better understanding of the spatial patterns of freshwater inputs to Lynch Cove. Additionally, these images can be used as a cost effective exploratory tool to direct research in areas where characterizing freshwater inputs is needed for a better evaluation of nutrient loading from groundwater.
Accessing TIR images
Aerial TIR images from the summers of 2008 and 2009 are available on the internet at http://wa.water.usgs.gov/projects/hoodcanal/tirbackground.html. Each image location is plotted on a Google Map© so that the user can click on a location and view the visible and infrared image side-by-side.
Aerial photographs were taken on September 2, 2008, from approximately 11:45 AM to 12:45 PM Pacific Standard Time. The tide at Union was about plus 2.5 feet referenced to mean low-low water. In 2009, image acquisition took place on August 18 from approximately 8:30 to 9:30 AM Pacific Standard Time. Because aerial photographs were taken early in the day during 2009, the shadows from trees fall across some of the intertidal region, requiring particular care in interpreting these images. The tide at Union was approximately minus 2.0 feet mean low-low water during the 2009 flights. Locations of sample images are shown in figure 2 and the corresponding aerial TIR images are shown in figures 3–8.
Sample Images
The sample images that follow illustrate some of the phenomena seen in the imagery. The red and white numbers on each image are the image identifier, and the latitude and the longitude of the image pair, respectively.
|
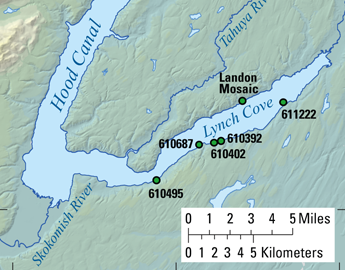 Figure 2. Locations of sample image sites, Lynch Cove, Washington.
|
 Figure 3. A point source of groundwater creates a plume in the nearshore (image 610392, acquired August 18, 2009).
 Figure 4. Water emanates from a bulkhead and flows across the intertidal zone (image 610402, acquired August 18, 2009).
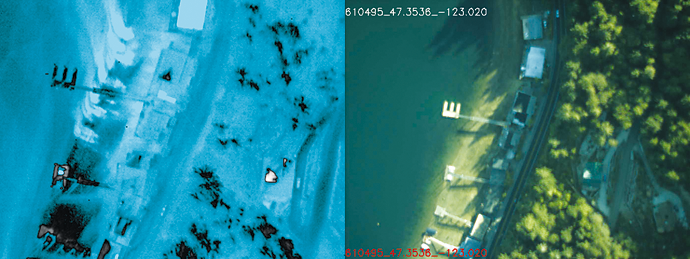 Figure 5. Multiple groundwater point sources in the intertidal zone (image 610495: acquired August 18, 2009).
 Figure 6. A stream flows across an alluvial fan at Twanoh State Park, Washington (image 610687, acquired August 18, 2009).
 Figure 7. Braided (unnamed) streamflow on a mud flat just west of Sunset Beach, Washington (image 611222, acquired August 18, 2009).
 Figure 8. A mosaic of several adjacent images from the north shore near Landon Road, Belfair, Washington, showing the extent of diffuse groundwater discharge (images, Landon mosaic, acquired August 18, 2009).
|
|
First posted May 27, 2007
Part or all of this report is presented in Portable Document Format (PDF); the latest version of Adobe Reader or similar software is required to view it. Download the latest version of Adobe Reader, free of charge. |

