Fact Sheet 2010–3078
|
A comprehensive national analysis of the distribution and trends of nutrient concentrations in streams and groundwater from 1992 through 2004 is provided by the National Water-Quality Assessment (NAWQA) Program of the United States Geological Survey (USGS). Findings describe the distribution and causes of varying nutrient concentrations in streams and groundwater throughout the Nation and examine the primary sources that contribute to elevated concentrations. Results show that excessive nutrient enrichment is a widespread cause of ecological degradation in streams and that nitrate contamination of groundwater used for drinking water, particularly shallow domestic wells in agricultural areas, is a continuing human-health concern. Finally, despite major Federal, State and local nonpoint-source nutrient control efforts for streams and watersheds across the Nation, USGS trend analyses for 1993–2003 suggest limited national progress to reduce the impacts of nonpoint sources of nutrients during this period. Instead, concentrations have remained the same or increased in many streams and aquifers across the Nation, and continue to pose risks to aquatic life and human health. This Fact Sheet highlights selected national findings and their implications, and serves as a companion product to the complete analysis reported in the USGS Circular titled “The Quality of Our Nation’s Waters—Nutrients in the Nation’s Streams and Groundwater, 1992–2004.” Occurrence and Distribution of Nutrients in Streams and Groundwater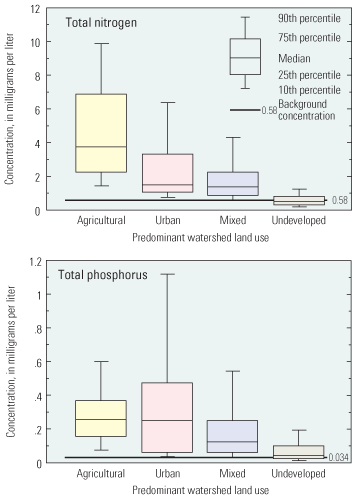
Concentrations of total nitrogen and total phosphorus in streams. Streams—Nutrients can occur naturally in water (referred to as "background"), but elevated concentrations usually originate from man-made sources, such as artificial fertilizers, manure, and septic-system effluent. All five nutrients studied—nitrate, ammonia, total nitrogen, orthophosphate, and total phosphorus—exceeded background concentrations at more than 90 percent of 190 sampled streams draining agriculture and urban watersheds. Nutrient concentrations in streams are directly related to land use and associated fertilizer applications and human and animal wastes in upstream watersheds. Total nitrogen concentrations were higher in agricultural streams than in streams draining urban, mixed land use, or undeveloped areas, with a median concentration of about 4 mg/L—about 6 times greater than background concentrations. Nitrogen concentrations in agricultural streams generally were highest in the Northeast, Midwest, and the Northwest, which have some of the most intense applications of fertilizer and manure in the Nation. Concentrations in parts of the Midwest also are accentuated by artificial subsurface tile drains, which are used to promote rapid dewatering of poorly drained soils. Atmospheric deposition accounts for a significant portion of the nitrogen in streams in some relatively undeveloped watersheds, such as occur in the Northeast. Total nitrogen concentrations were lower in urban streams than in agricultural streams, with a median concentration of less than 2 mg/L, but still about 3 times greater than background concentrations. Some of the highest concentrations in urban streams were downstream of wastewater-treatment facilities. Total phosphorus concentrations were highest in streams in agricultural and urban areas, with a median concentration of about 0.25 mg/L—about 6 times greater than background concentrations. Like nitrogen, high concentrations of phosphorus in agricultural settings are associated with high applications of fertilizers and manure. Urban sources may include treated wastewater effluent and septic-system drainage (in less urbanized settings), as well as runoff from residential lawns, golf courses, and construction sites. The amounts of nitrogen and phosphorus leaving watersheds in streamflow—referred to as yields (expressed as mass per unit area)—increased with increasing nutrient inputs from nonpoint sources to a watershed, regardless of land use. In addition, 5–50 percent of the nitrogen input from nonpoint sources was exported out of most watersheds. Variability in watershed nutrient yields can be explained in part by differences in agricultural practices and in soils, geology, and hydrology. For example, agricultural lands with extensive subsurface tile drains are 3 times more likely to yield more than 25 percent of applied nitrogen to streams than agricultural lands with fewer drains. However, less nitrogen is contributed to streams in the Southeast because of greater amounts of denitrification in the soil, as well as in shallow groundwater that ultimately discharges to streams. Less nitrogen also reaches western streams, but for different reasons—generally low amounts of precipitation and runoff, as well as the modification of flow systems by irrigation and impoundments. Phosphorus is less soluble and mobile than nitrogen and thus, phosphorus yields are lower than nitrogen yields for most streams. Groundwater—Nitrate, the primary nutrient of concern in groundwater, exceeded background concentrations in 64 percent of shallow wells (depths of less than 100 feet below land surface) in agricultural and urban areas. Concentrations of the other nutrients in groundwater were not significantly greater than background concentrations. Nitrate concentrations in groundwater were highest (median of 3.1 mg/L) in shallow wells in agricultural areas that are associated with high fertilizer and manure applications. Nitrate concentrations were lowest in shallow wells in urban areas (median of 1.4 mg/L), and in deep wells in major aquifers. The vulnerability of aquifers to nitrate does not depend solely on nutrient sources, but also on groundwater age and geochemical conditions that govern nitrate concentrations in groundwater. Nitrate concentrations were significantly higher in well-oxygenated (or "oxic") groundwater regardless of land use and nitrogen sources. For example, the median nitrate concentration for wells in agricultural areas was 5.5 mg/L in oxic water, but was almost undetectable in less oxygenated (or "reduced") water despite similar nitrogen inputs at the land surface. Nitrate concentrations are especially influenced by the combination of groundwater age and geochemistry; for example, concentrations greater than the U.S. Environmental Protection Agency (USEPA) Maximum Contaminant Level (MCL) of 10 mg/L as nitrogen were never found in groundwater with low dissolved-oxygen concentrations and recharged prior to 1950. Groundwater contributions of nutrients to streams can be significant—particularly for nitrate. At least one-third of the total annual load of nitrate in two-thirds of 148 small streams studied across the Nation was derived from base flow, consisting mostly of groundwater. Groundwater also can contribute significant amounts of dissolved phosphorus to streams, particularly where natural sources of phosphorus are present in the aquifer and reduced chemical conditions favor phosphorus transport. Natural processes—including physical, chemical, and biological—can affect exchanges between groundwater and streams. In stream settings containing organic-rich sediments and low dissolved-oxygen concentrations, bacteria convert dissolved nitrate in groundwater to innocuous nitrogen gas through the process of denitrification. These processes are most effective where the geometry of the local aquifer focuses most of the groundwater flow through organic–rich sediments. Nutrients also can be removed by plants in the riparian zone. 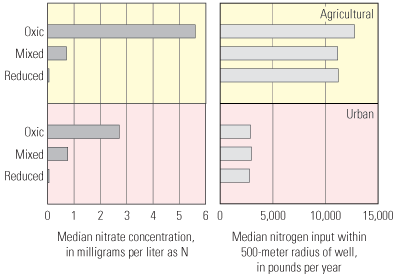
Nitrate concentrations and nitrogen inputs at land surface for Implications
Potential for Effects on Human Health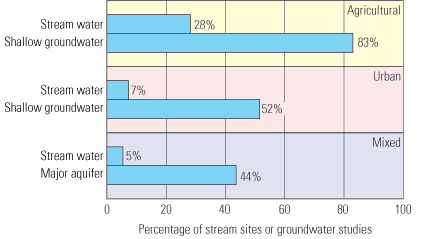
Percentage of streams or groundwater studies with one or more nitrate concentrations exceeding the MCL of 10 mg/L. Streams—Nitrate concentrations in streams seldom exceeded the USEPA MCL of 10 mg/L as nitrogen—nitrate exceeded the MCL in 2 percent of 27,555 samples, and in 1 or more samples from 50 of 499 streams. Most streams with concentrations greater than the MCL drained agricultural watersheds and were particularly common in the upper Midwest, where the use of fertilizer and (or) manure is relatively high and tile drains are common. Nearly 30 percent of agricultural streams had one or more samples with a nitrate concentration greater than the MCL, compared to about 5 percent of the streams draining urban land. None of the samples from streams draining undeveloped watersheds had a concentration greater than the MCL. Groundwater—Nitrate concentrations greater than the MCL are more prevalent and widespread in groundwater than in streams. Eighty-three percent of studies of shallow groundwater in agricultural areas had one or more samples (of 20 to 30 wells sampled) with a nitrate concentration greater than the MCL. Nationwide, concentrations exceeded the MCL in about 7 percent of 2,388 domestic wells. Elevated concentrations were most common in domestic wells that are shallow (less than 100 feet deep) and located in agricultural areas because of relatively large nitrogen sources, including septic systems, fertilizer use, and livestock. Concentrations exceeding the MCL were less common in public-supply wells (about 3 percent of 384 wells). The lower percentage in public wells compared to domestic wells reflects a combination of factors, including (1) greater depths and hence age of the groundwater; (2) longer travel times from the surface to the well, allowing denitrification and (or) attenuation during transport; and, (3) locations of most public wells near urbanized areas where sources of nitrate generally are less prevalent than in agricultural areas. Implications
Photograph © iStockphoto.com/Genesis Photography.
Effects on Aquatic LifeUSGS findings show the status of streams with respect to geographic variability of USEPA recommended nutrient criteria, the response of aquatic biota to varying nutrient levels, and the status of streams with respect to USEPA ammonia toxicity criteria. Recommended nutrient criteria for nitrogen and phosphorus in streams and rivers have been established by USEPA for protecting beneficial ecological uses and preventing nuisance plant growth for different geographic regions of the country. NAWQA results show that measured concentrations of nitrogen and phosphorus were substantially greater than USEPA recommended nutrient criteria in most agricultural and urban streams in the majority of regions across the Nation. Specifically, median concentrations of nitrogen and phosphorus measured at 133 agricultural streams typically were 2 to more than 10 times higher than recommended nutrient criteria. Chlorophyll a, a measure of algal biomass, along with concentrations of nitrogen and phosphorus, are used by USEPA, States, Tribes, and Territories to evaluate nutrient criteria and enrichment in streams. Findings suggest that relations between nutrients and chlorophyll a often are weak because other factors, including stream characteristics such as water temperature, flow, and canopy cover, can affect the growth of algal biomass regardless of nutrient concentrations. This results in a relatively wide range of algal response to nutrients in streams even within the same region. In addition, nutrient concentrations in some regions are so much greater than required for plant growth that additional increases in nutrients have little effect on plant biomass. 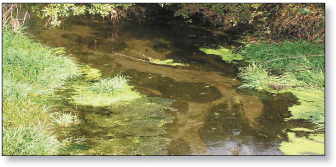
Stream ecosystem health can be assessed by measuring the numbers and types of individuals comprising algal, macroinvertebrate, and fish communities to determine the biological condition. Results show that the biological condition of all three communities, expressed as a percentage of the condition expected in minimally disturbed streams, declined with increasing concentrations of nitrogen and phosphorus. Changes were most pronounced for algal communities, in which the average biological condition in streams with elevated nutrients was only about 50 percent, compared to about 80 percent for streams with the lowest nutrient concentrations. 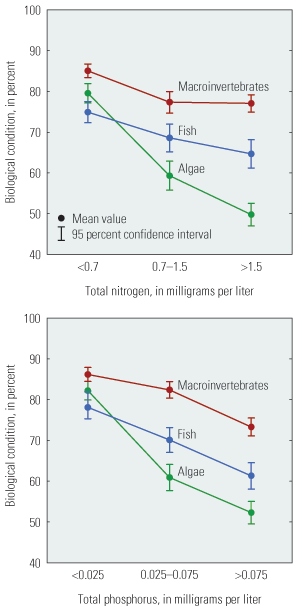
Biological condition for algae, macroinvertebrates, and fish for three ranges of nutrient concentrations. Concentrations of ammonia in streams seldom exceeded the USEPA criteria for protecting aquatic life from ammonia toxicity. Specifically, concentrations exceeded the acute criteria in only 33 samples from 7 streams, out of about 24,000 samples collected from 499 streams. Concentrations exceeded the chronic criteria in 139 samples from 22 sites. The acute and chronic criteria were most often exceeded in streams that drain watersheds with urban and mixed land uses in the semiarid west. Many of these streams also receive treated effluent from wastewater-treatment facilities. Few agricultural sites had concentrations greater than acute (1 site) or chronic (5 sites) criteria, despite relatively large fertilizer and manure sources. More stringent ambient water-quality criteria for ammonia have been proposed by USEPA that would be more protective of aquatic life. Implications
Changes in Nutrient Concentrations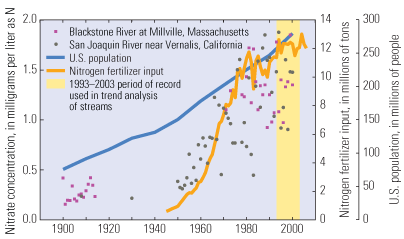
The NAWQA trends assessment for nutrients in streams reflects periodic measurements of concentrations of nitrogen and phosphorus from 1993 to 2003 (yellow vertical shaded area). This was a period of relatively small changes in nitrogen fertilizer use, which followed a more than 10-fold increase in fertilizer use between about 1950 and the early 1980s. There also has been a more than three-fold increase in population in the Nation since 1900. These increases in nitrogen sources are reflected in the large increases in concentrations of nitrate in streams as disparate as the Blackstone River in urbanized Massachusetts and the San Joaquin River in the agricultural Central Valley of California. Streams—Nitrogen and phosphorus concentrations did not change significantly from 1993 to 2003 in most streams sampled across the Nation. This pattern generally coincides with relatively stable sources of nutrients since the 1980s, including use of fertilizers, applications of manure, and atmospheric deposition of nitrogen. Sources of nutrients, however, are only one factor that can cause increases or decreases in concentrations. Nutrient concentrations also are influenced by natural variations in precipitation and streamflow, as well as by human activities that affect nutrient transport to streams, such as tile drains, conservation tillage, and other management practices. To focus on trends caused by humans, the NAWQA trend analysis used "flow-adjusted" nutrient concentrations. Flow adjustment, using long-term records of streamflow, removes variability and trends in concentrations likely caused by natural changes in streamflow. In streams with statistically significant flow-adjusted trends, upward trends were more common than downward trends. Specifically, flow-adjusted concentrations increased at 33 and 21 percent of sites for phosphorus and nitrogen, respectively, and decreased at 16 percent of sites for both nutrients. Increasing nutrient concentrations were most common in relatively pristine streams (those with nutrient concentrations less than USEPA's recommended regional nutrient criteria). Nearly 40 and 30 percent of these less impacted sites showed upward trends in phosphorus and nitrogen, respectively. 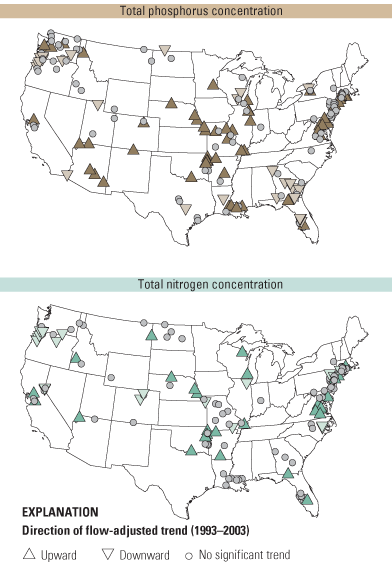
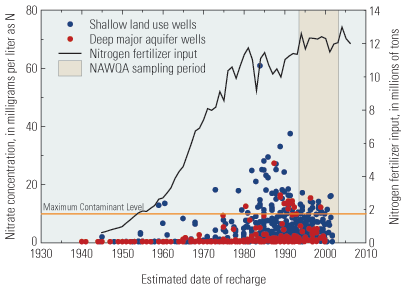
Nitrate concentration of groundwater samples plotted by estimated recharge date. Groundwater—Estimates of groundwater recharge dates—the date when infiltrating water reaches the water table—show that concentrations of nitrate generally have increased since about 1975, consistent with trends in historical fertilizer use in the United States. These findings also are consistent with rates of groundwater flow, which can take years to decades to move from the water table to a well. Nitrate concentrations were elevated in shallow wells as early as the 1950s and 1960s, whereas concentrations in the deep aquifers were not elevated until the 1970s. Nitrate concentrations continued to increase in groundwater over the NAWQA decadal sampling interval (spanning from the first sampling period of 1988–1995 to the second sampling period of 2001 and 2004). Overall, the proportion of 495 wells with concentrations greater than the USEPA MCL of 10 mg/L increased from 16 to 21 percent from the first to the second sampling period. Increases were most common in shallow groundwater beneath agricultural areas. Specifically, median nitrate concentrations increased in the agricultural shallow groundwater from 4.8 to 5.7 mg/L, whereas in deep groundwater in major aquifers, the median nitrate concentration increased from 1.2 to 1.5 mg/L. Implications
NAWQA Approach to Nutrient Assessment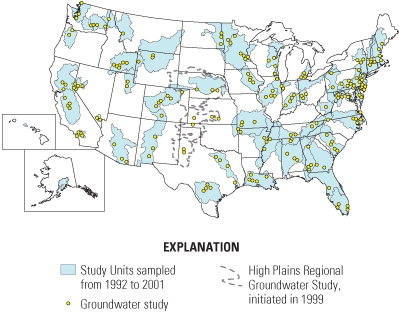
NAWQA assessments of nutrients followed a nationally consistent approach in 51 of the Nation's major river basins and aquifer systems during 1992–2001. Water samples were collected from 499 stream sites monthly and during periods of both high and low stream flow, usually for a minimum of two years. Biological communities were assessed at about 1400 stream sites. Ground-water samples were collected from 5,101 wells, including monitoring, domestic, and public-supply wells. Trends in nutrient concentrations in streams were assessed at 171 and 137 stream sites, for phosphorus and nitrogen respectively, sampled from 1993 to 2003. Changes in nitrate concentrations in groundwater were assessed by measuring concentrations in 495 wells in 1988 to 1995, then again from 2001 to 2004. Most water samples were analyzed for five measures of nitrogen- and phosphorus-containing nutrients: total nitrogen, nitrate, ammonia, total phosphorus, and orthophosphate. |
First posted September 23, 2010 For additional information contact: Part or all of this report is presented in Portable Document Format (PDF); the latest version of Adobe Reader or similar software is required to view it. Download the latest version of Adobe Reader, free of charge. |
Dubrovsky, N.M., and Hamilton, P.A., 2010, Nutrients in the Nation’s streams and groundwater: National Findings and Implications: U.S. Geological Survey Fact Sheet 2010-3078, 6 p.

![]() U.S. Department of the Interior |
U.S. Geological Survey
U.S. Department of the Interior |
U.S. Geological Survey
URL: http://pubsdata.usgs.gov/pubs/fs/2010/3078/index.html
Page Contact Information: GS Pubs Web Contact
Page Last Modified: Tuesday, 29-Nov-2016 17:41:17 EST
