Fact Sheet 2011—3139
The San Fernando–San Gabriel Study UnitThe San Fernando–San Gabriel study unit is approximately 460 square miles and consists of the San Fernando Valley, Raymond, and San Gabriel Valley groundwater basins (California Department of Water Resources, 2003). The study unit has hot, dry summers and cool, moist winters. Average annual rainfall ranges from 17 to 21 inches over the three basins. The study areas are drained by the Los Angeles, San Gabriel, and Rio Hondo rivers and their tributaries (Land and Belitz, 2008). 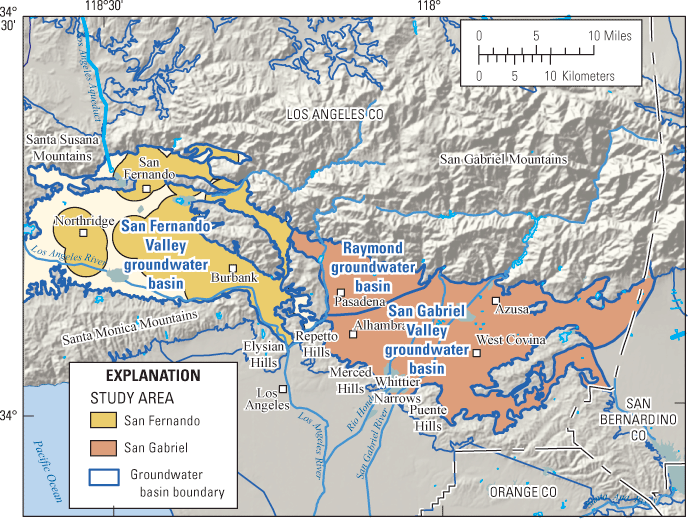
The San Fernando and San Gabriel Valleys are sedimentologically diverse basins situated within the Transverse Ranges of southern California. These structurally complex basins formed as a result of the dextral slip of the San Andreas Fault system in the late Tertiary-Quaternary (Tinsley, 2001). The valleys have been filled, up to 6,400 feet, with marine and terrestrial sediments of Pleistocene through Holocene age that overlie crystaline basement. The alluvium and underlying marine deposits contain freshwater used for supply. The primary aquifers in the study unit are defined as those parts of the aquifers corresponding to the perforated intervals of wells listed in the California Department of Public Health (CDPH) database. Public-supply wells are typically drilled to depths of 400 to 785 feet, consist of solid casing from the land surface to a depth of about 157 to 300 feet, and are perforated below the solid casing. Water quality in the primary aquifers may differ from that in the shallower and deeper parts of the aquifer system. Groundwater movement is generally from the northern parts of the valleys south towards the Pacific Ocean. Land use in the study unit is approximately 83 percent (%) urban, 16% natural, and 1% agricultural. The urban landscape consists of residential, commercial, and industrial areas. Natural lands are mostly shrublands and grasslands. The largest urban areas are Los Angeles, San Fernando, Northridge, Burbank, Pasadena, Alhambra, Azusa, and West Covina. Recharge to the groundwater basins occurs from the infiltration of runoff and imported water at spreading basins, infiltration of precipitation and irrigation, and infiltration of streamflow from the major rivers and their tributaries. Streamflow is a combination of runoff from the surrounding mountains, imported water, industrial discharges, and treated wastewater effluent. The primary sources of discharge are water pumped for municipal supply and for irrigation. 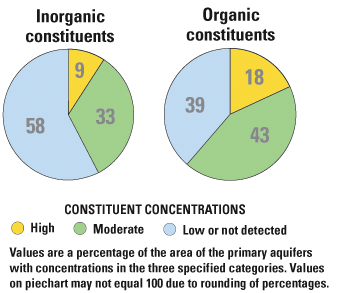
Overview of Water QualityGAMA’s Priority Basin Project evaluates the quality of untreated groundwater. However, for context, benchmarks established for drinking-water quality are used for comparison. Benchmarks and definitions of high, moderate, and low concentrations are discussed in the inset box. Many inorganic constituents occur naturally in groundwater. The concentrations of the inorganic constituents can be affected by natural processes as well as by human activities. In the San Fernando–San Gabriel study unit, one or more inorganic constituents were present at high concentrations in about 9% of the primary aquifers and at moderate concentrations in about 33%. Man-made organic constituents are found in products used in the home, business, industry, and agriculture. Organic constituents can enter the environment through normal usage, spills, or improper disposal. In this study unit, one or more organic constituents were present at high concentrations in 18% of the primary aquifers and at moderate concentrations in about 43% RESULTS: Groundwater Quality in the San Fernando–San Gabriel Study Unit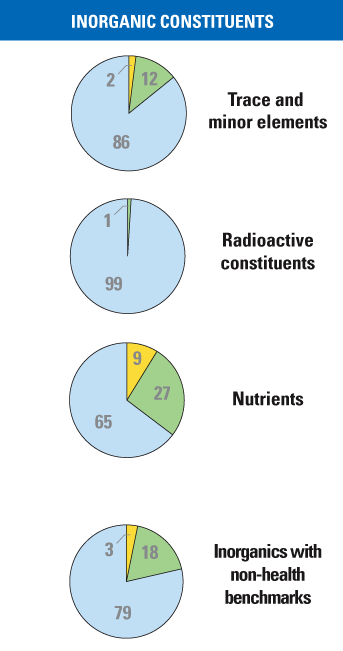
Inorganic Constituents with Human-Health BenchmarksTrace and minor elements are naturally present in the minerals in rocks and soils and in the water that comes into contact with those materials. In the San Fernando–San Gabriel study unit, trace and minor elements were present at high concentrations in about 2% of the primary aquifers. Chromium was the trace element detected at high concentration, and fluoride was the minor element detected at high concentration. Aluminum, lead, and vanadium also occurred at high concentrations, but in less than 1% of the primary aquifers. Radioactivity is the release of energy or energetic particles during spontaneous decay of unstable atoms. Most of the radioactivity in groundwater comes from the decay of naturally occurring isotopes of uranium and thorium in minerals in the sediments of the aquifer. Gross alpha radioactivity occurred at high levels in less than 1% of the primary aquifers. Radium had high concentration in the CDPH database in less than 1% of the primary aquifers, but this high value was not the most recent data used in this assessment. Nutrients, such as nitrate and nitrite, are naturally present at low concentrations in groundwater. High and moderate concentrations generally occur as a result of human activities, such as applying fertilizer to crops. Livestock, when in concentrated numbers, and septic systems also produce nitrogenous waste that can leach into groundwater. Nitrate was present at high concentrations in about 9% of the primary aquifers, and at moderate concentrations in about 27% of the primary aquifers. Inorganic Constituents with Non-Health Benchmarks(Not included in water-quality overview charts shown)Some constituents affect the aesthetic properties of water, such as taste, color, and odor, or may create nuisance problems, such as staining and scaling. The State of California has a recommended and an upper limit for total dissolved solids (TDS) in drinking water. All water naturally contains TDS as a result of the weathering and dissolution of minerals in soils. Anoxic conditions (very low amounts of dissolved oxygen) in groundwater may result in release of the naturally occurring elements manganese and iron from minerals into groundwater. In the San Fernando–San Gabriel study unit, iron was present at high concentrations in about 3% of the primary aquifers. TDS was present at high concentrations (greater than the upper limit) in less than 1% of the primary aquifers. About 18% of the primary aquifers had moderate TDS concentrations (between the recommended and upper limits). 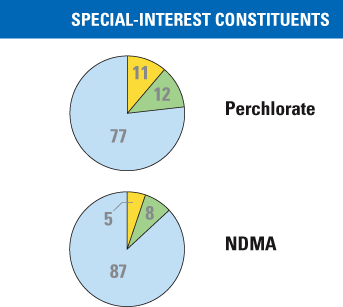
Perchlorate and N-Nitrosodimethylamine (NDMA)(Not included in water-quality overview charts shown)Perchlorate is an inorganic constituent which has been regulated in California drinking water since 2007. It is an ingredient in rocket fuel, fireworks, safety flares, and other products, may be present in some fertilizers, and also occurs naturally at low concentrations in groundwater. Perchlorate was detected at high concentrations in about 11% of the primary aquifers, and at moderate concentrations in 12%. NDMA, a semi-volatile organic chemical, is of special interest in California because it has recently been detected in drinking-water supplies. NDMA was present at high concentrations in about 5% of the primary aquifers, and at moderate concentrations in about 8%. 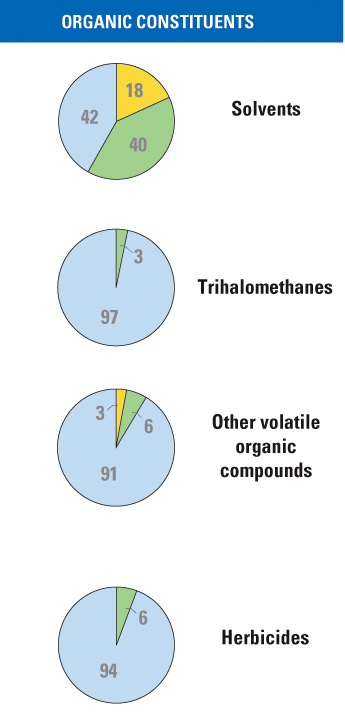
Organic ConstituentsThe Priority Basin Project uses laboratory methods that can detect low concentrations of volatile organic compounds (VOCs) and pesticides, far below human-health benchmarks. VOCs and pesticides detected at these low concentrations can be used to help trace water from the landscape into the aquifer system. Volatile Organic Compounds with Human-Health BenchmarksVOCs, which include solvents, organic synthesis reagents, and trihalomethanes, are in many household, commercial, industrial, and agricultural products and are characterized by their tendency to volatilize (evaporate) into the air. Solvents are used for a number of purposes, including manufacturing and cleaning. In the San Fernando–San Gabriel study unit, solvents were present at high concentrations in about 18% of the primary aquifers. The solvents detected at high concentrations were trichloroethene (TCE) (14.8%), perchloroethene (PCE) (11.2%), carbon tetrachloride (6.5%), 1,2-dichloroethane (1.9%), cis-1,2-dichloroethene (1.0%), and 1-dichloroethane (0.5%). Solvents were present at moderate concentrations in about 40% of the primary aquifers. Trihalomethanes may form during municipal water purification and enter groundwater by the infiltration of landscape irrigation water. Trihalomethanes were not detected at high concentrations, and were detected at moderate concentrations in about 3% of the primary aquifers. Within the classification of “other VOCs,” the organic synthesis reagent 1,1-dichloroethene was detected at high concentration in about 3% of the primary aquifers, and at moderate concentrations in about 6%. Refrigerants and gasoline additives, also included in the class “other VOCs”, were detected at moderate concentrations in less than 1% of the primary aquifers (Land and others, 2012). Pesticides with Human-Health BenchmarksPesticides, which include herbicides, fumigants, and insecticides, are applied to crops, gardens, lawns, around buildings, and along roads to help control unwanted vegetation (weeds), insects, fungi, and other pests. In the San Fernando–San Gabriel study unit, herbicides were not detected at high concentrations in the primary aquifers, but the herbicide atrazine was detected at moderate concentrations in about 6% of the primary aquifers. Insecticides were not detected at high or moderate concentrations. BENCHMARKS FOR EVALUATING GROUNDWATER QUALITY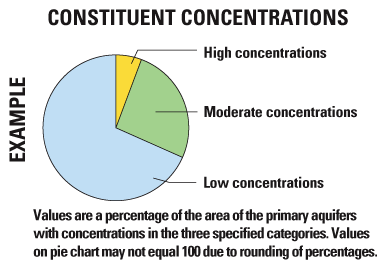
GAMA’s Priority Basin Project uses benchmarks established for drinking water to provide context for evaluating the quality of untreated groundwater. After withdrawal, groundwater may be disinfected, filtered, mixed, and exposed to the atmosphere before being delivered to consumers. Federal and California regulatory benchmarks for protecting human health (Maximum Contaminant Level, MCL) were used when available. Nonregulatory benchmarks for protecting aesthetic properties, such as taste and odor (Secondary Maximum Contaminant Level, SMCL), and nonregulatory benchmarks for protecting human health (Notification Level, NL, and Lifetime Health Advisory, HAL) were used when Federal or California regulatory benchmarks were not available. High, moderate, and low concentrations are defined relative to benchmarksConcentrations are considered high if they are greater than a benchmark. For inorganic constituents, concentrations are moderate if they are greater than one-half of a benchmark. For organic and special-interest constituents, concentrations are moderate if they are greater than one-tenth of a benchmark; this lower threshold was used because organic constituents are generally less prevalent and have smaller concentrations relative to benchmarks than inorganic constituents. Low concentrations include non-detections and values less than moderate concentrations. Methods for evaluating water quality are discussed by Land and others (2012). Factors that Affect Groundwater QualityIn the San Fernando–San Gabriel study unit, solvents were detected at high concentrations in 18% of the primary aquifers, while in most California Priority Basin Project study units, solvents were detected at high concentrations in less than 2% of the primary aquifers (for example, Kulongoski and Belitz, 2011). Overall, solvents were detected in 86% of the grid wells sampled. The number of solvents detected in each well ranged from 1 to 11, and the solvent concentrations ranged from 0.01 to 220 micrograms per liter (μg/L). The median human-health regulatory benchmark for the 15 solvents detected is 6 μg/L (Land and others, 2012). The six solvents that were detected at high concentrations also were frequently detected. PCE and TCE were detected in more than 50% of the primary aquifers. 1,1-Dichloroethane, carbon tetrachloride, and cis-1,2-dichloroethene were detected in more than 30%, and 1,1,1-trichloroethane was detected in more than 10% of the grid wells sampled. In addition, six solvents were recorded at high concentrations in the CDPH database for the period before May 1, 2002, but not during the period of study, May 1, 2002–April 30, 2005 (Land and others, 2012). The map below shows the distribution of solvents in groundwater and the locations of known solvent plumes in groundwater. High concentrations of solvents are generally clustered in the southern San Gabriel Valley and the central southern San Fernando Valley. Sources of solvents include metal plating, machinery degreasing, and dry cleaning. More than a dozen solvent plumes have been documented in the area (U.S. Environmental Protection Agency, 2009; San Gabriel Basin Water Quality Authority, 2011). The discovery of solvents in San Gabriel Valley groundwater in 1980 led to the formation of the San Gabriel Basin Water Quality Authority in 1993 and extensive treatment programs to remove volatile organic compounds from drinking-water supplies (San Gabriel Basin Water Quality Authority, 2011). 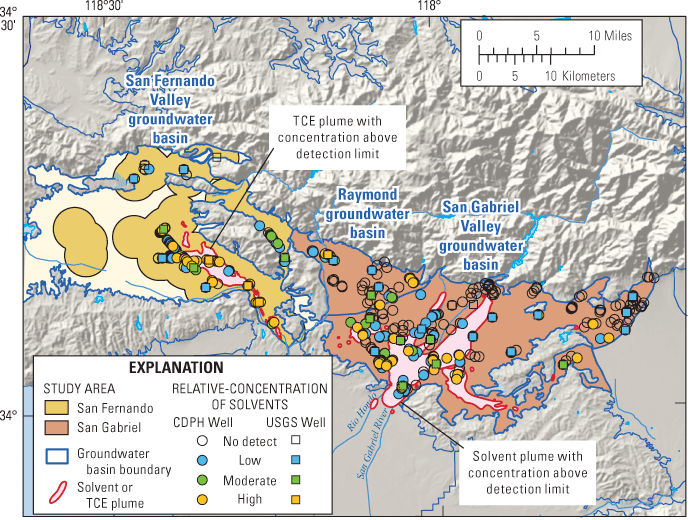
Priority Basin AssessmentsGAMA’s Priority Basin Project (PBP) assesses water quality in that part of the aquifer system used for drinking water, primarily public supply. Water quality in shallower and deeper parts may differ from that in the primary aquifers. GAMA’s Domestic Well Project assesses water quality in the shallower parts of the aquifer system. Ongoing assessments are being conducted in more than 120 basins throughout California. The PBP assessments are based on a comparison of constituent concentrations in untreated groundwater with benchmarks established for the protection of human health and for aesthetic concerns. The PBP does not evaluate the quality of drinking water delivered to consumers. The PBP uses two scientific approaches for assessing groundwater quality. The first approach uses a network of wells to statistically assess the status of groundwater quality. The second approach combines water-quality, hydrologic, geographic, and other data to help assess the factors that affect water quality. In the San Fernando–San Gabriel study unit, data were collected by the PBP in 2005 and from the CDPH database for 2002–2005. The PBP includes chemical analyses generally not available as part of regulatory compliance monitoring, including measurements at concentrations much lower than human-health benchmarks, and measurement of constituents that can be used to trace the sources and movement of groundwater. SELECTED REFERENCESCalifornia Department of Water Resources, 2003, California’s groundwater: California Department of Water Resources Bulletin 118, 246 p. Available at http://www.water.ca.gov/groundwater/bulletin118/update2003.cfm. Kulongoski, J.T., and Belitz, Kenneth, 2011, Status and understanding of groundwater quality in the Monterey Bay and Salinas Valley Basins, 2005—California GAMA Priority Basin Project: U.S. Geological Survey Scientific Investigations Report 2011–5058, 84 p. Available at https://pubs.usgs.gov/sir/2011/5058/. Land, Michael, and Belitz, Kenneth, 2008, Ground-water quality data in the San Fernando–San Gabriel study unit, 2005—Results from the California GAMA Program: U.S. Geological Survey Data Series 356, 84 p. Available at https://pubs.usgs.gov/ds/356/. Land, Michael, Kulongoski, J.T., and Belitz, Kenneth, 2012, Status of groundwater quality in the San Fernando–San Gabriel groundwater basins, 2005—California GAMA Priority Basin Project: U.S. Geological Survey Scientific Investigations Report 2011-5206, 66 p. Available at https://pubs.usgs.gov/sir/2011/5206 San Gabriel Basin Water Quality Authority, 2011, accessed on March 21, 2011, at http://www.wqa.com Tinsley, J.C., III, 2001, Aspects of the quaternary geology of the San Fernando Valley, California, Cordilleran Section—97th Annual Meeting, and Pacific Section, American Association of Petroleum Geologists (April 9–11, 2001). U.S. Environmental Protection Agency, 2009, San Fernando Valley superfund sites update, and EPA selects second interim remedy for the North Hollywood operable unit, 12 p. Available at http://yosemite.epa.gov/r9/sfund/r9sfdocw.nsf/vwsoalphabetic/. |
First posted March 21, 2012 For additional information contact: Technical reports and hydrologic data collected for the GAMA Program may be obtained from GAMA Project Chief GAMA Program Unit Part or all of this report is presented in Portable Document Format (PDF); the latest version of Adobe Reader or similar software is required to view it. Download the latest version of Adobe Reader, free of charge. |
Kulongoski, J.T., and Belitz, Kenneth, 2012, Groundwater quality in the San Fernando–San Gabriel groundwater basins, California: U.S. Geological Survey Fact Sheet 2011-3139, 4 p.

![]() U.S. Department of the Interior |
U.S. Geological Survey
U.S. Department of the Interior |
U.S. Geological Survey
URL: http://pubsdata.usgs.gov/pubs/fs/2011/3139/index.html
Page Contact Information: GS Pubs Web Contact
Page Last Modified: Tuesday, 29-Nov-2016 17:46:16 EST
