Fact Sheet 2012–3146
This fact sheet was created to help biologists and resource managers understand emerging methods for detecting environmental DNA and their potential application for inventorying and monitoring aquatic species. It is a synthesis of published information. 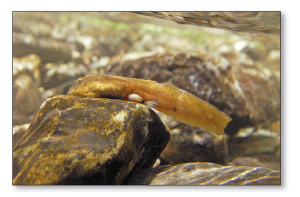
Figure 1. This tadpole of the Rocky Mountain tailed frog secretes enough DNA into the surrounding water that it can be detected in a water sample collected downstream (see Goldberg and others, 2011). Photograph taken by Jason Jones, Nevada Department of Wildlife. What is Environmental DNA?DNA, short for deoxyribonucleic acid, is the hereditary material in organisms that contains the biological instructions for building and maintaining them. The chemical structure of DNA is the same for all organisms, but differences exist in the order of the DNA building blocks, known as base pairs. Unique sequences of base pairs, particularly repeating patterns, provide a means to identify species, populations, and even individuals. Environmental DNA (eDNA) is nuclear or mitochondrial DNA that is released from an organism into the environment. Sources of eDNA include secreted feces, mucous, and gametes; shed skin and hair; and carcasses. eDNA can be detected in cellular or extracellular (dissolved DNA) form. In aquatic environments, eDNA is diluted and distributed by currents and other hydrological processes (fig. 1), but it only lasts about 7–21 days, depending on environmental conditions (Dejean and others, 2011). Exposure to UVB radiation, acidity, heat, and endo- and exonucleases can degrade eDNA. Use of eDNA for Inventory and MonitoringImproved Detection of Native SpeciesProtocols using eDNA may allow for rapid, cost-effective, and standardized collection of data about species distribution and relative abundance. For small, rare, secretive, and other species that are difficult to detect, eDNA provides an attractive alternative for aquatic inventory and monitoring programs. Increasing evidence demonstrates improved species detection and catch-per-unit effort compared with electrofishing, snorkeling, and other current field methods. Thus, detection of species using eDNA may improve biodiversity assessments and provide information about status, distribution, and habitat requirements for lesser-known species. Early Detection of Invasive SpecieseDNA may also be an effective tool for early detection of aquatic invasive species. Recent studies have focused on Asian carp (Jerde and others, 2011) and American bullfrogs (Dejean and others, 2012), but protocols are being developed for New Zealand mudsnails, zebra mussels, quagga mussels, and others. Application of eDNA methods for invasive species monitoring may include periodically collecting water samples and screening them for several invasive species at once. Boat-ballast water, a source of introduction for many invasive species including mollusks, also could be sampled. Some intensive eradication programs for invasive species fail when a few surviving individuals recolonize the ecosystem. eDNA methods may provide a means of confirming eradication of all invaders. Developing eDNA Protocols for Species MonitoringPrimer and Probe DesignConventional Polymerase Chain Reaction (PCR) methods can be used for analyzing eDNA, but they may cross-amplify and provide false-positive results. Quantitative PCR (qPCR) methods are preferable to conventional PCR because they are likely more sensitive. In qPCR, primers are used to amplify a region of DNA that is specific to a target organism, and a probe is used to provide additional specificity and quantitative information. Several eDNA primer and probe sequences for individual species have been published. Other primer/probe sets must be designed for new species or specific needs. Laboratory OptimizationThe primer and probe design must be tested to ensure that the qPCR reaction always results in a positive detection in the presence of target-organism DNA and that amplification of non-target DNA does not occur. DNA from the target species should be screened prior to analyzing environmental samples to ensure test sensitivity. Preferably, this will involve 10 or more samples collected across the range of the species where the test will be applied. Closely related, co-occurring species also should be screened to ensure specificity prior to analyzing environmental samples, preferably involving five or more samples of each. DNA can be extracted from preserved tissue samples using readily available kits. It is critical that no cross contamination occurs between species during the tissue-storage or extraction processes. How to Design Species-Specific Primers and Probe for qPCR
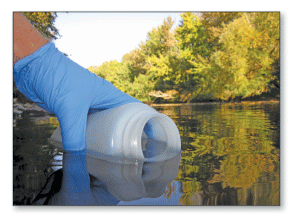
Figure 2. A water sample can be collected easily in the field in a sterile bottle and, if needed, stored temporarily in a cooler or refrigerator before eDNA is concentrated through filtration or centrifugation. Photograph taken by Matthew Laramie, U.S. Geological Survey. Field SamplingFour methods for field sampling have been developed to date: (1) collect 15 mL of water, preserve using ethanol and sodium acetate, and freeze immediately (Ficetola and others, 2008; Thomsen and others, 2012), (2) filter water through a cellulose nitrate filter (Goldberg and others, 2011), (3) filter water through a glass fiber filter (Jerde and others, 2011), and (4) filter water through carbonate filter (Takahara and others, 2012) (table 1; figs. 2–4). The latter three methods require pumps (either in-line, such as a peristaltic pump, or vacuum-line) and measurement of water filtered (volumes of 1–10 L are common). Filter methods also require either freezing of the filter paper (Jerde and others, 2011; Takahara and others, 2012) or dehydration of the filter paper in vials with molecular-grade ethanol (Goldberg and others, 2011). Although all these methods have been successful, ongoing testing, standardization, and optimization of field and laboratory protocols will continue to improve applications for inventory and monitoring programs. DNA Extraction and AmplificationDNA extracted from the preserved samples is stable once it has been purified and preserved, and only a portion is used in each PCR reaction. This preserved DNA can be later tested for additional species if desired. Following DNA extraction, qPCR analysis provides detection information about the target species’ DNA. Although the amount of target DNA present in field samples may be quantified (Thomsen and others, 2012; Takahara and others, 2012), this fact sheet is limited to presence/absence information. Sources of ErrorIdentifying sources of error or uncertainty is a critical process in any study, especially for monitoring programs where results could influence future management decisions. Darling and Mahon (2011) provide an excellent overview of potential sources of uncertainty associated with DNA-based methods for monitoring aquatic species. The following points are important when using eDNA methods. Design of Molecular AssayAssay design must account for the variation within a species and the variation among species. Failure to incorporate the full range of genetic variation of a target species can lead to false negatives, whereas failure to incorporate the full range of genetic variation in closely related, co-occurring species can lead to false positives. Therefore, it is important to select a genetic region that maximizes the amount of genetic information available for target and related non-target species. For some species, this may require sequencing additional samples to ensure the assay is both sensitive and specific. Table 1. Methods used to detect eDNA from aquatic organisms in freshwater environments. [Abbreviations: L, liter; ha, hectare; mL, milliliter; M, Molar; °C, degrees Celsius; μm, micrometer; cm, centimeter; m3, cubic meter; km3, cubic kilometer]
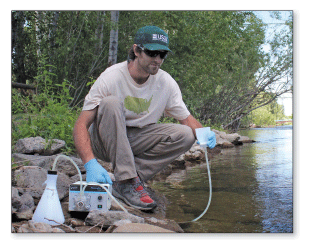
Figure 3. An example of streamside water filtration using a peristaltic pump and sterile filter funnel. Photograph taken by Matthew Laramie, U.S. Geological Survey. 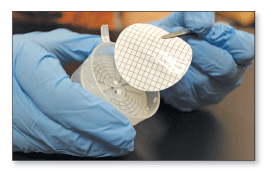
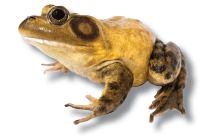
Figure 4. Filtration allows a specified quantity of water to be “tested” for eDNA. During filtration, DNA in the water is trapped on the filter paper, which is frozen or dehydrated. Photograph taken by Matthew Laramie, U.S. Geological Survey. Quality ControlPositive and negative controls are necessary to ensure quality and reliability of results at each stage of the study. All DNA extractions should include a negative control, so that cross contamination between extracts can be detected. Each well of the PCR plate should include an internal positive control to ensure that the reaction is not inhibited. All eDNA extractions and qPCR setups should be conducted in a PCR-free laboratory space where concentrated (such as from tissue) DNA samples have not been handled. Thermocyclers and real-time PCR machines should be located outside of this space. Detection ProbabilityLike other field-based sampling, results of eDNA detection may have some inaccuracy, and replicate samples are required to estimate occupancy while accounting for uncertainty. In other words, not detecting DNA of a species does not mean it is absent. The lower limits of detection for species are currently unknown and likely vary depending on the species and its density, size, behavior, and habitat. Field Negative ControlsTwo types of negative controls are often employed in the field to increase accuracy. First, samples from a few sites outside the range of a target species are used to confirm non-detection in locations where the species is not present. Second, samples are collected from distilled water using the field protocol at each site to ensure that cross contamination is not occurring between replicate samples within a site and between sites. Sterile gloves, filters, water collection bottles, and sample containers reduce risk of contamination. High-quality sample tubes placed individually inside plastic, sealable bags can reduce cross-contamination should leakage occur when samples are stored or shipped to laboratories. Timing of SamplingThe timing of sampling may need to coincide with the life history or behavior of a target species. For example, during reproduction when young-of-year are present, eDNA may be abundant. The arrival of migratory species can be detected assuming no other life stages of the species remain in the system. PCR ReplicationDegraded, low-quantity DNA samples are often analyzed in triplicate to ensure detection of DNA (Waits and Paetkau, 2005) and to assess potential false-positives. Using this approach, additional analysis is required if results are not uniform. Standard curves should be developed based on DNA obtained from tissue samples of target species and span the range of sample results. Future DirectionsAlthough eDNA methods show great potential for inventory and monitoring aquatic species, there are still details to resolve. Thomsen and others (2012) point out that it is necessary to gain a better understanding of how field methods, laboratory protocols, and environmental conditions influence the detection of eDNA. Further, there is little information about factors that influence lower limits of detection, production of DNA, and persistence of DNA in different types of aquatic systems. These factors will likely vary among species and life stages. Before adoption of standard procedures for eDNA sampling and analysis, further development and comparative testing of protocols are necessary. References CitedDarling, J.A., and Mahon, A.R., 2011, From molecules to management—Adopting DNA-based methods for monitoring biological invasions in aquatic environments. Environmental Research, v. 111, iss. 7, p. 978–988, doi:10.1016/j.envres.2011.02.001. Dejean, T., Valentini, A., Duparc, A., Pellier-Cuit, S., Pompanon, F., Taberlet, P., and Miaud, C., 2011, Persistence of environmental DNA in freshwater ecosystems: PLoS ONE, v. 6, no. 8, e23398, doi:10.1371/journal. pone,0023398. Dejean, T., Valentini, A., Miquel, C., Taberlet, P., Bellemain, E., and Miaud, C., 2012, Improved detection of an alien invasive species through environmental DNA barcoding—The example of the American bullfrog Lithobates catesbeianus: Journal of Applied Ecology, v. 49, iss. 4, p. 953–959, doi: 10.1111/j.1365-2664.2012.02171.x. Ficetola, G.F., Miaud, Claude, Pompanon, François, and Taberlet, Pierre, 2008, Species detection using environmental DNA from water samples: Biology Letters, v. 4, p. 423–425, doi:10.1098/rsbl.2008.0118. Goldberg, C.S., Pilliod, D.S., Arkle, R.S., and Waits, L.P., 2011, Molecular detection of vertebrates in stream water—A demonstration using Rocky Mountain tailed frogs and Idaho giant salamanders: PLoS ONE v. 6, no. 7, e22746, doi:10.1371/journal.pone.0022746. Jerde, C.L., Mahon, A.R., Chadderton, W.L., and Lodge, D.M., 2011, “Sight-unseen” detection of rare aquatic species using environmental DNA: Conservation Letters, v. 4, iss. 2, p. 150–157, doi:10.1111/j.1755-263X.2010.00158.x. National Center for Biotechnology Information, 2012, NCBI: U.S. National Laboratory of Medicine, National Center for Biotechnology Information database, accessed October 4, 2012, at http://www.ncbi.nlm.nih.gov/genbank/. Takahara, T., Minamoto, T., Yamanaka, H., Doi, H., and Kawabata, Z., 2012, Estimation of fish biomass using environmental DNA: PLoS One, v. 7, iss. 4, e35868, doi:10.1371/journal.pone.0035868. Thomsen, P.F., Kielgast, J., Iversen, L.L., Wiuf, C., Rasmussen, M., Gilbert, M.T.P., Orlando, L., and Willerslev, E., 2012, Monitoring endangered freshwater biodiversity using environmental DNA: Molecular Ecology, v. 21, iss. 11, p. 2565–2573, doi:10.1111/j.1365-294X.2011.05418.x. Waits, L.P., and Paetkau, D., 2005, Noninvasive genetic sampling tools for wildlife biologists—Review of applications and recommendations for accurate data collection: Journal of Wildlife Management, v. 69, iss. 4, p. 1419–1433, doi:10.2193/0022-541X(2005)69[1419:NGSTFW]2.0.CO;2. Top bullfrog photograph: Environmental DNA has been used to detect non-native species, like this American bullfrog, in lakes and ponds in Europe (Dejean and others, 2012). Photograph taken by John Cossel, Department of Biology, Northwest Nazarene University. |
First posted November 18, 2012 For additional information contact: Part or all of this report is presented in Portable Document Format (PDF); the latest version of Adobe Reader or similar software is required to view it. Download the latest version of Adobe Reader, free of charge. |
Pilliod, D.S., Goldberg, C.S., Laramie, M.B., and Waits, L.P., 2013, Application of environmental DNA for inventory and monitoring of aquatic species: U.S. Geological Survey Fact Sheet 2012-3146, 4 p.

![]() U.S. Department of the Interior |
U.S. Geological Survey
U.S. Department of the Interior |
U.S. Geological Survey
URL: http://pubsdata.usgs.gov/pubs/fs/2012/3146/index.html
Page Contact Information: GS Pubs Web Contact
Page Last Modified: Tuesday, 29-Nov-2016 18:33:38 EST
