 Summary Summary
The U.S. Geological Survey (USGS) South Atlantic Water Science Center (SAWSC) Georgia office, in cooperation with local, State, and other Federal agencies, maintains a long-term hydrologic monitoring network of more than 340 real-time continuous-record streamflow-gaging stations (streamgages), including 10 real-time lake-level monitoring stations, 67 real-time surface-water-quality monitors, and several water-quality sampling programs. Additionally, the SAWSC Georgia office operates more than 180 groundwater monitoring wells, 39 of which are real-time. The wide-ranging coverage of streamflow, reservoir, and groundwater monitoring sites allows for a comprehensive view of hydrologic conditions across the State. One of the many benefits of this monitoring network is that the analyses of the data provide a spatially distributed overview of the hydrologic conditions of creeks, rivers, reservoirs, and aquifers in Georgia.
Streamflow and groundwater data are verified throughout the year by USGS hydrographers. Hydrologic conditions are determined by comparing the results of statistical analyses of the data collected during the current water year (WY) to historical data collected over the period of record. Changing hydrologic conditions emphasize the need for accurate, timely data to help Federal, State, and local officials make informed decisions regarding the management and conservation of Georgia’s water resources for agricultural, recreational, ecological, and water-supply needs and for use in protecting life and property.
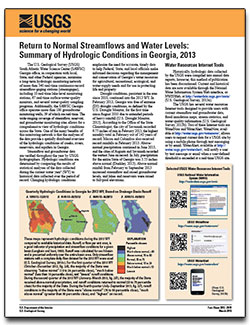
Drought conditions, persistent in the area since 2010, continued into the 2013 WY. In February 2013, Georgia was free of extreme (D3) drought conditions, as defined by the U.S. Drought Monitor, for the first time since August 2010 due to extended periods of heavy rainfall (U.S. Drought Monitor, 2013). According to the Office of the State Climatologist, the city of Savannah recorded 9.75 inches of rain in February 2013, the highest monthly total in February out of 143 years of record. Macon and Columbus also received record rainfalls in February 2013. Above-normal precipitation continued in June 2013, and the cities of Augusta and Savannah recorded the wettest June on record. In July, precipitation for the entire State of Georgia was 3.53 inches above normal (Dunkley, 2013). Above-normal rainfall from February to September 2013 increased streamflow and raised groundwater levels, and lakes and reservoirs were raised to full-pool elevations.
|
First posted March 27, 2015
Part or all of this report is presented in Portable Document Format (PDF). For best results viewing and printing PDF documents, it is recommended that you download the documents to your computer and open them with Adobe Reader. PDF documents opened from your browser may not display or print as intended. Download the latest version of Adobe Reader, free of charge. More information about viewing, downloading, and printing report files can be found here.
|

