|
|
Effects of August 1995 and July 1997 Storms in the City of Charlotte and Mecklenburg County, North Carolina |
Prepared in cooperation with the City of Charlotte and Mecklenburg County |
In this report --
|
DETERMINATION OF PEAK FLOWSStream stage (or water level) and streamflow (or discharge) are measured at locations called streamflow gaging stations. Stage is measured and recorded continuously by electronic instruments to an accuracy of 0.01 foot. Stage information from the City of Charlotte and Mecklenburg County network is transmitted daily by telephone line to USGS computers. Flow is more difficult to measure accurately and continuously than is stage. Discharge for a gaging station is typically determined from an established stage-discharge relation, or rating curve. Individual discharge measurements are made by USGS personnel at a gaging station by using standard procedures (Rantz and others, 1982); ideally, these measurements are made when the stage is not changing. A series of these measurements made over a range of flow conditions defines the rating curve, which is used to convert continuous measurements of stage to a continuous record of discharge. Channel changes, resulting from scour, deposition, vegetation, or other processes, alter the stage-discharge relation, so that discharge measurements must be made routinely and continuously to ensure that the rating curve remains accurate. A rating curve is considered accurate only over the range for which discharge measurements have been made. Discharge measurements sometimes are not available for the full range of flows at gaging stations that have been in operation for only a few years. Even at gaging stations that have been in continuous operation for 30 years or more, direct discharge measurements for extremely high flows, such as those occurring during August 1995 and July 1997, are difficult to obtain because (1) these events are rare, (2) debris often accumulates in the channel, (3) extreme peak flows may persist for only a short period of time, and (4) measurement sites are often inaccessible due to road or bridge closures. Estimates of peak flows, which are outside the range of the established rating curve, may be made by an extrapolation of the rating curve to the peak stage. At some gaging stations, indirect methods of discharge determination based on high-water marks, channel properties, and hydraulic principles may be used to obtain an independent estimate of discharge. These indirect methods generally require accurate field surveys to determine high-water marks, channel properties, and channel shape. The information obtained in the field is then processed using computer programs to determine the discharge. Continued evaluation of these discharge computations may result in some revision of the peak flows presented in this fact sheet.
|
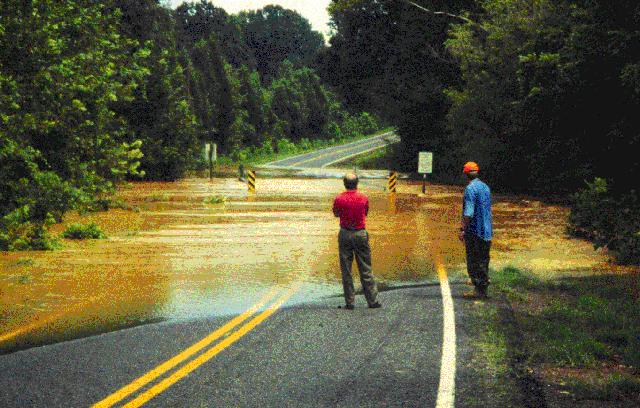 Rising flood waters overtopping a local bridge.
(Photograph by Jerald B. Robinson, USGS)
Rising flood waters overtopping a local bridge.
(Photograph by Jerald B. Robinson, USGS)
|