This document is also available in pdf format:
![]() fs-039-99.pdf
fs-039-99.pdf
The U.S. Geological Survey (USGS) has been working in Pennsylvania since 1884, mapping and studying land, water, geological, and biological resources. Current activities reflect the four USGS theme areas: Hazards, Resources, Environment, and Information Management.
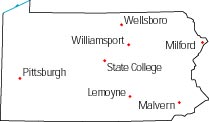
The Pymatuning earthquake struck at 3:52 p.m. on Friday, Sept. 25, 1998, near Jamestown (fig. 1). The epicenter of the magnitude 5.2 event was at the southern end of the Pymatuning Reservoir, which straddles the Ohio-Pennsylvania border. The earthquake caused minor damage to buildings, and it was felt throughout most of Pennsylvania. Within 24 hours of the main shock, field teams from the University of Memphis, Columbia University, and the USGS deployed portable digital seismographs to record aftershocks. During the 1-week field program, a field Website provided investigation results in near-real time and received reports of earthquake effects from the local community. By November 13, seven aftershocks were recorded; the largest had a magnitude of 2.3. Hydrologic changes that possibly were related to the Pymatuning earthquake were reported by numerous residents of the Jamestown area. The most serious change was the reported loss of water in about 100 household-supply wells not far from the epicenter. Other residents reported newly flowing artesian wells, formation of new springs, and changes in well-water quality (“black color and sulfur odor”). A USGS ground-water observation well in Greenville recorded an abrupt 3-foot rise in the water level shortly after the earthquake (fig. 2). The USGS, in cooperation with the Pennsylvania Topographic and Geologic Survey (PAGS) and Thiel College, is continuing to investigate the Pymatuning earthquake and its effects on area hydrology.
 |
 |
|
|
Figure 1. Location of the 1998 Pymatuning earthquake epicenter, aftershocks, and USGS observation well. |
Figure 2. Water level in a USGS observation well in Greenville before and after the Pymatuning earthquake |
The USGS provides up-to-date science information regarding natural resources in Pennsylvania. Current investigations range from studies of land use, human development, and elk life history in support of elk herd management by the Pennsylvania Game Commission, to assessment of untapped energy resources of the Pittsburgh Coalbed. Recent studies of water-quality effects associated with coal mining illustrate the application of multidisciplinary methods to address resource management issues that affect many Pennsylvanians.
Mitigating the Effects of Coal Mining on Water Quality
 |
|
Figure 3. USGS scientist evaluating water quality in an AMD-affected stream. |
Pennsylvania coal continues to be a valuable energy resource for the Nation. Drainage from thousands of abandoned coal mines, however, has contaminated more than 3,000 miles of streams and associated ground waters and is the most extensive pollution problem affecting Pennsylvania’s water resources. Coal mine drainage can contain toxic concentrations of acids, metals, and sediment. Consequently, Pennsylvania loses approximately $67 million in annual revenue because fishing cannot be supported in numerous streams degraded by abandoned and acidic mine drainage (AMD). Current USGS efforts include multidisciplinary studies to identify and understand AMD problems, and to assist in restoring streams affected by mine drainage (fig. 3).
Restoration of Swatara Creek
Limestone AMD-treatment systems were installed by the Schuylkill County Conservation District and the Swatara Creek Watershed Association, with technical assistance from the USGS and the Pennsylvania Department of Environmental Protection (PaDEP). Streamflow and water-quality monitoring and annual ecological surveys by USGS scientists indicate substantial improvements in water quality. In 1996, the monitored stream reach was acidic, and it did not contain fish, caddisflies, or mayflies. In 1998, the reach was not acidic, and it contained a native brook trout, larvae of two species of acid-intolerant caddisflies, and several species of acid-tolerant insects and crayfish.
Limestone Treatment Technology— A Cooperative Effort
USGS scientists developed an improved limestone and carbon dioxide treatment method to assist in stream restoration. The USGS is working with the National Park Service (NPS), the Freshwater Institute, and PaDEP to field test the technology at the PaDEP Toby Creek mine drainage treatment plant in Elk County. An additional field test is under way at the NPS Friendship Hill Historic Site in Fayette County, where the effects of treatment on stream biology are being evaluated.
Remote Sensing of Mine Drainage using Spectral Reflectance
 |
|
Figure 4. Example of remotely sensed yellow reflectance of acidic discharges to a stream. |
The USGS is working with the U.S. Environmental Protection Agency (EPA) and the Virginia Institute of Marine Science to develop methods to identify AMD-affected stream segments. AMD from coal mines typically produces iron-rich precipitates on streambeds. Handheld spectrometer measurements indicate that the characteristic yellow precipitates in acidic water have greater reflectance than the characteristic red precipitates in neutral water (fig. 4). Spectral data from ground- and aerially- mounted imagers and corresponding water-quality and streambed samples will be collected in the Southern Anthracite Coalfield in east-central Pennsylvania. The data will be used to demonstrate the aerial spectral reflectance technology and to develop methods that will enable interpretation of streamwater pH and associated geochemistry.
Substantial efforts are being made in Pennsylvania to improve ecosystem health through pollution reduction and land-use management. The USGS provides high-quality data, investigations, and research needed to measure ecosystem improvement and to evaluate the effectiveness of alternative prevention, protection, and restoration methods and policies.
Stream Ecosystems Rebound
A biological monitoring program was established in 1969 to evaluate stream quality in Chester County. Data collection has continued uninterrupted as a cooperative effort of the USGS, the Chester County Water Resources Authority, and the Chester County Board of Commissioners. Each fall, organisms that live on the bottom substrates of freshwater habitats for at least part of their life cycles are sampled by USGS scientists, along with stream water and sediments.
 |
|
Figure 5. Improved biological diversity in Brandywine Creek, Chester County. |
Diversity of the biota improved at 37 of 40 monitoring sites (for example, fig. 5). The diversity index is a measure of ecosystem health on the basis of the number and relative proportions of different organisms. Improving ecosystem health is partly the result of the discontinued use of certain organochlorine insecticides, such as DDT. These improvements also may reflect agricultural “best management practices” and removal of agricultural lands from production, which result in smaller pesticide and sediment loads entering streams, and control of point-source discharges, primarily through upgrades in sewage treatment plants.
Fish Health in Agricultural and Industrial Areas
 |
|
Figure 6. Fish trapped for use in analyses of bioaccumulation of metals, pesticides, and other contaminants. |
USGS scientists study the effects of contaminants on fish (fig. 6). The investigations range from the identification and control of contaminant sources, to the environmental fate and transport of contaminants, to the pathology of acute and long-term exposure of fish. As part of the USGS National Water-Quality Assessment (NAWQA) program, fish communities and stream habitat were related to bedrock type. Factors in limestone (carbonate bedrock) streams, such as springs that discharge cool, stable-pH water throughout the year, provide favorable conditions for sensitive fish such as trout. However, valuable limestone farmland commonly is cultivated to the edge of the stream-bank, leaving little or no riparian vegetation, which leads to increased temperature and sedimentation. Although freestone (noncarbonate bedrock) streams generally do not have a supply of cool spring water, riparian vegetation along the stream-banks is favorable for fish habitat. Fish populations were healthier in the three freestone streams than in the four limestone streams surveyed. Poor fish health in limestone streams appears to be caused more by the lack of riparian vegetation than by excess nutrients.
Excess Nutrients Reduced by Sedimentation in Reservoirs…For Now
The USGS is one of many Federal, State, and local agencies actively involved in studies aimed at reducing excess nutrients and sediments delivered to Chesapeake Bay. The Susquehanna River, which drains an area of 27,510 square miles, contributes nearly 50 percent of the freshwater inflow to the bay in a year of normal streamflow. It also transports the greatest amount of nutrients from all nontidal streams in the bay—an estimated 66 percent of the nitrogen load and 40 percent of the phosphorus load. In 1987, the Commonwealth of Pennsylvania signed the Chesapeake Bay Agreement, which calls for a 40-percent reduction in controllable nutrients delivered to the bay by the year 2000.
 |
|
Figure 7. Deposition of sediment behind dams in the Susquehanna River basin is projected to continue to reduce nutrient loads to Chesapeake Bay for only 15-20 more years. |
Assessing the Extent of PCB Contamination in the Environment and Wildlife
Polychlorinated biphenyls (PCB’s) are toxic chemicals that accumulate in food chains and pose significant risks to the health of wildlife and humans. In partnership with the Pennsylvania Game Commission, U.S. Fish and Wildlife Service, and NPS, the USGS is developing methods of testing for the effects of PCB contamination in terrestrial ecosystems. Biomarkers are being developed and field tested to trace the movement of PCB’s from the environment into wildlife.
The USGS has a major responsibility to provide earth-science information to the public and to government agencies. Rapid changes in information technology are reflected in improved systems to locate, transmit, and use high-quality data ranging from photographic, geologic, and topographic maps, to near-real-time streamflow on the Web, to stream-channel-stability data for more than 16,000 bridges over water in Pennsylvania. The USGS and the Commonwealth of Pennsylvania have had a long and successful history of cooperatively funding geospatial data production. As a result of recent cooperative efforts, the statewide coverage of black-and-white digital orthophoto quadrangles soon will be completed; a complete update of statewide, black-and-white aerial photographic coverage, under the National Aerial Photographic Program, is scheduled to be completed in year 2000; and efforts will continue to revise the State’s popular 7.5-minute USGS topographic maps and the digital raster graphics. These technological developments are coordinated with local information transfer efforts, such as the Earth Science Information Center in Harrisburg, which is operated in cooperation with PAGS.
The USGS implemented the Urban Dynamics Program to study the effects of urbanization on the environment. One study area is the Philadelphia-Wilmington-Trenton metropolitan corridor. USGS scientists converted the rich collection of topographic maps of the area, dating from 1940 to 1990, to digital form, creating a database of land-use change and other physiographic information. Digital visualizations display urban growth over time (fig. 8) in geographical context. These and other results are intended to help scientists and planners understand the effects of historical and future urban growth on regions surrounding major metropolitan areas.
 |
|
Figure 7. A USGS land-use-change database can be visualized as a sequence of maps. These two maps show the spread of urbanized ares (red) in the Philadelphia region from 1940 to 1990. |
|
The USGS office locations
|
USGS State Representative USGS Home Page: Reports and products: |