 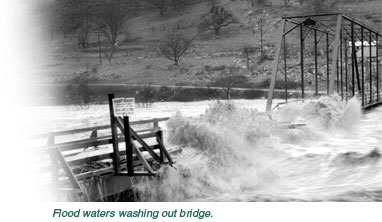
U.S. GEOLOGICAL SURVEY The "1OO-Year Flood" by Karen Dinicola This document also is available in pdf format: Flood designations are based on statistical averages, not on the number of years between big floods. The estimates are only as good as the available data. Flood designations are updated as more data are collected or when the conditions change in a river basin. Big Floods Could Happen Again in Washington During Any Year Rivers across the Nation seem to be rising to record flood levels almost every year. In Washington, more than one 100-year flood has happened on a few rivers in just the past several years. How can 100-year floods happen so often? Why Don't These Floods Happen Every 100 Years? The term "100-year flood" is misleading because it leads people to believe that it happens only once every 100 years. The truth is that an uncommonly big flood can happen any year. The term "100-year flood" is really a statistical designation, and there is a 1-in-100 chance that a flood this size will happen during any year. Perhaps a better term would be the "1-in-100 chance flood." The actual number of years between floods of any given size varies a lot. Big floods happen irregularly because the climate naturally varies over many years. We sometimes get big floods in successive or nearly successive years with several very wet years in a row. How Are Floods Designated? Scientists collect data and study past floods to get a minimum of 10 years of information about the river; a longer record provides a better estimate of the "1-in-100 chance flood." Scientists use statistics and observe how frequently different sizes of floods occurred, and the average number of years between them, to determine the probability that a flood of any given size will be equaled or exceeded during any year. Many Flood Designations Will Change Over Time As more data are collected, or when a river basin is altered in a way that affects the flow of water in the river, scientists re-evaluate the frequency of flooding. Dams and urban development are examples of some man-made changes in a basin that affect floods. The USGS Collects Essential Data For Understanding Floods Scientists at the USGS measure streamflow in rivers across the State during every major flood. After flood waters recede, the USGS may be funded to locate and survey "high-water marks" where debris and mud lines indicate the highest extent of flood waters. These post-flood surveys are used to estimate maximum flows at sites that could not be reached during the floods and also to map the areas covered by the floods.
Do You Live On The Floodplain? The areas affected by past floods have been mapped by the Federal Emergency Management Agency and many other government agencies. Because of continuing changes in river channels and land use in many basins, the maps may not reflect current information for your area. Inquire at your City or County Building or Planning Department. If you live on the designated floodplain, the chances are about 1 in 2 that you will experience a flood during your lifetime. Prepare for a flood as you would for any natural disaster, and make evacuation plans for your family. Floods Will Continue To Happen Although we can lessen effects of some floods, they are part of the natural cycle of every river and benefit instream habitats by moving material downstream and renewing streambeds. As floods get bigger and spread farther, flood waters slow and deposit sediment on the floodplain. This natural process created valuable farmlands in river valleys of the Pacific Northwest over thousands of years.
For more information, contact: The U.S. Geological Survey has served the public and Federal, State, and local governments since 1879 by collecting, analyzing, and publishing detailed information about the Nation's mineral, land, and water resources. The USGS has been studying the water resources of Washington State since the turn of the century. This information is in a variety of map, book, electronic, and other formats and is available by contacting:
USGS Washington Water Science Center
|