 |
|
|
||||
| Fact Sheet 0028–01: Online Report |
| About USGS / Science Topics / Maps, Products & Publications / Education / FAQ |
The Alaska National Interest Lands Conservation Act (1980) established the Arctic National Wildlife Refuge (ANWR) (fig. 1). In section 1002 of that act, Congress deferred a decision regarding future management of the 1.5-million-acre coastal plain ("1002 area") in recognition of the area’s potentially enormous oil and gas resources and its importance as wildlife habitat. A report on the resources (including petroleum) of the 1002 area was submitted in 1987 to Congress by the Department of the Interior (DOI). Since completion of that report, numerous wells have been drilled and oil fields discovered near ANWR (fig. 2), new geologic and geophysical data have become available, seismic processing and interpretation capabilities have improved, and the economics of North Slope oil development have changed significantly.
The U.S. Geological Survey (USGS) commonly is asked to provide the Federal Government with timely scientific information in support of decisions regarding land management, environmental quality, and economic and strategic policy. To do so, the USGS must anticipate issues most likely to be the focus of policymakers in the future. Anticipating the need for scientific information and considering the decade-old perspective of the petroleum resource estimates included in the 1987 Report to Congress, the USGS has reexamined the geology of the ANWR 1002 area and has prepared a new petroleum resource assessment.
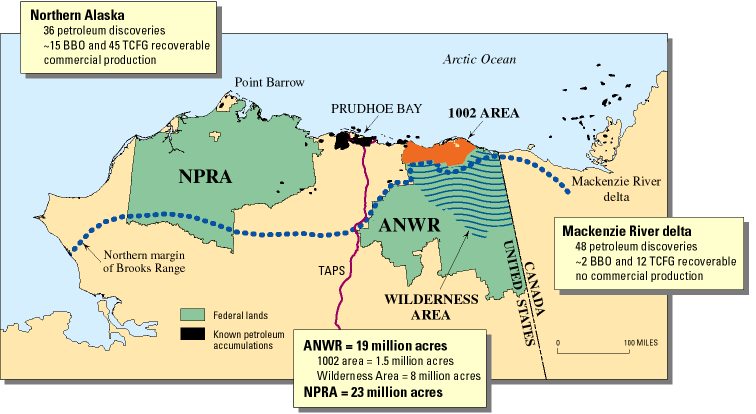
Figure 1. Map of northern Alaska and nearby parts of Canada showing locations of the Arctic National Wildlife Refuge (ANWR), the 1002 area, and the National Petroleum Reserve—Alaska (NPRA). Locations of known petroleum accumulations and the Trans-Alaska Pipeline System (TAPS) are shown, as well as summaries of known petroleum volumes in northern Alaska and the Mackenzie River delta of Canada. BBO, billion barrels of oil (includes cumulative production plus recoverable resources); TCFG, trillion cubic feet of gas recoverable resources.
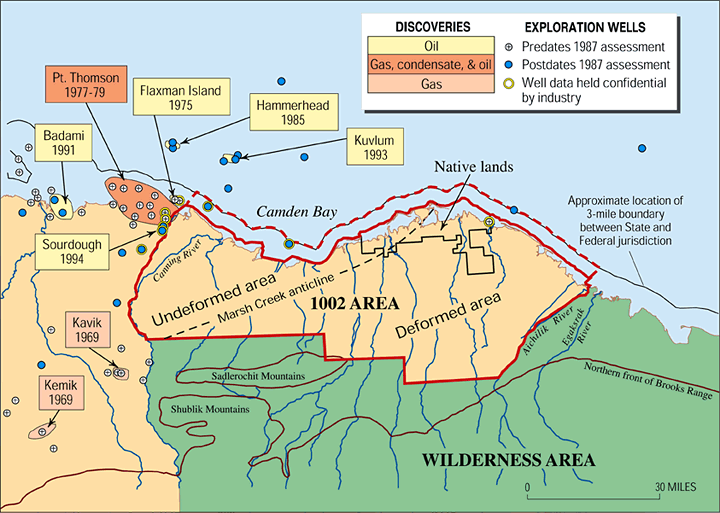
Figure 2. Map of the ANWR 1002 area. Dashed line labeled Marsh Creek anticline marks approximate boundary between undeformed area (where rocks are generally horizontal) and deformed area (where rocks are folded and faulted). Boundary is defined by Marsh Creek anticline along western half of dashed line and by other geologic elements along eastern half of dashed line. Exploration wells are coded to show whether information from them was available for the 1987 USGS assessment of in-place petroleum resources. Dashed red line shows the offshore extent of the entire assessment area.
The new assessment involved 3 years of study by 40 USGS scientists, who coordinated work with colleagues in other Federal agencies, Alaska State agencies, and several universities. New field studies were conducted, new well and sample data were analyzed, and new geophysical data were acquired. Perhaps most importantly, all 1,400 miles of seismic data that had been collected by a petroleum-industry consortium in 1984 and 1985 were reprocessed and reinterpreted. Collection of seismic data within ANWR requires an act of Congress, and these are the only seismic data ever collected within the 1002 area. All this information was integrated as basic input into the petroleum assessment. The term "petroleum" is used herein to include crude oil, natural gas, and natural gas liquids. Although all petroleum commodities were assessed, results reported in this Fact Sheet are for crude oil only because it determines the economic viability of resources on the North Slope. Results for the other commodities are reported in a CD-ROM (USGS Open-File Report 98-34).
The methodology used in this assessment is slightly modified from that used in the 1987 assessment of this area when the USGS estimated in-place petroleum resources for the DOI Report to Congress; the methodology is also slightly modified from that used in the USGS assessment of the National Petroleum Reserve—Alaska (NPRA) (1979–1980). Ten petroleum plays were defined as the initial step of the assessment (fig. 3). A play is a volume of rock that contains similar geological parameters (such as petroleum charge, reservoir, and trap) that determine petroleum potential. In keeping with the USGS responsibility for assessing the petroleum potential of all onshore and State water areas of the United States, the total play area considered was extended to the 3-mile boundary between State and Federal jurisdiction. Thus, in addition to the Federal lands of the ANWR 1002 area, this assessment includes resources associated with State waters and Native lands (fig. 2).
For each play, distributions of the number and size of potential petroleum accumulations were estimated based on a probabilistic range of values for certain geological attributes, such as reservoir thickness and porosity. These distributions were restricted to potential accumulations larger than 50 million barrels of oil (MMBO) in-place so that the assessment would not be influenced by smaller accumulations that are non-economic in most cases on the North Slope.
The resulting distributions were subjected to a geologic risking procedure designed to weigh the likelihood that petroleum charge, reservoir, and trap conditions were sufficient to generate a 50-MMBO in-place accumulation. In turn, a probabilistic estimate of in-place petroleum resources was calculated based on the risked distributions of size and number of potential petroleum accumulations in each play. A recovery factor appropriate to each play was applied to the estimates of in-place petroleum resources to calculate technically recoverable petroleum resources (fig. 4).
Estimates for each play were aggregated to calculate total technically recoverable petroleum resources for the entire assessment area, the 1002 area, and the undeformed and deformed parts of the 1002 area (table 1). Costs associated with discovering and recovering petroleum resources, including the costs of constructing pipelines to transport the petroleum, were then applied to estimate economically recoverable petroleum resources (fig. 4).
The assessment methodology yields results that include probabilistic expressions of uncertainty, as illustrated schematically in figure 4. To stress the importance of this uncertainty, results reported here include 95- and 5-percent probabilities, in addition to mean value. The 95- and 5-percent probabilities are considered reasonable minimum and maximum values, and the mean is the average or expected value.
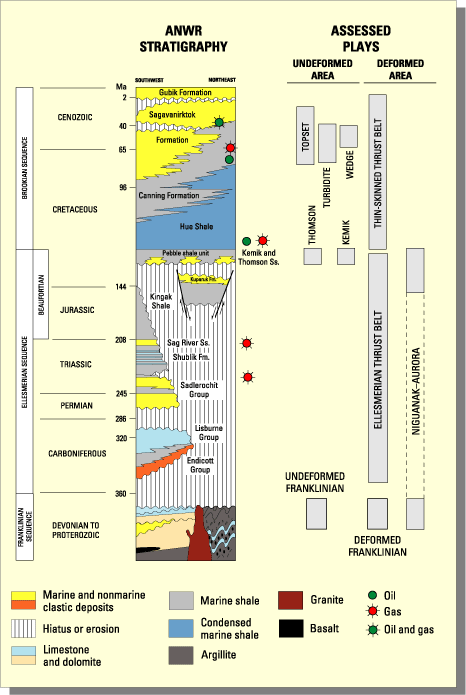
Figure 3. Summary of ages, names, and rock types present in the ANWR 1002 area. The occurrence of recoverable petroleum in these rock formations outside the ANWR 1002 area is indicated by green and red circles. Gray bars at right indicate the 10 petroleum plays assessed in this study and their corresponding rock formations (to the left). Note grouping of plays according to deformed and undeformed areas as shown in figure 2.
Sidenote 1: The 95-percent probability level refers to 19 in 20 chances; the 5-percent probability level refers to 1 chance in 20 that the amounts shown will be at least that large. Sidenote 2: Charge.—Occurrence of conditions of petroleum generation and migration adequate to cause an accumulation of the minimum size (50 million barrels of oil (MMBO) in-place). Reservoir.—Occurrence of reservoir rocks of sufficient quantity and quality to permit containment of petroleum in volumes sufficient for an accumulation of the minimum size (50 MMBO in-place). Trap.—Occurrence of those structures, pinch-outs, permeability changes, and similar features necessary for the entrapment and sealing of petroleum in an accumulation of the minimum size (50 MMBO in-place).The total quantity of technically recoverable oil within the entire assessment area is estimated to be between 5.7 and 16.0 billion barrels (95-percent and 5-percent probability range), with a mean value of 10.4 billion barrels. Technically recoverable oil within the ANWR 1002 area (excluding State and Native areas) is estimated to be between 4.3 and 11.8 billion barrels (95- and 5-percent probability range), with a mean value of 7.7 billion barrels (table 1).
Quantities of technically recoverable oil are not expected to be uniformly distributed throughout the ANWR 1002 area. The undeformed area (fig. 2) is estimated to contain between 3.4 and 10.2 billion barrels of oil (BBO) (95- and 5-percent probability), with a mean of 6.4 BBO. The deformed area (fig. 2) is estimated to contain between 0 and 3.2 BBO (95- and 5-percent probability), with a mean of 1.2 BBO.
Figure 5 shows the expected numbers of accumulations and volumes of technically recoverable oil grouped by accumulation-size class. It shows that most of the oil is estimated to occur in accumulations that exceed 100 million barrels, the size of recently developed north Alaskan stand-alone accumulations. Moreover, at the mean, nearly 80 percent of the oil is thought to occur in the western part of the ANWR 1002 area, which is closest to existing infrastructure. Volumes of oil are expected to occur as several accumulations rather than a single large accumulation.
Commercial viability of a discovery depends on oil price, accumulation size, recovery technology, and proximity to existing infrastructure (pipelines, etc.). The economic analysis presents the cost of transforming technically recoverable resources into producible proved reserves—it shows the market price that would have to be paid to find, develop, produce, and transport to market (lower 48 West Coast) any particular quantity of assessed oil assuming current technology and existing scientific understanding. Figure 6, which is based on the field-size distributions associated with the mean, 95-, and 5-percent probability oil estimates, summarizes the findings of the economic analysis. The cost functions are calculated in constant 1996 dollars and are based on the expectation that production will repay all operating costs, including taxes and transport to market, all investment expenditures, and provide and an after-tax rate of return of at least 12 percent on the investment.
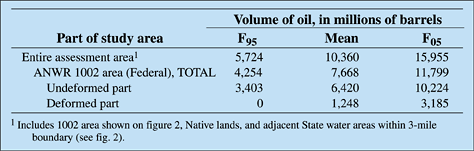
[ANWR, Arctic National Wildlife Refuge. All reported oil volumes in millions of barrels. Basic statistical principles determine that mean values can be added and subtracted but F95 and F05 values cannot (e.g., means for the undeformed and deformed parts of the ANWR 1002 area sum to the mean for the total ANWR 1002 area, but F95 and F05 values do not). F95 , 95-percent probability level; F05 , 5-percent probability level]
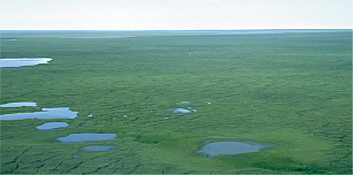
Typical view of the ANWR 1002 area coastal plain.
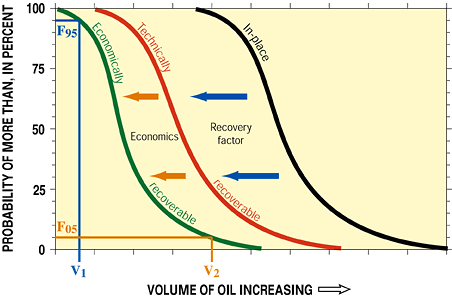
Figure 4. Schematic graph illustrating petroleum volumes and probabilities. Curves represent categories of oil in assessment. An example of how one reads this graph is illustrated by the blue and orange lines projected to the curve for economically recoverable oil. There is a 95-percent chance (i.e., probability, F95) of at least volume V1 of economically recoverable oil, and there is a 5-percent chance (F05) of at least volume V2 of economically recoverable oil.
Sidenote 3: In-place resources.—The amount of petroleum contained in accumulations of at least 50 MMBO without regard to recoverability. Technically recoverable resources.—Volume of petroleum representing that proportion of assessed in-place resources that may be recoverable using current recovery technology without regard to cost. Economically recoverable resources.—That part of the technically recoverable resource for which the costs of discovery, development, and production, including a return to capital, can be recovered at a given well-head price.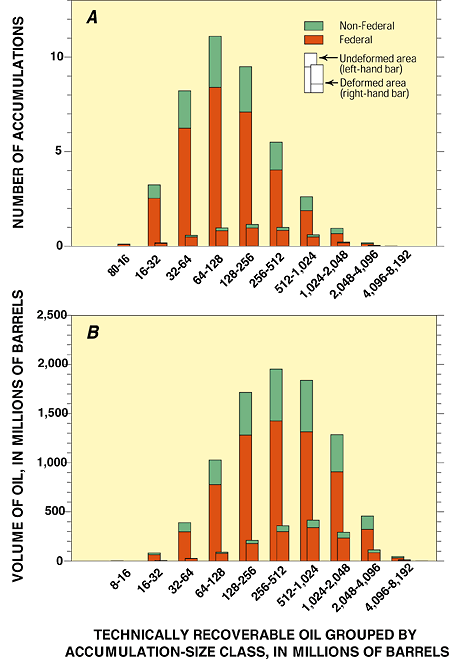
Figure 5. A, Histogram showing the expected (mean) number of petroleum accumulations estimated to exist in various size categories of technically recoverable oil resources in this assessment. For each size category, histogram bar on left is for undeformed area and bar on right is for deformed area. Each histogram bar is divided into Federal (1002 area) and non-Federal portions. The histogram is read as follows: It is estimated that the undeformed area contains approximately three accumulations containing between 512 and 1,024 million barrels of technically recoverable oil; two of those accumulations are under Federal jurisdiction and one is non-Federal. Adding the accumulations in the undeformed area to those of the deformed area for each size category gives the total number of those sized accumulations for the entire assessment area (1002 area plus non-1002).
Figure 5. B, Histogram showing the expected (mean) volume of oil estimated to exist in each accumulation-size category of technically recoverable oil resources. For each size category, histogram bar on left is for undeformed area and bar on right is for deformed area. Each histogram bar is divided into Federal and non-Federal portions. The histogram is read as follows: It is estimated that the undeformed area contains approximately 1,800 million barrels of technically recoverable oil in accumulations containing between 512 and 1,024 million barrels of technically recoverable oil; approximately 1,300 MMBO is Federal and approximately 500 MMBO is non-Federal. Adding the volume of oil in the undeformed area to that of the deformed area for each size category gives the total volume of those sized accumulations for the entire assessment area (1002 area plus non-1002).
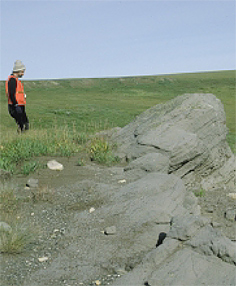
Photograph of oil-stained sandstone near crest of Marsh Creek anticline, 1002 area.
One cannot make a meaningful comparison with previous assessments without knowledge of differences in assessment methodology, assumptions, and data. That information is not always available for the previous assessments of the ANWR 1002 area. Among previous assessments of ANWR 1002 area petroleum resources, only the 1987 USGS assessment of in-place resources is directly comparable. The technically and economically recoverable petroleum resource estimates cannot be compared directly because different methods were used in preparing those parts of the 1987 Report to Congress. The current assessment shows an overall increase in estimated in-place oil resource when compared to the 1987 assessment. Ranges are 11.6 to 31.5 BBO versus 4.8 to 29.4 BBO, (95- and 5-percent probabilities) and mean values are 20.7 BBO versus 13.8 BBO (current assessment compared to 1987 assessment). The increase results in large part from improved resolution of reprocessed seismic data, which allowed the identification of many more potential petroleum accumulations in parts of the area, and analog information provided by recent nearby oil discoveries.
Another significant change is in the geographic distribution of resources. In the 1987 assessment, about 75 percent of the mean estimated in-place oil was in the southeastern or deformed area and only 25 percent was in the northwestern or undeformed area (fig. 2). In the current assessment, nearly 85 percent of the in-place oil is in the undeformed area and only about 15 percent is within the deformed area. Again, the reason is largely related to improved resolution of the seismic data, especially in the undeformed area where, in various plays, it allowed the identification of many more potential petroleum accumulations than were previously thought to exist. The southeastern area—with only a single well offshore and complex geology onshore—carries great uncertainty. Further, part of that area considered oil prospective in 1987 is now considered prospective only for gas because of new understanding of the thermal history of the rocks.
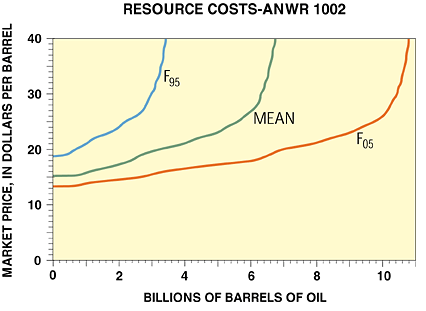
Figure 6. Summary of the USGS estimates of economically recoverable oil that may occur beneath the Federal part of the Arctic National Wildlife Refuge 1002 Area. The three curves are based on estimates of technically recoverable oil volumes at the mean (expected) value, and at the 95 percent (F95) and 5 percent (F05) probabilities. Each curve relates market price/cost to the volume of oil estimated to be profitably recoverable. Included are the costs of finding, developing, producing, and transporting oil to lower 48 West Coast market based on a 12 percent after-tax return on investment all calculated in constant 1996 dollars. The chart is read as follows: At a market price of $24 per barrel, there is a 95 percent probability of at least 2.0 BB of economically recoverable oil and a 5-percent probability of at least 9.4 BB. The mean or expected value is at least 5.2 BB of economically recoverable oil at $24 per barrel.
In anticipation of the need for scientific support for policy decisions and in light of the decade-old perspective of a previous assessment, the USGS has completed a reassessment of the petroleum potential of the ANWR 1002 area. This was a comprehensive study by a team of USGS scientists in collaboration on technical issues (but not the assessment) with colleagues in other agencies and universities. The study incorporated all available public data and included new field and analytic work as well as the reevaluation of all previous work.
Using a methodology similar to that used in previous USGS assessments in the ANWR and the National Petroleum Reserve—Alaska, this study estimates that the total quantity of technically recoverable oil in the 1002 area is 7.7 BBO (mean value), which is distributed among 10 plays. Most of the oil is estimated to occur in the western, undeformed part of the ANWR 1002 area, which is closest to existing infrastructure. Furthermore, the oil is expected to occur in a number of accumulations rather than a single large accumulation. Estimates of economically recoverable oil, expressed by probability curves, show increasing amounts of oil with increasing price. At prices less than $13 per barrel, no commercial oil is estimated, but at a price of $30 per barrel, between 3 and 10.4 billion barrels are estimated. Economic analysis includes the costs of finding, developing, producing, and transporting oil to market based on a 12 percent after-tax return on investment, all calculated in constant 1996 dollars.
The amounts of in-place oil estimated for the ANWR 1002 area are larger than previous USGS estimates. The increase results in large part from improved resolution of reprocessed seismic data and geologic analogs provided by recent nearby oil discoveries.
This revised Fact Sheet is being issued in order to provide a more complete summary of the 1998 USGS oil and gas assessment of the Arctic National Wildlife Refuge 1002 Area. The original Fact Sheet was prepared as a hard-copy executive summary intended for distribution coincident with the May 1998 public announcement of the assessment results. Printing deadlines dictated completion of the Fact Sheet before completion of the final economic analysis. Accordingly, only a general and relatively conservative discussion of economic resources was included. This update replaces that general economic discussion with a summary of the completed economic analysis, one that was released as part of the overall documentation of the assessment provided in USGS Open-File Report 98-34. In addition, two typographical errors in the original Fact Sheet have been corrected: In figure 1, the recoverable northern Alaska gas amount is changed from 45 TCFG to 35 TCFG. In table 1, the mean volume of oil estimated for the entire assessment area is changed from 10,322 million barrels to 10,360 million barrels.
The U.S. Geological Survey is solely responsible for the input and results of this assessment. The USGS acknowledges the cooperation of the U.S. Fish and Wildlife Service, Bureau of Land Management, Minerals Management Service, and the Alaska Department of Natural Resources (Geological and Geophysical Surveys, Division of Oil and Gas, and Oil and Gas Conservation Commission), which provided access to data as well as feedback on geology and methodology.
For further information and to request a CD-ROM (USGS Open-File Report 98-34) containing detailed results and supporting scientific documentation, send e-mail to:
gd-energyprogram@usgs.gov
or contact:
Kenneth J. Bird (kbird@usgs.gov) (650) 329-4907
David W. Houseknecht (dhouse@usgs.gov) (703) 648-6466
| AccessibilityFOIAPrivacyPolicies and Notices | |
| |
|