
By P.B. Ging
Fact Sheet 032 02
In cooperation with the U.S. Environmental Protection Agency
Since 1991, the U.S. Geological Survey (USGS) National Water-Quality Assessment (NAWQA) Program has collected pesticide data from streams and aquifers throughout the Nation (Gilliom and others, 1995). However, little published information on pesticides in public drinking water is available. The NAWQA Program usually collects data on the sources of drinking water but not on the finished drinking water. Therefore, the U.S. Environmental Protection Agency (USEPA), in conjunction with the NAWQA Program, has initiated a nationwide pilot project to collect information on concentrations of pesticides and their breakdown products in finished drinking water, in source waters such as reservoirs, and in the basins that contribute water to the reservoirs.
The pilot project was designed to collect water samples from finished drinking-water supplies and the associated source water from selected reservoirs that receive runoff from a variety of land uses. Lake Waxahachie, in Ellis County in north-central Texas, was chosen to represent a reservoir receiving water that includes runoff from cotton cropland. This fact sheet presents the results of pesticide sampling of source water from Lake Waxahachie and in finished drinking water from the lake. Analyses are compared to indicate differences in pesticide detections and concentrations between lake water and finished drinking water.
Sampling of the selected reservoirs involved collecting water of three types—finished drinking water at the water treatment plant, water from the treatment plant intake site (source water), and water from the reservoir outflow. For Lake Waxahachie only water from the intake site and finished water from the treatment plant were sampled because no water flowed out of the reservoir during the sampling period. Samples of both waters were collected primarily during May to September 1999, a period selected to follow the annual period of peak pesticide use. (One sample was collected in December 1999.) The USGS collected the samples using protocols developed by the NAWQA Program (Shelton, 1994) and specifically adapted for this project.
Samples of source water and finished drinking water from Lake Waxahachie were analyzed for concentrations of 184 pesticides and their breakdown products by the USGS National Water Quality Laboratory (NWQL). The pesticide data from the source-water samples will provide baseline data for human-health exposure assessments, which could be useful to USEPA in developing policies for protecting source waters. The data from the source-water samples also allow reservoir-to-reservoir comparisons on a national scale. Data from finished water samples are a measure of the actual concentrations of the pesticides that the served population might consume.
Eighteen pesticides were detected in source water at the intake sampling site. Sixteen of the 18 were herbicides and their breakdown products; one was an insecticide and one was a fungicide. The most frequently detected pesticides in source water were atrazine, metolachlor, simazine, prometryn, and four atrazine breakdown products; all were detected at frequencies greater than 60 percent (table 1). Average concentrations of pesticides in source water ranged from 0.0018 microgram per liter (µg/L) for p,p'-DDE to 0.53 µg/L for atrazine. Eleven of the 18 pesticides detected have USEPA-established standards for drinking water, and seven have aquatic-life guidelines established by USEPA, Environment Canada, or a joint U.S.-Canada commission. Concentrations of one pesticide—p,p'-DDE, a breakdown product of DDT—were greater than the aquatic-life guidelines in four of six samples with detections, and no concentrations were greater than drinking-water standards.
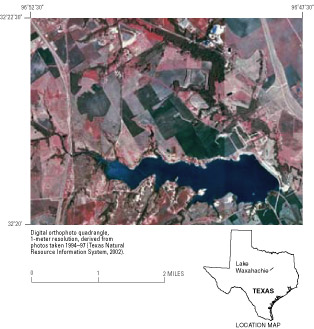 |
| Runoff from cotton cropland in the watershed of Lake Waxahachie can reach the lake. |
| Table
1.
Pesticides detected in Lake Waxahachie (source water) and finished drinking
water [mg/L, micrograms per liter; --, not detected] |
|||||||||
| Compound | Use | Source water | Finished drinking water | ||||||
|---|---|---|---|---|---|---|---|---|---|
| Number of samples |
Frequency of detection (percent) |
Average concentration (mg/L) |
Average concentration (mg/L) |
Frequency of detection (percent) |
Number of samples |
||||
| 2,4-D | herbicide | 21 | 52.4 | 0.0510 | 0.0413 | 42.9 | 7 | ||
| 2,4-D methyl ester | 2,4-D breakdown product | 21 | 9.5 | .0235 | -- | -- | 7 | ||
| Atrazine | herbicide (corn) | 22 | 100 | .5297 | .5194 | 100 | 9 | ||
| Deethylatrazine | atrazine breakdown product | 22 | 100 | .0928 | .1155 | 100 | 9 | ||
| Deethyldeisopropylatrazine | atrazine breakdown product | 21 | 61.9 | .0115 | .0100 | 57.1 | 7 | ||
| Deisopropylatrazine | atrazine breakdown product | 21 | 90.5 | .0132 | .0151 | 100 | 7 | ||
| Hydroxyatrazine | atrazine breakdown product | 21 | 85.7 | .4180 | .5107 | 100 | 7 | ||
| Alachlor | herbicide | 21 | 4.8 | .0040 | -- | -- | 9 | ||
| Bentazon | herbicide | 21 | 9.5 | .0044 | -- | -- | 7 | ||
| Diuron | herbicide (cotton) | 21 | 9.5 | .0076 | -- | -- | 7 | ||
| Metolachlor | herbicide | 21 | 100 | .0456 | .0372 | 100 | 9 | ||
| Prometon | herbicide | 21 | 28.6 | .0054 | .0059 | 33.3 | 9 | ||
| Prometryn | herbicide | 22 | 77.3 | .0068 | -- | -- | 8 | ||
| Simazine | herbicide | 21 | 81 | .0161 | .0154 | 88.9 | 9 | ||
| Tebuthiuron | herbicide (highway) | 22 | 40.9 | .0050 | .0070 | 44.4 | 9 | ||
| Diazinon | insecticide | 21 | 28.6 | .0035 | -- | -- | 9 | ||
| Metalaxyl | fungicide | 21 | 4.8 | .0030 | -- | -- | 7 | ||
Ten pesticides, all of which were herbicides and their breakdown products, were detected in the finished drinking-water samples. Pesticide concentrations in all drinking-water samples were well below applicable drinking-water standards and aquatic-life guidelines. All the pesticides detected in finished drinking water also were detected in source water. The most frequently detected pesticides in finished drinking water were atrazine, metolachlor, simazine, and four atrazine breakdown products—the same pesticides most frequently detected in source water (except for prometryn, which was not detected in finished water). Atrazine, deethylatrazine, and metolachlor were detected in all of the drinking-water samples (and all of the source-water samples). These compounds are among the top pesticides detected nationally in agricultural settings across the United States (U.S. Geological Survey, 1999). Average concentrations of the pesticides detected in drinking-water samples ranged from nondetectable to 0.52 µg/L for atrazine. Two atrazine breakdown products had greater frequencies of detection and three had larger average concentrations in the drinking-water samples than in the source-water samples, which suggests that breakdown of atrazine might have occurred during the time of treatment. Average concentrations of the other pesticides detected in finished drinking water were similar to their concentrations in lake water.
Gilliom, R.J., Alley, W.M., and Gurtz, M.E., 1995, Design of the National Water-Quality Assessment Program—Occurrence and distribution of water-quality conditions: U.S. Geological Survey Circular 1112, 33 p.
Shelton, Larry, 1994, Field guide for collecting and processing stream-water samples for the National Water-Quality Assessment Program: U.S. Geological Survey Open-File Report 94–455, 42 p.
Texas Natural Resource Information System,
2002, Data distribution system—Forreston 7-1/2-minute quadrangle: Accessed
March 15, 2002, at URL
http://www.tnris.state.tx.us/DigitalData/doqs.htm
U.S. Geological Survey, 1999, The quality of our Nation's waters—Nutrients and pesticides: U.S. Geological Survey Circular 1225, 82 p.
Information on technical reports and hydrologic data related to this study can be obtained from:
Trinity NAWQA Chief
U.S. Geological Survey Phone: (512) 927–3500
8027 Exchange Dr. FAX: (512) 927–3590
Austin, TX 78754–4733 World Wide Web:
E-mail: dc_tx@usgs.gov http://tx.usgs.gov/
| AccessibilityFOIAPrivacyPolicies and Notices | |
 |
|