
U.S. Geological Survey
USGS Fact Sheet FS-037-02
by Janet M. Carter, Joyce E. Williamson, and Ralph W. Teller
This document is also available in pdf format: fs-037-02.pdf (1.3 MB)
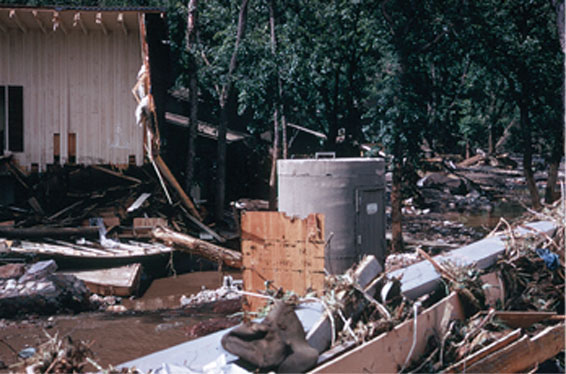
On June 9-10, 1972, extremely heavy rains over the eastern Black Hills of South Dakota produced record floods on Rapid Creek and other streams in the area. Nearly 15 inches of rain fell in about 6 hours near Nemo, and more than 10 inches of rain fell over an area of 60 square miles (Schwartz and others, 1975). According to the Red Cross, the resulting floods left 238 people dead and 3,057 people injured. In addition to the human tragedy, total damage was estimated in excess of $160 million (about $664 million in 2002 dollars), which included 1,335 homes and 5,000 automobiles that were destroyed (Schwartz and others, 1975) (fig. 1).
June 2002 marks the 30th anniversary of the largest and most costly flood event in Black Hills recorded history. For many people that lived in or visited the Black Hills area on June 9-10, 1972, the memory of the flood will always be clear. For others, the details are fading along with the impetus for preventing another flood disaster in the Black Hills area. This fact sheet provides a summary of some of the hydrologic conditions that led up to the 1972 flood, comparisons of the 1972 flood to other floods in the Black Hills area, and a description of current flood protection and warning capabilities in the area. Also, this fact sheet is a reminder that extreme floods have occurred in the Black Hills and will occur again. Continued collection of hydrologic data in the Black Hills is important for flood monitoring and preparing for future floods.
| Photograph by Perry H. Rahn, South Dakota School of Mines and Technology |
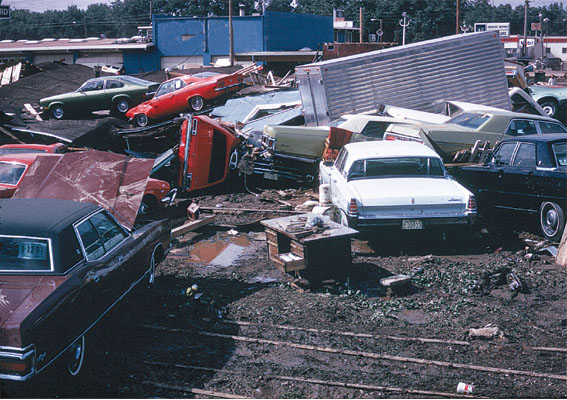 |
| Figure 1. The 1972 flood destroyed 5,000 automobiles, including these cars that were parked at a dealership on East Boulevard. |
Scattered showers had occurred throughout the Black Hills area on several days prior to the heavy rains that began on June 9. Near Pactola Dam, these earlier showers had left the soil saturated, which increased the amount of runoff for the flood of June 9-10 (Schwartz and others, 1975).
Rainfall began in the Black Hills area on the afternoon of June 9 when a group of almost-stationary thunderstorms formed over the eastern Black Hills. The heavy rains that fell until about midnight partly were the result of a strong low-level easterly airflow that forced moist air upslope over the Black Hills. This strong and sustained orographic effect caused the air to rise, cool, become very unstable, and release its moisture in repeating thunderstorms. Light winds at higher atmospheric levels allowed the storms to remain nearly stationary, which resulted in extremely heavy rainfall. Precipitation totals for June 9-10 ranged from 4 inches to more than 12 inches in the Rapid Creek watershed between Pactola Dam and Rapid City (fig. 2). In the Boxelder Creek watershed, 15 inches of rain during a 6-hour period was measured at Nemo. The heaviest rainfall averaged about four times the 6-hour amounts that are to be expected once every 100 years in the area (National Oceanic and Atmospheric Administration, 1972).
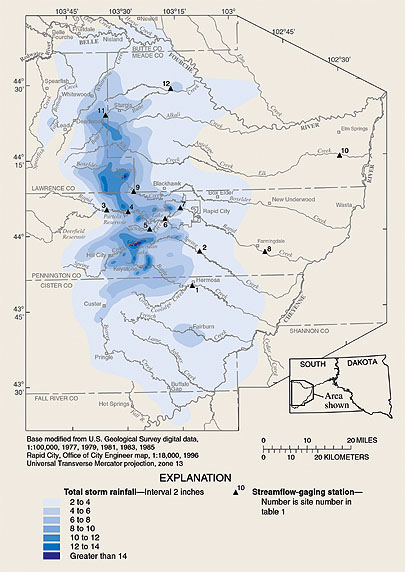 |
| Figure 2. Total storm rainfall for June 9-10, 1972 (from Schwartz and others, 1975). Locations of selected streamflow-gaging stations also are shown. |
The resulting runoff produced record floods (highest peak flows recorded) along Battle, Spring, Rapid, and Boxelder Creeks. Smaller floods also occurred along Elk Creek and Bear Butte Creek.
Although Pactola Reservoir was effective in storing runoff that originated upstream of Pactola Dam, the heaviest rainfall occurred downstream of the dam. Most of the flow that passed through Rapid City via Rapid Creek originated in the 51-square-mile drainage area between Pactola Dam and Canyon Lake. Flood waters that reached Rapid City between 9:30 and 10:00 p.m. on June 9 carried large amounts of debris that clogged the spillway of the Canyon Lake Dam. The dam at Canyon Lake failed at about 10:45 p.m. However, the effect of this dam failure (fig. 3) on the subsequent flood wave into urban Rapid City has been difficult to assess because the amount of water coming down Rapid Creek and several tributaries (accounting for 86 percent of the peak flow) far overshadowed the amount of water in the small lake (Schwartz and others, 1975). The peak flow of 50,000 cubic feet per second (ft3/s) was carried through Rapid City via Rapid Creek at about midnight on June 9, while many people were asleep and unaware of the impending flood. The stage of Rapid Creek (measured above Canyon Lake) rose more than 13 feet in 5 hours during the flood.
| Photograph by Perry H. Rahn, South Dakota School of Mines and Technology |
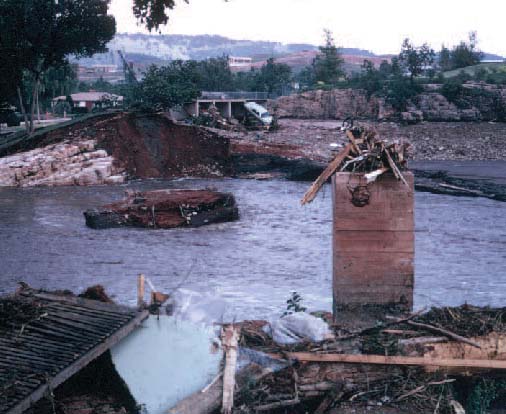 |
| Figure 3. Photograph of the remains of the Canyon Lake Dam the morning after it failed. During the flood, the spillway of the dam clogged with floating debris. When the dam failed at about 10:45 p.m. on June 9, 1972, a surge of water was sent into urban Rapid City. |
Extreme flooding also occurred along Battle Creek and its tributaries because this area received some of the most intense rainfall. In Keystone, eight people were killed and much of the town was washed away. High runoff occurred between Hill City and Sheridan Lake, where some water was stored for a short time and slightly reduced the flood peaks downstream. Boxelder Creek also experienced extreme flooding, although total damage was relatively low because of the area's sparse development at that time. Significant flooding occurred in the Elk Creek and Bear Butte Creek Basins, although these basins were not in the area of heaviest rainfall.
The floods struck quickly and forcefully, but they did not last long nor did they make much impact farther downstream in the basins. Water in Rapid Creek within Rapid City was back within its banks by 5:00 a.m. on June 10. All of the streams that experienced flooding drain into the Cheyenne River, but the peaks were diminished considerably by the time they were discharged into the Cheyenne River. As the peak flows moved into less-steep terrain, the flows spread out over a wide area, and much of the water was stored in the flood plains.
Although the 1972 Black Hills-Rapid City flood was the largest flood recorded in the Black Hills area, numerous previous floods had occurred in the area. The earliest recorded flood occurred during June 10-11, 1878, with an estimated peak flow of 7,500 ft3/s on Rapid Creek (U.S. Army Corps of Engineers, 1973) and one life lost (Rapid City Journal). On May 17, 1883, a flood on Rapid Creek resulting from heavy rainfall and rapid snowmelt washed out many bridges and caused extensive damage in Rapid City; the peak flow was estimated to be 8,400 ft3/s (U.S. Army Corps of Engineers, 1973)
Annual maximum peak flows recorded since 1900 for two gaging stations on Rapid Creek—above Canyon Lake and at Rapid City—are shown in figure 4. The second largest flood recorded along Rapid Creek occurred in May-June 1907 with an estimated peak flow of 13,000 ft3/s (U.S. Army Corps of Engineers, 1973). During the 1907 flood, Canyon Lake Dam was overtopped and partly washed away, and many bridges, roads, and railroad tracks were extensively damaged or destroyed. On May 11, 1920, heavy rain and melting snow caused flooding with an estimated peak flow of about 8,000 ft3/s (U.S. Army Corps of Engineers, 1973) that led to the evacuation of approximately 50 homes and the destruction of several bridges. On May 23, 1952, a peak flow of 2,600 ft3/s was recorded at the gaging station above Canyon Lake (table 1). A peak flow of 3,300 ft3/s was recorded at the gaging station at Rapid City on July 13, 1962 (table 1). The 1962 flood damaged 120 mobile homes, 2 hotels, and more than 400 residences, with a total estimated damage of $800,000 (U.S. Army Corps of Engineers, 1973), which is about $4.1 million in 2002 dollars.
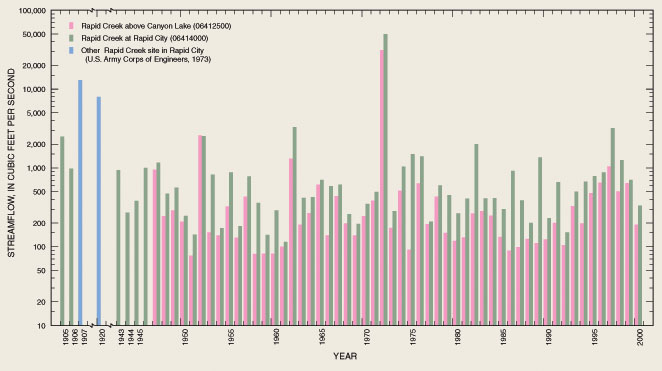 |
| Figure 4. Annual maximum peak flows since 1900 for selected gaging stations on Rapid Creek. |
| Table 1. Comparison of 1972 peak
flows with other peak flows for selected current (2002) U.S. Geological
Survey streamflow-gaging stations [ft3/s; cubic feet per second; --, no record] |
||||||||||||||
|
|
||||||||||||||
| Site number (fig. 2) |
Station name | Station number |
||||||||||||
|---|---|---|---|---|---|---|---|---|---|---|---|---|---|---|
| Peak flows prior to June 1972 |
Flood of
June 9-10, 1972 |
Peak flows after June 1972 |
||||||||||||
| Period of record |
Year | Streamflow (ft3/s) |
Streamflow (ft3/s) |
Date | Streamflow (ft3/s) |
|||||||||
|
|
||||||||||||||
|
1
|
Battle Creek at Hermosa |
06406000
|
1949-72
|
1952 | 2,950 | 21,400 |
05-08-95
|
2,400
|
||||||
|
2
|
Spring Creek near Hermosa |
06408500
|
1949-72
|
1967 | 772 | 13,400 |
05-30-96
|
6,910
|
||||||
|
3
|
Rapid Creek above Pactola Reservoir, at Silver City |
06410500
|
1953-72
|
1965 | 2,060 | 228 |
06-18-98
|
1,290
|
||||||
|
4
|
Rpid Creek below Pactola Dam. |
06411500
|
1928-32
1946-72 |
1952 | 2,170 | 378 |
06-07-96
|
450
|
||||||
|
5
|
Victoria Creek below Victoria Dam, near Rapid City | 06412250 | -- | -- | -- | 6,860 | 06-15-99 | 173 | ||||||
|
6
|
Rapid Creek above Canyon Lake, near Rapid City | 06412500 | 1946-72 | 1952 | 2,600 | 31,200 | 06-02-97 | 1,050 | ||||||
|
7
|
Rapid Creek at Rapid City | 06414000 | 1903-06 1942-72 |
1962 | 3,300 | 50,000 | 06-02-97 | 3,190 | ||||||
|
8
|
Rapid Creek near Farmingdale | 06421500 | 1946-72 | 1947 | 2,640 | 7,320 | 05-27-96 | 3,830 | ||||||
|
9
|
Boxelder Creek near Nemo | 06422500 | 1945-47 1966-72 |
1946 | 1,180 | 30,100 | 06-15-76 | 1,460 | ||||||
|
10
|
Elk Creek near Elm Springs | 06425500 | 1949-72 | 1952 | 8,540 | 1,880 | 05-28-96 | 7,660 | ||||||
|
11
|
Bear Butte Creek near Galena | 06437200 | 1965-69 | 1965 | 4,950 | 19,000 | 06-18-98 | 1541 | ||||||
|
12
|
Bear Butte Creek near Sturgis | 06437500 | 1945-72 | 1962 | 12,700 | 7,220 | 05-08-95 | 24,310 | ||||||
| 1Period
of record since 1972 is 1998-2001. 2Period of record since 1972 is 1990-2001. |
||||||||||||||
A peak flow of 31,200 ft3/s occurred at the gaging station above Canyon Lake (fig. 5) during the 1972 flood and was 12 times the previous maximum of 2,600 ft3/s recorded in 1952. The peak flow of 50,000 ft3/s at the gaging station at Rapid City during the 1972 flood was more than four times the previous estimated maximum of 13,000 ft3/s during May-June 1907. The 1972 peak flow at this station was more than 15 times the previous recorded maximum (3,300 ft3/s on July 13, 1962) since construction of Pactola Dam in 1956.
|
Can the 1972 Flood Happen Again?
The answer is yes. The 1972 flood on Rapid Creek has an estimated recurrence interval of 500 years (Burr and Korkow, 1996), which means that a flood of this magnitude will occur an average of once every 500 years. Every year there is a 0.2-percent chance (1 in 500) of experiencing a similar flood. Because of the short period of record for Rapid Creek gaging stations, the recurrence interval of 500 years may be revised substantially as additional data are collected. “Floods are natural and normal phenomena. They are catastrophic simply because man occupies the flood plain, the highway channel of a river (Bue, 1967).” |
| Photograph by Perry H. Rahn, South Dakota School of Mines and Technology |
 |
| Figure 5. Photograph of U.S. Geological Survey streamflow-gaging station Rapid Creek above Canyon Lake near Rapid City (06412500) the day after the flood. A peak discharge of 31,200 cubic feet per second occurred at this site just before midnight on June 9, 1972. In the background are the remains of new houses that people were moving into the night of the flood. |
Following the 1972 flood, most of the largest subsequent peak flows for Black Hills area streams occurred during the middle to late 1990's (table 1), which corresponds with the wettest period in the Black Hills area since 1931 (Driscoll and others, 2000). However, none of these subsequent peak flows have come close to exceeding the peak flows recorded during the 1972 flood. Severe flooding occurred in the Black Hills on May 8-10, 1995, generally outside of the Rapid City area. Damage to roads and bridges was widespread; rock and mudslides closed highways in Sturgis and in Boulder Canyon near Deadwood. Many homes suffered water damage. More recently, flooding has occurred on Spring Creek on May 30, 1996, and in Rapid City on June 2, 1997, but damage was very minor.
In the aftermath of the 1972 flood, interim and long-range programs were initiated and millions of federal dollars were spent in Rapid City and the surrounding stricken communities (Rahn, 1984). Rapid City approved a flood-plain management program, known as the “greenway” concept, whereby most of the flood plain was converted into large parks. Many businesses were allowed to remain in the flood plain, but houses and motels in the floodway were either razed or moved to new locations based on the underlying concept that no one should sleep within the flood plain. Canyon Lake Dam and many bridges were redesigned and rebuilt to prevent debris clogs.
Rapid City and surrounding communities are susceptible to extreme flooding because of their location in and around the Black Hills. Most floods in the Black Hills area are caused by intense rainfall over steep watersheds, which allows little time for warning residents of flood threats.
In 1997, a flood-warning system was implemented by the USGS in cooperation with the Rapid City-Pennington County Emergency Management and National Weather Service (NWS) (Teller and others, 2000). Combination precipitation/streamflow-gaging stations (fig. 6) monitor rainfall and subsequent rises in stream stage on a continuous basis during the flood season (April-October). This real-time information is relayed via a satellite network to the NWS, where forecasters can send warning to the public when streams rise to threatening levels. Rapid City-Pennington County Emergency
| Photograph by Brenda J. Athow |
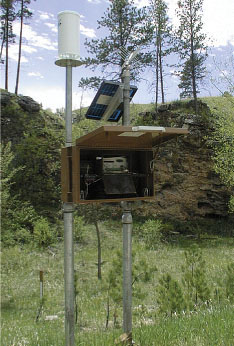 |
| Figure 6. Photograph of a current flood-warning system gaging station. Real-time data from the gaging station are relayed via a satellite network to the National Weather Service and Rapid City-Pennington County Emergency Management. |
Management can then coordinate emergency response, public safety services, and local governmental agencies as needed. Currently (2002), the USGS collects data at the 20 flood-warning sites in the Black Hills area, which are located along Battle, Spring, Rapid, Victoria, Boxelder, Spearfish, and Bear Butte Creeks and their tributaries.
The USGS currently operates a network of about 120 continuous-record streamflow-gaging stations and 35 high-flow partial-record gages in South Dakota. Miscellaneous annual streamflow measurements also are made at several additional sites throughout the State. When flooding occurs, the USGS mobilizes personnel to collect streamflow data in affected areas. Streamflow data improves flood forecasting, provides additional data for flood-frequency analysis that is used by the South Dakota Department of Transportation for bridge design, and provides information for use by emergency management agencies before, during, and after flooding.
Bue, C.D., 1967, Flood information for flood-plain planning: U.S. Geological Survey Circular 539, 10 p.
Burr, M.J., and Korkow, K.L., 1996, Peak-flow frequency estimates through 1994 for gaged streams in South Dakota: U.S. Geological Survey Open-File Report 96-202, 407 p.
Driscoll, D.G., Hamade, G.R., and Kenner, S.J., 2000, Summary of precipitation data for the Black Hills area of South Dakota, water years 1931-98: U.S. Geological Survey Open-File Report 00-329, 151 p.
National Oceanic and Atmospheric Administration, 1972, Black Hills Flood of June 9, 1972: Rockville, Maryland, U.S. Department of Commerce, Natural Disaster Survey Report 72-1, 20 p.
Rahn, P.H., 1984, Flood-plain management program in Rapid City, South Dakota: Geological Society of America Bulletin, v. 95, p. 838-843.
Schwartz, F.K., Hughes, L.A., Hansen, E.M., Petersen, M.S., and Kelly, D.B., 1975, The Black Hills-Rapid City Flood of June 9-10, 1972—A description of the storm and flood: U.S. Geological Survey Professional Paper 877, 47 p.
Teller, R.W., Huse, T.L., and Owens, Park, 2000, Development and operation of a cooperative flood-warning system, in Strobel, M.L., and others, eds., Hydrology of the Black Hills—Proceedings of the 1999 Conference on the Hydrology of the Black Hills: Rapid City, South Dakota School of Mines and Technology Bulletin no. 20, p. 59-62.
U.S. Army Corps of Engineers, 1973, Flood Plain Information—Rapid Creek, Rapid City, South Dakota: Omaha, Nebraska, Department of the Army, 48 p., 16 pl.
1. On the 1972 flood, please visit the USGS Web site—http://sd.water.usgs.gov/projects/1972flood/
2. Real-time streamflow data in South Dakota, please visit the USGS Web site at—http://sd.water.usgs.gov/
|
For more information, please contact:District ChiefU.S. Geological Survey 1608 MT. View Road Rapid City, SD 57702
Telephone 605-355-4560
|
U.S. Department of the Interior
U.S. Geological Survey Fact Sheet FS–037–02