Measuring Land Subsidence from Space
US Department of the Interior
US Geological Survey
Fact Sheet-051-00
April 2000
A pdf of the
report is available (1.6MB).
|
|
Land subsidence is a gradual settling or sudden sinking of the Earth's
surface owing to subsurface movement of earth materials. Subsidence in
the United States has directly affected more than 17,000 square miles
in 45 states, and associated annual costs are estimated to be approximately
$125 million. The principal causes of subsidence are aquifer-system compaction,
drainage of organic soils, underground mining, hydrocompaction, natural
compaction, sinkholes, and thawing permafrost (National Research Council,
1991).
A powerful new mapping tool (InSAR) is a critical element in the assessment
and mitigation of subsidence. InSAR is capable of remotely sensing small
changes in land surface elevation at an unprecedented level of spatial
detail. The new displacement maps enhance our capabilities to monitor
and manage subsidence caused by the compaction of susceptible aquifer
systems, and reveal new insights into the controlling physical processes.
|
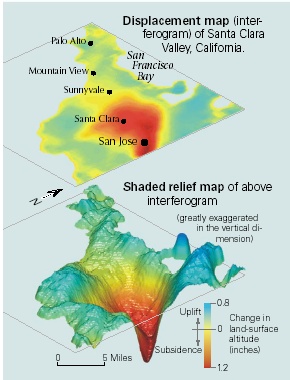
| Interferogram of Santa Clara Valley shows patterns
of subsidence and some uplift occurring over 7 months in 1997, from January
4 to August 2. A central subsidence zone, (red) the result of seasonal ground-water
pumping, is fully recoverable. |
Interferometric Synthetic Aperture Radar (InSAR) is a powerful new tool that
uses radar signals to measure deformation of the Earth's crust at an unprecedented
level of spatial detail and high degree of measurement resolution.
InSAR is now being used by the
USGS and others to map and monitor
subsidence caused by the compaction
of aquifer systems. Geophysical
applications of radar interferometry take
advantage of the phase component of reflected
radar signals to measure apparent changes
in the range distance of the land surface
(Gabriel and others, 1989; Massonnet and
Feigl, 1998). Ordinary radar on a typical
Earth-orbiting satellite has a very poor
ground resolution of about 3 to 4 miles
because of the restricted size of the antenna
on the satellite. Synthetic Aperture Radar
(SAR) takes advantage of the motion
of the spacecraft along its orbital track
to mathematically reconstruct (synthesize)
an operationally larger antenna and yield
high-spatial-resolution imaging capability
on the order of hundreds of feet. The
size of a picture element (pixel) on a
typical SAR image made from satellite-borne
radar may be as small as tens of thousands
of square feet, depending how the image
is processed.
For landscapes with more or less stable radar reflectors (such as buildings
or other engineered structures, or undisturbed rocks and ground surfaces) over
a period of time, it is possible to make highprecision measurements of the change
in the position of the reflectors by subtracting or "interfering" two radar
scans made of the same area at different times. This is the principle behind
InSAR.
|
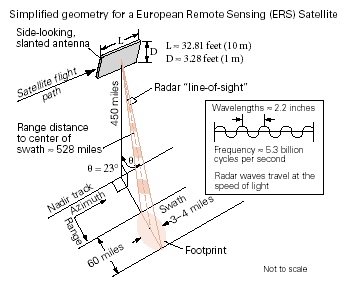
Radar is an active sensor, transmitting a signal of electromagnetic
energy. Satelliteborne radar using one antenna transmits a pulsed train
of microwaves. The waves reflect off the ground surface, and echoes are
received by the moving antenna, producing a recorded image of the scanned
ground that is continuous along the track of the satellite and about 60
miles wide.
The restricted size of the satellite antenna limits the
spatial resolution to 3 to 4 miles on the ground. Synthetic Aperture Radar
(SAR) imaging "synthesizes" an effectively larger antenna (about 3 miles
long) with a spatial resolution on the order of 16 feet by pulsing the
microwaves every 16 feet of satellite travel.
The 3- to 4-mile-wide footprints overlapped at 16-foot intervals
along the ground track are processed through a technique similar to medical
x-ray imaging. Averaging of the signal is done to improve signal coherence,
and the actual spatial resolution is typically on the order of 260 feet
or better.
Interferograms are made by differencing successive SAR images
taken from the same orbital position but at different times. Under favorable
radiometric conditions
0.4-inch to 0.2-inch resolution is possible in the line-of-sight (range)
of the radar.
|
 |
Under ideal conditions, it is possible to resolve changes in elevation on
the order of 0.2 to 0.4 inches (5 to 10 mm) at the scale of one pixel. Interferograms,
formed from patterns of interference between the phase components of two radar
scans made from nearly the same antenna position (viewing angle) but at different
times, have demonstrated dramatic potential for high-density spatial mapping
of ground-surface displacements associated with tectonic ( Massonnet and others,
1993; Zebker and others, 1994) and volcanic strains (Massonnet and others, 1995;
Rosen and others, 1996; Wicks and others, 1998). InSAR has also recently been
used to map localized crustal deformation and land subsidence associated with
geothermal fields in Imperial Valley, California (Massonnet and others, 1997),
Long Valley, California (W. Thatcher, USGS, written communication, 1997), and
Iceland (Vadon and Sigmundsson, 1997), and with oil and gas fields in the Central
Valley, California (Fielding and others, 1998). InSAR has also been used to
map regional-scale land subsidence caused by aquifer-system compaction in the
Antelope Valley, California ( Galloway and others, 1998), Las Vegas Valley,
Nevada (Amelung and others, 1999), and Santa Clara Valley, California ( Ikehara
and others, 1998).
| Different methods of measuring land subsidence |
| METHOD |
Component displacement |
Resolution1 (millimeters) |
Spatial density2 (samples/survey) |
Spatial scale (elements) |
| Spirit level |
vertical
|
0.1-1
|
10-100
|
line-network
|
| Geodimeter |
horizontal
|
1
|
10-100
|
line-network
|
| Borehole extensometer |
vertical
|
0.01-0.1
|
1-3
|
point
|
| Horizontal extensometer: |
|
|
|
|
| Tape |
horizontal
|
0.3
|
1-10
|
line-array
|
| Invar wire |
horizontal
|
0.0001
|
1
|
line
|
| Quartz tube |
horizontal
|
0.00001
|
1
|
line
|
| GPS |
vertical horizontal
|
20 5
|
10-100
|
network
|
| InSAR |
range
|
5-10
|
100,000-10,000,000
|
map pixel3
|
|
1Measurement resolution attainable under optimum conditions.
Values are given in metric units to conform with standard geodetic guidelines.
(One inch is equal to 25.4 millimeters and 1 foot is equal to 304.8 millimeters.)
2Number of measurements generally attainable under good
conditions to define the spatial extent of land subsidence at the scale
of the survey.
3A pixel on an InSAR displacement map is typically
40 to 80 meters square on the ground.
|
InSAR maps subsidence at high spatial detail and reveals new insights
In the Antelope Valley, Mojave Desert, California, an interferogram for the
period October 20, 1993 to December 22, 1995 revealed up to 2 inches of additional
subsidence in areas previously affected by as much as 6 feet of subsidence between
1930-92 (Galloway and others, 1998). The regions of maximum subsidence detected
during the 26-month period correlated well with declining ground-water levels.
In another part of Antelope Valley formerly affected by ground-water depletion
and subsidence, about 1 inch of subsidence was detected on the interferogram
despite the fact that ground-water levels had been recovering-since 1990. This
suggests residual (time-delayed) compaction due to the presence of thick aquitards.
An independent computer simulation of aquifer-system compaction for the same
period as the interferogram showed that though the general patterns of subsidence
detected by the interferogram could be explained by the simulation, the detailed
spatial variations in the interferogram could not. These results highlight the
potential use of spatially detailed InSAR measurements to provide
better constraints for computer simulations of land subsidence.

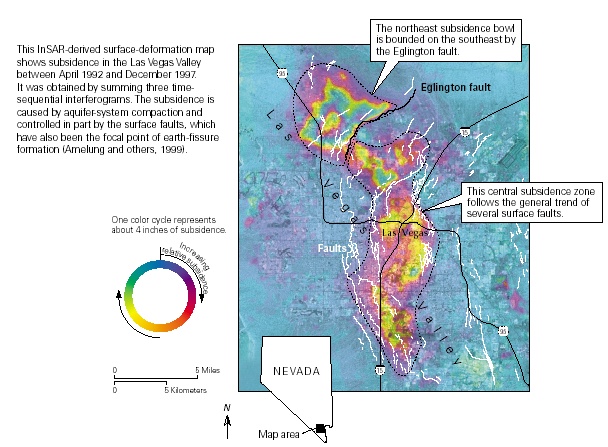
Interferograms for Las Vegas Valley demonstrate the
intimate connection between ground-water withdrawal, faults and subsidence.
An interferogram for the period April 21, 1992 to December 5, 1997 delineates
two main features--a subsidence bowl in the northwest and an elongated subsiding
zone in the central part of the valley. The northwest subsidence bowl includes
the area of maximum subsidence of nearly 7.5 inches. Its southeastern boundary
is aligned with the Eglington fault, one of several Quaternary faults cutting
the valley-floor alluvium. Little subsidence is detected immediately southeast
of the fault. Similarly, the shape of the central subsidence zone follows the
general trends of several mapped faults. The map suggests that the spatial distribution
of land subsidence in Las Vegas Valley is controlled by Quaternary faults, to
a much greater degree than previously suspected. The faults may juxtapose sediments
of differing time-consolidation properties, or they may act as barriers to ground-water
flow, impeding the horizontal propagation of fluid-pressure-changes and creating
ground-waterlevel differences across the faults.
|
|
| San Jose and surrounding communities sprawl across Santa Clara
Valley ("Silicon Valley") where a maximum detected subsidence of 14 feet
occurred in downtown San Jose between 1910 and 1995. Since the late 1980s
subsidence has been arrested due largely to the importation of surface water.
Urban settings are good candidates for radar interferometry because the
structures make good radar reflectors. |
In Santa Clara Valley, California, subsidence has been arrested by importation
of surface water and careful management of the aquifer system. However, the
potential for renewed subsidence is a concern for the Santa Clara Valley Water
District. One of the District's objectives is to limit ground-water extractions
that would cause inelastic (irreversible) compaction of the valley's aquifer
system. Seasonal and longer-term elevation changes were measured from successive
satellite radar passes during 1992-1997. The longer-term (~5 year) interferogram
indicates no change for most of the southwestern Santa Clara Valley and land-surface
uplift of up to about 1 inch in the northern and eastern parts of the valley.
This uplift is correlated to the recovery of ground-water levels that has been
occurring for several years as a result of reduced pumpage and increased recharge.
In contrast, the seasonal (8 month) interferogram reveals a large region in
San Jose undergoing elastic deformation caused by seasonal groundwater-level
fluctuations. The eastern extent of this deformation appears to be aligned with
a Quaternary fault, the Silver Creek fault, several miles west of and roughly
parallel to the tectonically active Hayward Fault. The InSAR derived displacements
are consistent with historical patterns of subsidence and vertical displacements
measured in deepseated borehole extensometers in Sunnyvale and San Jose.
 |
|
Profiles of ground displacements sampled from cross sections A-A’
and B-B’ on the seasonal interferogram reveal steep displacement
gradients near the trace of an inferred northwesterly extension of the
buried Silver Creek fault zone. Recent geophysical surveys (seismic reflection/refraction),
undertaken as a result of the interferogram, confirm the presence of buried
faults at this boundary (R. Catchings, USGS, written communication, 2000).
(Radar data used to produce the interferograms shown in this
Fact Sheet were obtained from the European Space Agency, distributed through
Eurimage Corporation and Radarsat International for purposes of research
and development.)
|
--D.L. Galloway, D.R. Jones, and
S.E. Ingebritsen
REFERENCES
Amelung, F., Galloway, D.L., Bell, J.W.,
Zebker, H.A., and Laczniak, R.J., 1999, Sensing the ups and downs of Las Vegas--InSAR
reveals structural control of land subsidence and aquifer-system deformation:
Geology,
v. 27, p. 483-486.
Fielding, E.J., Blom, R.G., and Goldstein,
R.M., 1998, Rapid subsidence over oil fields measured by SAR interferometry:
Geophysical Research Letters, v. 27, p. 3,215-3,218.
Gabriel, A.K., Goldstein, R.M., and Zebker,
H.A., 1989, Mapping small elevation changes over large areas--Differential radar
interferometry: Journal of Geophysical Research, v. 94, p. 9,183-9,191.
Galloway, D.L., Hudnut, K.W., Ingebritsen,
S.E., Phillips, S.P., Peltzer, G., Rogez, F., and Rosen,
P.A., 1998, Detection of aquifer system compaction and land subsidence using
interferometric synthetic aperture radar, Antelope Valley, Mojave Desert, California:
Water Resources Research, v. 34, p. 2,573-2,585.
Ikehara, M.E., Galloway, D.L., Fielding,
E., Bürgmann,
R., Lewis, A.S., and Ahmadi, B., 1998, InSAR imagery reveals seasonal and longer-term
land-surface elevation changes influenced by ground-water levels and fault alignment
in Santa Clara Valley, California [abs.]: EOS (supplement) Transactions, American
Geophysical Union, no. 45, November 10, 1998, p. F37.
Massonnet, D., Briole, P., and Arnaud, A.,
1995, Deflation of Mount Etna monitored by spaceborne radar interferometry:
Nature, v. 375, p. 567-570.
Massonnet, D., and Feigl, K.L., 1998, Radar
interferometry and its application to changes in the earth's surface: Reviews
of Geophysics, v. 36, p. 441-500.
Massonnet, D., Holzer, T., and Vadon, H.,
1997, Land subsidence caused by the East Mesa geothermal field, California,
observed using SAR interferometry: Geophysical Research Letters, v. 24, p. 901-904.
Massonnet, D., Rossi, M., Carmona, C., Adragna,
F., Peltzer, G., Feigl, K., and Rabaute, T., 1993, The displacement field of
the Landers earthquake mapped by radar interferometry: Nature, v. 364, p. 138-142.
National Research Council, 1991, Mitigating
losses from land subsidence in the United States: Washington, D. C., National
Academy Press, 58 p.
Rosen, P.A., Hensley, S., Zebker, H.A.,
Webb, F.H., and Fielding, E., 1996, Surface deformation and coherence measurements
of Kilauea volcano, Hawaii, from SIR-C radar interferometry: Journal of Geophysical
Research,
v. 101, p. 23,109-23,125.
Vadon, H., and Sigmundsson, F., 1997, 1992-1995
crustal deformation at Mid-Atlantic ridge, SW Iceland, mapped by radar interferometry:
Science, v. 275, p. 193-197.
Wicks, C. Jr., Thatcher, W., and Dzurisin,
D., 1998, Migration of fluids beneath Yellowstone Caldera inferred from satellite
radar interferometry: Science, v. 282, p. 458-462.
Zebker, H.A., Rosen, P.A., Goldstein, M.,
Gabriel,
A., and Werner, C.L., 1994, On the derivation of coseismic displacement fields,
using differential radar interferometry--The Landers earthquake: Journal of
Geophysical Research, v. 99, p. 19,617-19,634.
For additional information contact:
Devin Galloway (email: dlgallow@usgs.gov)
U.S. Geological Survey
Placer Hall/California State University,
Sacramento 6000 J Street
Sacramento, CA 95819-6129