[an error occurred while processing this directive]
Fact Sheet 076-02
Download a PDF of this document (3.3MB)
Monitoring and Assessing our Nation's Water Quality
The U.S. Geological Survey (USGS) has monitored and assessed the
quality of our Nation's streams and ground water
since its inception in 1879. Today, USGS provides information on
issues such as the suitability of water for public supply and
irrigation, aquatic ecosystem health, effects of agriculture and
urbanization on water resources, acid rain, and disposal of
radioactive waste. Through the integration of its six major
water-quality programs (described on pages 5 and 6), the USGS
continues its mission to provide timely and relevant water-resources
data and information that is freely available to all levels of
government, non-governmental organizations, industry, academia, and
the general public. The information provides a scientific basis for
decision making related to resource management and restoration, and
how we as individuals interact with our environment.
Characteristics of USGS Water Quality Activities Provide Unique
Perspective
USGS programs provide a unique perspective on water-quality
conditions, complementing much of the work conducted by local, state,
and other Federal agencies, the private sector, and the university
community. Six common characteristics of these programs are described.
First, USGS programs typically evaluate ambient water-quality
conditions over long time scales with a regional and national
perspective. This makes it possible to detect changes across time and
space and to provide insights into natural and human factors that may
be responsible for those changes. USGS programs are designed to
address issues at several scales. Some address local issues in a
particular stream or aquifer or in a particular county, while others
look at broad regional systems that cross jurisdictional boundaries.
Second, USGS programs recognize the totality of the resource,
including all components of the hydrologic cycle and the
interconnections among these components. USGS addresses conditions in
ground water, in the unsaturated zone, and in streams, lakes and
reservoirs, and recognizes surface-water and ground-water interactions
and atmospheric contributions. Inclusion of all hydrologic components
allows a full accounting of all available sources, increases
understanding of factors controlling water-quality degradation, and
maximizes the effectiveness of water-resource utilization, protection,
and restoration.
Third, USGS programs recognize the interconnections between water
quality and biological systems. USGS addresses the susceptibilities of
specific aquatic organisms, such as algae, macroinvertebrates, and
fish to water-quality degradation, and determines how biological
responses vary among the diverse environmental settings across the
Nation. Such assessments lead to improved biological monitoring and
consistent methods for assessing water-resource and environmental
results. In addition, USGS assesses microbial processes and their
effects on chemical degradation and water-quality conditions.
Fourth, USGS water-quality programs evaluate water quality in an
overall hydrologic context. Chemical and biological data for streams
are interpreted within the context of streamflow measurements, and
ground-water chemistry is interpreted with an understanding of the
ground-water flow system and aquifer characteristics. This is
important because contaminants and their potential effects on
drinking-water supplies and aquatic habitats vary over time and
largely depend on the amount of water flowing in streams and the
directions of ground-water flow.
Fifth, USGS adheres to a national quality-assurance program with
uniform methods of sampling and analysis. Monitoring data collected
from representative sites across the Nation can, thereby, be combined
into comprehensive regional and national assessments that identify and
analyze trends in water-quality conditions.
Sixth, low levels of detection—often 10 to 1,000
times lower than EPA drinking-water standards—are
used to allow an early warning of contaminants before they reach
levels of regulatory concern. In addition, the low-levels of detection
allow an improved understanding of the connections among sources,
transport, and fate of chemicals—generally not
possible with data limited to measurements above regulatory levels.
USGS Complements the Work of Others
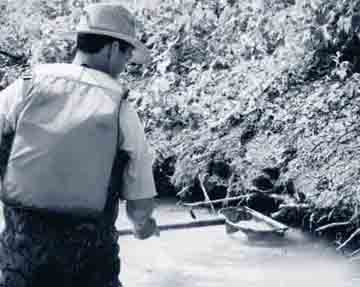
Photo from NAWQA Mississippi Embayment staff
USGS water-quality assessments characterize the ambient water
resource, which is the source of the Nation's
drinking water and of water for industrial, irrigation, and
recreational uses. The USGS assessments thereby complement much of the
compliance and regulatory monitoring conducted at the state level and
by the U.S. Environmental Protection Agency (EPA) and other Federal
agencies. Because of their regulatory responsibility, states and EPA
typically focus on resources with the greatest levels of concern. This
often makes it difficult for states and EPA to assess the total water
resource. Also, state assessments are made against a backdrop of
water-quality standards that differ from state to state. This makes
regional and national assessments problematic. As water moves between
and across state boundaries, the USGS has been able to provide
information to multiple parties that are all interested in the same
resource, but in different jurisdictional areas.
Characteristics of USGS Water-Quality Programs:
-
Ambient water-resource evaluation over long
time scales with a regional and national perspective
-
Interactions among surface water, ground water,
and the atmosphere
-
Interconnections between water quality and
biological systems
-
Water quality in a hydrologic context
-
Uniform methods of sampling and analysis
-
Low-levels of chemical detection
Long-Term Monitoring, Assessment, and Research Lead to Effective Water
Management
USGS has organized its programs around three key components that are
critical for successful water-resource management, including 1)
long-term monitoring, 2) resource assessment, and 3) research.
USGS long-term data collection provides a quantitative means to answer
the question "Are things getting better or
worse?" Water quality is constantly changing, from season
to season and from year to year. Consistent and systematic information
over the long term is needed to (1) distinguish long-term trends from
short-term fluctuations and natural fluctuations from effects of human
activities; (2) evaluate how environmental controls and strategies are
working; and, (3) choose the most cost-effective resource strategies
for the future.
USGS resource assessment addresses the many complexities of
contaminant occurrence and transport, which vary seasonally and among
watersheds because of differences in land use and chemical
applications, land-management practices, degree of watershed
development, and natural factors, such as soils, geology, hydrology,
and climate. Even among similar land uses and sources of
contamination, differences in hydrology and other natural factors can
result in different degrees of vulnerability to contamination and
different ways that water-management strategies can lead to improved
water quality.
USGS research identifies emerging contaminants (such as pesticide
degradates, hormones, steroids, and pharmaceuticals); provides new
information and innovative study approaches for addressing
contamination issues; and develops methodology for cost-effective
hydrologic assessment. USGS continually improves techniques to
understand and model sources and transport of contaminants, and
processes affecting water quality in watersheds and aquifer systems.
Continued development of reliable models helps to forecast the fate
and transport of contaminants over different time frames, geographic
areas, and environmental settings. Thus, improvements in modeling will
help provide decisions-making tools needed by stakeholders at all
levels to cost-effectively prioritize, manage, and protect their
resource.
San Francisco Bay Long-Term Study
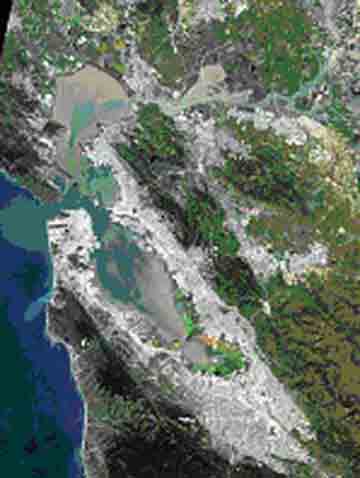
Landsat-7 image distributed by USGS EROS Data Center, Distributed
Active Archive Center
Long-term studies conducted over 26 years in San Francisco Bay help
resource managers and resource protection agencies understand the
response of the Bay's aquatic community to the
combined effects of climate variability, changes in the hydrologic
system, and the introduction of organic contaminants and trace
elements (http://sfbay.wr.usgs.gov/).
MTBE Study
USGS was first to document the national extent of occurrence of methyl
tert-butyl ether (MTBE), a fuel oxygenate, in the environment. MTBE
was added to gasoline in some parts of the country to help meet the
goals of the Clean Air Act. Because MTBE entered ground and surface
waters from leaking gasoline storage tanks and by other means, the
addition of MTBE to gasoline had the unintended consequence of
introducing a potentially harmful chemical into water resources
(http://wwwsd.cr.usgs.gov/nawqa/vocns/).
Microbiological Studies
Microbiological studies led to the identification of processes that
significantly affect the distribution of toxic metals, such as
arsenic, selenium, and mercury. Research studies of methyl mercury
formation have provided important insights into the microbial action
and chemical reactions that affect the forms of mercury and, thus its
toxicity, in aquatic ecosystems.
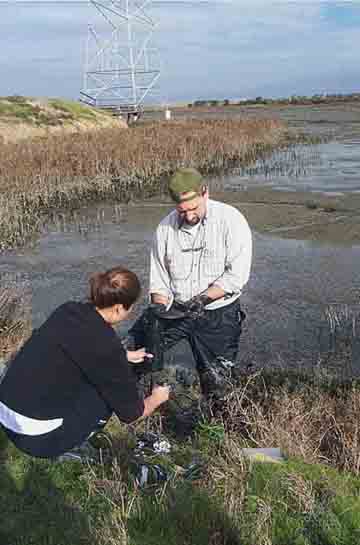
Photo by Mark Marvin-DiPasquale, U.S. Geological Survey
Techniques for Age Dating Ground Water
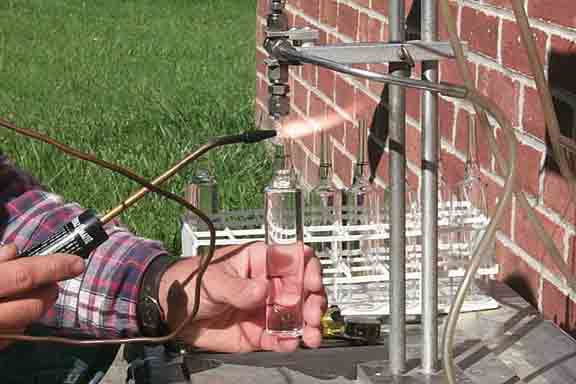
Photo by David L. Nelms, U.S. Geological Survey
USGS pioneered the use of several techniques for age dating ground
waters to identify sources of water within an aquifer, and to assess
its vulnerability to contamination. Tritium was first used by the USGS
for age dating in 1959. A similar technique was applied to
chlorofluorocarbons (CFCs) to date recent ground water. The age dating
techniques have produced important insights on sources of water and on
understanding human impacts on its quality. For example, the
age-dating findings demonstrated that improvements in ground-water
quality, such as on the Delmarva Peninsula, may not be evident for
years or even decades after farmers change their land-management
practices because of slow ground-water movement (http://water.usgs.gov/lab/cfc/).
Case Study: Nutrient Transport in the Mississippi River Basin
USGS studies of nutrient transport in the Mississippi River basin
provide a good example of how insights obtained from the integration
of long-term monitoring, resource assessment, and research can help to
better understand an important regional and national water-quality
issue. Excessive nitrogen in parts of the Mississippi River Basin
threatens wildlife habitat, recreation, and drinking-water quality.
The use of fertilizers is among the human factors that cause excess
nitrogen in the Mississippi River Basin, along with wastewater
discharges and atmospheric deposition. In addition, channelization and
loss of wetlands have decreased the degree of natural transformation
of nitrogen to innocuous gaseous forms (known as denitrification),
which naturally reduces the amount of nitrogen transported in water.
USGS monitoring at more than 40 watersheds throughout the Mississippi
River Basin during 1980 to 1996 has helped to define the relative
nitrogen yields from different parts of the watershed (defined as the
amount of nitrogen leaving a square kilometer of land, calculated from
annual loads of nitrogen going past a stream gage and the area above
the gage).
Each spring, excess nitrogen transported in the Mississippi River to
the Gulf of Mexico causes the formation of a hypoxic zone, an area of
low dissolved oxygen concentrations
(http://wwwrcolka.cr.usgs.gov/midconherb/hypoxia.html).
The resulting lack of oxygen can cause stress or death in
bottom-dwelling organisms that cannot escape to more oxygen-rich areas
of the Gulf. Data collected by university scientists (Rabalais and
others, 1999) have shown that the size of the hypoxic zone has more
than doubled since it was first systematically mapped in 1985. USGS
long-term monitoring of water quality and streamflow demonstrate that
the amount of nitrogen delivered to the Gulf of Mexico by the
Mississippi River also has increased since the late 1960s (Goolsby and
Battaglin, 2000). The amount of nitrogen delivered to the Gulf varies
from year to year because of flow conditions. For example, the amount
was low during the drought in the late 1980s but extremely high during
the flood of 1993, even though the amount of nitrogen applied to
fields in the basin was not significantly different.
In addition to monitoring, USGS conducts research and special
assessments on processes that affect nitrogen transport and
transformation in small watersheds and large river channels
throughout the Mississippi River Basin. The
research provides increased understanding of how subsurface flow,
atmospheric cycling, and different channel sizes affect whether
nitrogen is transformed to different chemical forms, is transported
downstream, or dissipates to the atmosphere. USGS scientists developed
the mass-balance regression model known as SPARROW (for
SPAtially-Referenced Regression On Watershed attributes) to better
understand the links between sources of contaminants and factors that
affect downstream transport (http://water.usgs.gov/nawqa/sparrow). The
method correlates stream nitrogen flux (the mass of nitrogen
transported downstream past a point on a river) with upstream nitrogen
inputs (such as fertilizer use, manure, wastewater discharges, and
atmospheric deposition) and with factors controlling nitrogen
transport in watersheds, including landscape and basin characteristics
(such as soil permeability, channel size, and water velocity). Results
show that nitrogen removal in streams declines rapidly as channel size
increases (Alexander and others, 2000). The proximity of nitrogen
sources to large streams and rivers, therefore, increases the ultimate
transport of nutrients to the Gulf of Mexico. Despite the long travel
times, many watersheds located along large rivers more than 2,500
kilometers from the Gulf of Mexico deliver significantly larger
fractions of nitrogen to coastal waters than watersheds located on
smaller streams less than a few hundred kilometers from the Gulf. The
delivery of nitrogen to coastal systems from point and nonpoint
sources, therefore, is not a simple function of the distance of these
sources from coastal waters.
USGS monitoring, assessment, and research in the Mississippi River
Basin continues to have important implications for nutrient
management. The information is used by states, federal agencies, and
other watershed stakeholders to develop and evaluate strategies for
improved water-quality conditions. Specifically, the information is
used to (1) help reduce nutrient losses from agricultural fields,
urban runoff, and wastewater discharges; (2) guide wetlands
restoration efforts and management of navigation control structures to
increase denitrification; and, (3) identify watersheds with
significant contributions of nitrogen and where nutrient management
strategies might have the most cost-effective opportunity for
improvement.
More than 4,000 water-quality measurements and continuous streamgaging
at 42 representative watersheds during 1980 to 1996 were used to
define the relative nitrogen yields from different areas within the
Mississippi River Basin (Modified from Goolsby and Battaglin, 2000;
http://ks.water.usgs.gov/Kansas/pubs/fact-sheets/fs.135-00.html).
USGS Water-Quality Programs
USGS water-quality programs are designed to support the three
components described above—monitoring, resource
assessment, and research needs of the
nation—although, generally each program tends to
emphasize one component over the others. Each of the six programs are
independently managed and funded; however, USGS organizes and
integrates the different activities over time and across the Nation to
capitalize upon existing resources. Resources are furthered leveraged
through the collaboration and coordination with a multitude of
federal, state, and local agencies, universities, public interest
groups, and the private sector. Collaboration and coordination also
help to guide and complement USGS scientific efforts and ensure that
USGS information meets the needs of local, state, regional, and
national stakeholders.
National Water-Quality Assessment Program (NAWQA), which began in
1991, focuses on water quality in 42 major river basins and aquifer
systems, referred to as "study units." A
study unit boundary frequently crosses state boundaries and usually
encompasses more than 10,000 square kilometers (about 3,900 square
miles). Collectively the study units include water resources available
to more than 60 percent of the population served by municipal supply
and irrigated agriculture in watersheds that cover about half of the
land areas of the conterminous United States. NAWQA was designed to
answer the questions: "What is the condition of our
streams and ground water? What are the factors affecting the
condition? Is water quality changing over time?" One-third
of all study areas are intensively investigated at any given time for
3 to 4 years, and trends are assessed about every 10 years. For
additional information, see http://water.usgs.gov/nawqa.
The National Water-Quality Assessment (NAWQA) Program assesses
water-quality conditions in 42 major river basins and aquifer systems
across the Nation (http://water.usgs.gov/nawqa).
Toxic Substances Hydrology (TOXICS) Program, which began in 1983,
conducts research and methods development related to contamination
problems that are widespread and pose significant risk to human health
and the environment. The scale of studies is highly variable,
including subsurface point-source studies, such as industrial spills,
leaking fuel storage tanks, and solid waste landfills, and watershed-
and regional-scale studies, such as agricultural chemicals in the
Upper Midwest Corn Belt, hypoxia in the Gulf of Mexico, and effects of
mercury on aquatic ecosystems in the Everglades, Florida. Long-term
research sites and regional- and national-scale monitoring networks
provide a framework for interdisciplinary research teams that include
non-USGS scientists. New methods are developed to make environmental
measurements at low levels and to assess emerging water-quality
issues, such as pharmaceuticals, hormones, and other wastewater
contaminants. Models are developed to predict the transport and fate
of contamination and to evaluate water-quality conditions under
different management scenarios. For additional information, see
http://toxics.usgs.gov.
The Cooperative Water program (COOP), which began in the early
1900's, includes studies in every state,
protectorate and territory of the United States. These studies are
conducted in cooperation with about 1,400 state and local agencies,
which provide at least half of the funding. The studies generally
focus on local (county or multiple counties) and State issues, related
to, for example, development of water quality and biology monitoring
networks, source-identification of contaminants, effects of watershed
development on quality and aquatic life, use of alluvial aquifers as
public water supplies, pathogens and pathogen indicators, effects of
animal feeding operations, and development of models and other
analytical assessment tools. Because USGS water-quality studies
incorporate streamflow measurements, many of the data collected at the
local and State scales in the COOP projects are useful in the
development of Total Maximum Daily Loads (TMDLs) for impaired stream
reaches. For additional information see http://water.usgs.gov/coop.
Hydrologic Benchmark Network (HBN), which began in 1964, is comprised
of stations across the Nation in areas with minimal influence from
human activities. The HBN covers about 55 watersheds, ranging from a
few to 50 square miles. Primary influences on water flow and quality
at HBN sites are atmospheric inputs and the natural geologic
conditions. HBN watersheds are used to assess influences from
atmospheric emissions regulated through the Clean Air Act. For
additional information see http://water.usgs.gov/hbn.
National Stream Quality Accounting Network (NASQAN) was established in
1973. Currently the program measures the flux and transport of
selected compounds in five of the Nation's largest
river basins (ranging from 250,000 to 1,200,000 square miles),
including the Mississippi River, Columbia River, Colorado River, Rio
Grande, and the Yukon. NASQAN data help to identify major source areas
of contaminants and natural constituents, how they are transported and
accumulated downstream, and areas of major deposition within the river
basin. For additional information see http://water.usgs.gov/nasqan.
USGS measures water quality in five of the Nation's
largest river basins through its National Stream Quality Accounting
Network (NASQAN) (http://water.usgs.gov/nasqan).
National Trends Network (NTN), which began in 1983, is part of the
National Atmospheric Deposition Program. The network is operated in
collaboration with more than 100 Federal, State, local, and private
sector organizations. The NTN Program provides regional and national
information on atmospheric deposition on the land surface through the
collection of precipitation samples and analysis for major ions and
nutrients at more than 240 sites. A major benefit of NTN has been
identification of the acidity of atmospheric deposition and changes in
precipitation chemistry as a result of Clean Air Act reductions in the
emission of oxides of nitrogen and sulfur. A sub-network of NTN sites
is used to monitor mercury deposition from precipitation. For
additional information see http://bqs.usgs.gov/acidrain.
USGS Data Are Readily Available
The large USGS database on water-quality conditions and other
information is publicly available and can be readily accessed via the
Internet (http://water.usgs.gov/nwis). It includes chemical data from
rivers, streams, lakes, springs, and ground water from more than
335,000 sites, streamflow data from more than 20,000 sites, and water
levels from more than 1 million wells. Selected field measurements,
such as pH, temperature, and specific conductance, are available in
real-time (updated at intervals of 4 hours or less) at more than 800
USGS sites.
References Cited
Alexander, Richard B., R.A. Smith and G.E. Schwarz, 2000. Effect of
Stream Channel Size on the Delivery of Nitrogen to the Gulf of Mexico.
Nature 403: 758-761.
Goolsby, D.A. and W.A. Battaglin, 2000. Nitrogen in the Mississippi
River Basin—Estimating Sources and Predicting Flux
to the Gulf of Mexico. U.S. Geological Survey Fact Sheet 135-00
(http://ks.water.usgs.gov/Kansas/pubs/fact-sheets/fs.135-00.html).
Rabalais, N.N., R.E. Turner, J. Dubravko, J., Q. Dortsch, and W.J.
Wisman, Jr., 1999, Characterization of
Hypoxia—Topic 1 Report for the Integrated
Assessment on Hypoxia in the Gulf of Mexico: Silver Spring, Md., NOAA
Coastal Ocean Office, NOAA Coastal Ocean Program Decision Analysis
Series No. 17, 167 p.
By Gail E. Mallard and Pixie A. Hamilton
Layout and design by Phillip J. Redman
Visit our Web site at http://water.usgs.gov for
direct access to reports and other interpretive information,
monitoring data, technical reports, and maps.
For additional information, please contact:
Chief, Office of Water Quality Programs, USGS (703)
648-5716 (voice) (703) 648-6693 (fax) nawqa_info@usgs.gov