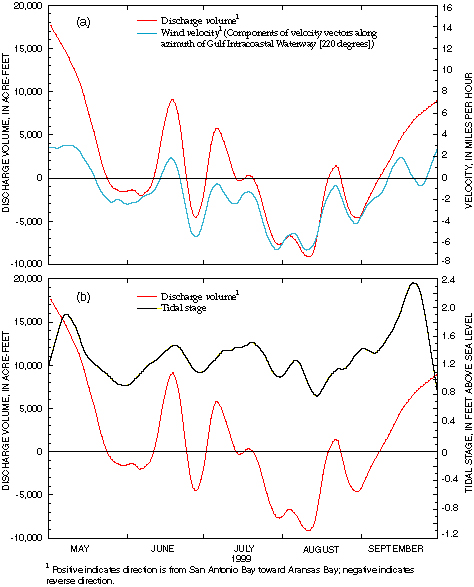
Figure 4. Daily discharge volume between San Antonio Bay and Aransas Bay and (a) wind velocity and (b) Gulf of Mexico tidal stage, May–September 1999. The graphs have been smoothed using the Friedman Supersmoothing technique (MathSoft Inc., 1999).
Back to Text | Contents | Figure 5