Prepared in cooperation with the U.S. FOREST SERVICE
This document also is available in pdf format: ![]() FS 127-02.pdf (2.7MB)
FS 127-02.pdf (2.7MB)
(Requires Adobe
Acrobat Reader)
ABSTRACT
On October 25, 1997, in and around the Routt National Forest and the Mount Zirkel Wilderness Area, a winter snowstorm occurred in conjunction with heavy winds that resulted in the destruction of thousands of acres of old-growth tree stands. The U.S. Geological Survey, in cooperation with the U.S. Forest Service, collected water-quality data at five sites in the North Fork Elk River watershed where most of the blowdown occurred. In this report, these data are used to characterize water quality in areas affected by the blowdown compared to that of relatively undisturbed areas. No difference was detected between loads of the selected constituents from the five water-quality sampling sites.
INTRODUCTION
On October 25, 1997, in and around the Routt National Forest and the Mount Zirkel Wilderness Area, a winter snowstorm occurred in conjunction with heavy winds that resulted in the destruction of thousands of acres of old-growth tree stands (fig. 1). Maximum wind velocities of 120 miles per hour were recorded. This event, typically referred to as a "blowdown," is considered to be an anomaly usually associated with hurricane-force winds. The abundance of old-growth canopy such as Engelmann spruce and sub alpine fir in the region indicates the rarity of this type of event in this area (Snook, 1999).
 |
Figure 1. Water-quality sampling sites and area affected by blowdown in the North Fork Elk River watershed. |
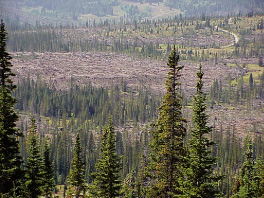
Trees over a large area were uprooted, which disrupted the air-soil interface (fig. 2). As a result, the potential for increased sediment yield and mass wasting increased. Increases in sediment yield have been linked to issues concerning stream and forest habitat, floodwater conveyance, and stream-chemistry imbalance (Elliott and DeFeyter, 1986). Disturbance from salvage logging may increase sediment yield and affect stream chemistry; however, disturbance from salvage logging likely will occur on a smaller scale relative to the disturbance from blowdown.
The U.S. Geological Survey (USGS), in cooperation with the U.S. Forest Service, collected water-quality data at sites in the North Fork Elk River watershed where most of the blowdown occurred. In this report, these data are used to characterize water quality in areas affected by the blowdown compared to that of relatively undisturbed areas.
SITE SELECTION AND DATA COLLECTION
 |
|
Figure 2. Routt National Forest near North Fork Elk River after the blowdown of October 25, 1997. |
Water-quality sampling sites (fig. 1, table 1) were selected to represent undisturbed, disturbed, and salvage-logging zones. Water-quality samples were collected and concurrent streamflow measurements made at each site from March 1999 to August 2000. All water-quality and streamflow data were collected using USGS quality-assurance protocols (Wilde and Radtke, 1998; Rantz and others, 1982). Water-quality samples were analyzed for field parameters, major ions, dissolved nutrients, total phosphorus, total and dissolved metals, suspended sediment, and turbidity. The farthest upstream sampling site, on the North Fork Elk River just upstream from Agnes Creek (site 1), was chosen as a background background site because blowdown was minimal in this subwatershed, and the site is upstream from a salvage-logging area. Site 2 was located on the North Fork Elk River upstream from the confluence with Trail Creek. The watershed for site 1 represents less blowdown than site 2. Both sites are upstream from where salvage logging is done. Igneous and metamorphic rocks underlie the watershed upstream from site 1. The geology that underlies site 1 continues into the watershed of site 2 and includes unconsolidated Pleistocene deposits and, to a limited extent, Mancos Shale (Tweto, 1979). The next two sites are on tributaries of the North Fork Elk River, Lost Dog Creek (site 3) and English Creek (site 4). Sites 3 and 4 were subjected to some of the heaviest blowdown outside of the Mount Zirkel Wilderness Area and represent basins where salvage logging is being done. The underlying geology in these basins is similar to that upstream from site 2 with the addition of some sandstone and limestone (Tweto, 1979). North Fork Elk River above mouth near Clark (site 5) is an integrator site for the entire watershed. Comparison of water-quality information from site 5 with water-quality information from sites 2, 3, and 4 characterizes water quality in the area affected by the blowdown and salvage logging and provides perspective on the water quality of tributary inflows from the west side of the watershed.
|
||||||||||||||||||||||||||||||||||||
DATA SUMMARY
Summary statistics for field parameters, chemical constituents, and physical parameters are listed in table 2. All water-quality and streamflow data collected for this study are published in USGS annual data reports for Colorado (U.S. Geological Survey, 1999 and 2000). The Elk River and tributaries to the Elk River, including streams located within the Mount Zirkel Wilderness Area, are classified as "outstanding waters" by the State of Colorado and carry Aquatic-Use Class 1 and Recreation 1 designations (Colorado Department of Public Health and Environment, 2001).
Physical Parameters
Summary statistics for physical parameters are listed in table 2. These parameters are streamflow, suspended sediment, and turbidity. There are no State standards for suspended sediment or turbidity. However, comparison of suspended-sediment concentrations and turbidity between sites would indicate if there were any differences upstream from the major disturbance areas as compared to those measured downstream near the mouth of the North Fork Elk River. Suspended-sediment concentrations at site 1 ranged from less than 1 to 10 milligrams per liter and median concentration was 2.5 milligrams per liter. Suspended- sediment concentrations at site 5 ranged from less than 1 to 21 milligrams per liter and median concentration was 2 milligrams per liter. Ranges of concentration and median concentrations for suspended sediment were similar at sites 2, 3, and 4. The similarity of suspended-sediment concentrations between sites upstream and downstream from the areas in the watershed affected by the blowdown indicates that there was no measurable effect of the blowdown on suspended-sediment concentrations. Turbidity values measured at sites 1 through 5 also were similar.
Field Parameters
Field measurements were for dissolved oxygen, pH, specific conductance, and water temperature. Comparisons of summary statistics for each parameter at individual sites are listed in table 2. These data indicate that all values of dissolved oxygen or pH were in compliance with State instream standards. The State of Colorado Department of Public Health and Environment does not set standards for specific conductance or temperature for the North Fork Elk River watershed. Comparisons of the median specific-conductance values and water temperature values from the primarily undisturbed area (site 1) to those measured near the mouth of the North Fork Elk River downstream from watersheds that contained areas of blowdown (site 5) indicate that specific conductance and water temperature are similar at all sites.
Chemical Constituents
Chemical constituents such as major ions, nutrients, and trace elements can originate from a variety of sources. The ways in which solutes occur in natural waters are influenced by many environmental factors, especially climate, underlying geology, and biochemical effects associated with life cycles of plants and animals (Hem, 1985). Because there is minimal human impact on the watershed of the North Fork Elk River, water-quality constituents are derived primarily from natural sources.
Except for dissolved solids and aluminum, chemical constituents listed in table 2 have instream standards set by the State of Colorado. All constituents sampled at all sites had concentrations less than the instream standard. Based on the comparison of median concentrations for constituents listed in table 2, water quality among sites is similar. For example, at sites 1 through 5, median concentrations of total phosphorus ranged from less than 0.004 to 0.007 milligram per liter.
LOADING SOURCES
Constituent concentrations and field-parameter values were similar among all sampling sites; however, constituent loading (the product of streamflow, constituent concentration, and a coefficient) could be affected by surface disturbance associated with the blowdown in a particular subbasin. To evaluate constituent loading among the five sampling sites, constituent loading per square mile was calculated for selected constituents at each site to determine if any particular subbasin contributed more loading per unit area than other subbasins. Median constituent loads per square mile for dissolved nitrite plus nitrate, total phosphorus, dissolved zinc, dissolved solids, and suspended sediment were computed (table 3).
|
||||||||||||||||||||||||||||||||||||||||||||||||||||||
Because constituent concentration among sites is a function of runoff and drainage-basin area, analysis of loading between sites may be useful. Except for nitrite plus nitrate and dissolved zinc, Lost Dog Creek (site 3) had the largest median load for the selected constituents. Median dissolved nitrite plus nitrate and dissolved zinc loads decreased from upstream to downstream on the main stem of the North Fork Elk River (sites 1, 2, and 5, table 3).
Loads for dissolved nitrite plus nitrate, total phosphorus, dissolved zinc, dissolved solids, and suspended sediment for the five water-quality sampling sites were compared using analysis of variance (ANOVA) (SPSS Inc., 1997). For the purpose of this analysis the data were ranked, and ANOVA was done on the ranks of the data (Conover and Iman, 1981). The grouped means of ranked data for the selected constituent loads among the five sites were not significantly different (p > 0.05). The study shows that there was no difference between loads of the selected constituents from the five water-quality sampling sites; therefore, the conclusion can be made that constituent loads from watersheds with large areas of blowdown and where salvage logging occurred were not different from loads in areas where minimal blowdown and no salvage logging occurred.
References Cited
Colorado Department of Public Health and Environment, 2001, Classifications and numeric standards for Upper Colorado River Basin and North Platte River: Water Quality Control Commission, Regulation Number 33, 84 p.
Conover, W.J., and Iman, R.L., 1981, Rank transformations as a bridge between parametric and non-parametric statistics: The American Statistician, v. 35, no. 3, p. 124–129.
Elliott, J.G., and DeFeyter, K.L., 1986, Sediment-data sources and estimated annual suspended-sediment loads: U.S. Geological Survey Water-Resources Investigations Report 86–4344, 147 p.
Hem, J.D., 1985, Study and interpretation of the chemical characteristics of natural water: (3d ed.): U.S. Geological Survey Water-Supply Paper 2254, 263 p.
Rantz, S.E., and others, 1982, Measurement and computation of streamflow –Volume 1, measurement of stage and discharge: Volume 2, Computation of discharge: U.S. Geological Survey Water-Supply Paper 2175, 631 p.
Snook, J.S., 1999, The 1997 Rocky Mountain Forest blowdown event: February 1999, Forecast System Laboratory Forum, Web site URL: https://www.fsl.noaa.gov/~vondaust/f299/ f399a.html accessed January 2001.
SPSS Inc., 1997, SYSTAT 7.0-Statistics: Chicago, User's guide, 751 p.
Tweto, Ogden, comp., 1979, Geologic map of Colorado: U.S. Geological Survey State Geological map, scale 1:500,000 (reprinted).
U.S. Geological Survey,19992000, Water resources data, Colorado water years 19992000, v. 2, Colorado River Basin: U.S. Geological Survey Water-Data Reports CO992 through CO002.
Wilde, F.D., and Radtke, D.B., 1998, National field manual for collection of water-quality data: U.S. Geological Survey Techniques of Water-Resources Investigations, book 9, chap. A6, variously paged.
-Kenneth J. Leib and Paul von Guerard
For more information about this study, write to:
Subdistrict Chief
764 Horizon Drive
Room 125
Grand Junction, CO 81506
email: kjleib@usgs.gov
email: pbvongue@usgs.gov
| AccessibilityFOIAPrivacyPolicies and Notices | |
 |
|