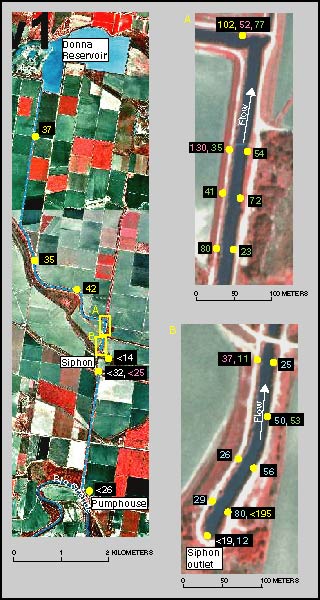
Figure 2. Aerial photographs of the Donna Canal (indicated by the dashed blue line), sampling sites, and concentrations detected. Flow is to the north from the pumphouse toward the reservoir. To the right are enlarged images of two areas of the canal chosen for more closely spaced sampling. Sampling sites are indicated with yellow dots, and results of samples collected during the same sampling trip are shown in the same color: white (February 1999), yellow (July 1999), pink (January 2000), blue (July 2000), and green (April 2001). All concentrations are in micrograms per kilogram of sediment collected.