
U.S. Geological Survey
Fact Sheet 039-02
Online Version 1.0
The Sea-Floor Mapping Facility at the U.S. Geological Survey
Woods Hole Field Center, Woods Hole, Massachusetts
By
Rebecca E. Deusser, William C. Schwab, and Jane F. Denny
Introduction
Researchers of the sea-floor mapping facility at the U.S. Geological Survey (USGS) Woods Hole Field Center in Woods Hole, Mass., use state-of-the-art technology to produce accurate geologic maps of the sea floor (figs. 1, 2). In addition to basic bathymetry and morphology, sea-floor maps may contain information about the distribution of sand resources, patterns of coastal erosion, pathways of pollutant transport, and geologic controls on marine biological habitats. The maps may also show areas of human impacts, such as disturbance by bottom fishing and pollution caused by offshore waste disposal. The maps provide a framework for scientific research and provide critical information to decisionmakers who oversee resources in the coastal ocean.
|
|
|
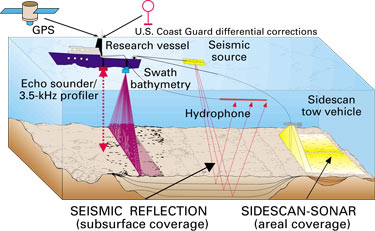
Figure 1. The U.S. Geological Survey collects data from a research vessel for mapping the sea floor and its underlying geology. Differential Global Positioning Systems (DGPS) guide the vessel and equipment positions. A single-beam echo sounder measures water depth and provides a continuous profile of the sea floor below the vessel. A 3.5-kHz profiler sends and receives sound pulses that penetrate about 5-10 meters into the sea floor (figs. 1, 2). An interferometric bathymetric swath sonar system measures water depth and the intensity of sound reflected from the sea floor; the hull-mounted transducer sends out a fan of sound, which is reflected from the sea floor and received at the transducer. In high-resolution seismic-reflection profiling, a towed sound source transmits acoustic pulses that are reflected off the sea floor and the layers beneath. Towed hydrophones (shown at left) or hydrophones built into the sound source receive the returned signal. Sidescan-sonar systems map the intensity of sound reflected from the sea floor on either side of a towed vehicle that emits a fan of sound. The reflections provide an image of the sea floor and information on sediment types.
|
|
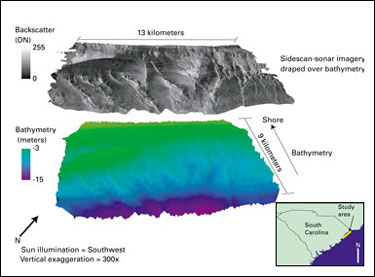
Figure 2. Three-dimensional perspective images of the sea floor off Myrtle Beach, S.C. These images were produced onboard a research vessel as part of an ongoing investigation of coastal erosion hazards. The color image shows bathymetry derived from an interferometric bathymetric sonar system. The black-and-white image combines sidescan-sonar data with the bathymetric data to help researchers visualize the distribution of sediment types and sea-floor features. Backscatter, represented as a digital number (DN), displays the intensity of sound reflected from the sea floor. High backscatter (strong reflections, generally from rock or coarse sand) is displayed as light-gray tones; low backscatter (weak reflections, generally from fine sand or mud) is displayed as dark-gray tones.
|
|
|
|
The strength of the USGS mapping capability is in using advanced technology to streamline at-sea operations and integrate all newly acquired data in the field. Data processing, archiving, and initial interpretations are now completed at sea, thus saving time and money during the research effort and eliminating costly and time-consuming postcruise editing. As a result, usable map products are provided to scientists and decisionmakers at the end of a fieldwork effort rather than weeks or months later.
Sea-Floor Mapping Facility
Researchers of the sea-floor mapping facility develop and apply modern acoustic and optical remote-sensing techniques to acquire detailed geologic information about the sea floor. The sea-floor mapping group is headed by a research geophysicist and is staffed by eight geologists and five field engineers who carry out data acquisition and processing and generate interpretive products. The facility maintains a range of equipment appropriate for mapping in either shallow coastal water or the deep ocean. At present, most mapping is conducted in water depths less than 100 meters.
Data-Acquisition Capability
Sea-floor mapping involves using acoustic and optical systems to remotely acquire information about the topography, composition, and structure of the sea floor. Differential Global Positioning Systems (DGPS) are used to navigate the research vessel and acquisition equipment.
Data-acquisition systems include the following:
- Sidescan-sonar systems (fig. 1), which map the intensity of sound (backscatter) reflected from the sea floor, providing images of sea-floor features and information about sea-floor sediments. Typical survey swath widths range from a few hundred meters in shallow water to several kilometers in deep water. The USGS sea-floor mapping facility currently operates two sidescan-sonar systems: a swept-frequency (CHIRP) sidescan sonar (100-120 kilohertz, kHz) and a dual-frequency sidescan sonar (100/500 kHz).
- Multibeam echo sounder and interferometric bathymetric swath sonar systems, which measure water depth and the intensity of sound reflected from the sea floor. Combining bathymetric data with backscatter intensity allows scientists to visualize the sea floor in great detail (fig. 2). The USGS sea-floor mapping facility currently operates single-beam echo sounders (200 kHz) and an interferometric bathymetric swath sonar (234 kHz). Multibeam echo sounders of various frequencies are utilized through cooperative studies.
- Seismic-reflection systems, which help to determine sediment thickness and composition by sending acoustic energy into the sea floor. Depth of penetration and resolution depend on both the strength and frequency of the sound source. Equipment used for these tasks includes a 3.5-kHz profiler, a swept-frequency (CHIRP) seismic-reflection system (2-7 kHz), a boomer seismic-reflection system (300 Hz-3 kHz), and a 15-cubic-inch watergun seismic-reflection system (20 Hz-1.5 kHz).
After data are acquired remotely, scientists sample the sea floor to "ground-truth" the geophysical data. The USGS sea-floor mapping facility in Woods Hole uses the SEABed Observation and Sampling System (SEABOSS) and other equipment to obtain sediment samples, still photographs, and video images of the sea floor. More information is online at https://pubs.usgs.gov/factsheet/fs142-00/.
Data-Processing Capability
Software systems are used to decode, process, edit, display, archive, and analyze data both at sea and on shore. Sidescan-sonar, seismic-reflection, and bathymetric data are processed as they are collected onboard ship. Data are displayed in real time to check data quality and to ensure complete coverage of the sea floor.
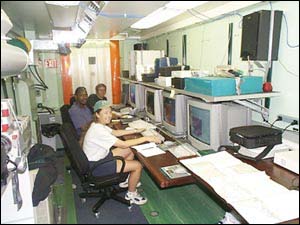
The data-acquisition and data-processing equipment can be mobilized and deployed (typically in a day or less) on a variety of research vessels. On larger vessels, two self-contained vans (8 by 20 feet) provide space for data-acquisition and data-processing computers (fig. 3). Space on small boats commonly limits the at-sea work to data acquisition (fig. 4); processing systems are set up on land, and data are exchanged at the end of each workday. Mapping operations are usually carried out during day trips on smaller boats (less than 50 feet long); larger vessels allow 24-hour operations.
|
|
|
Figure 3. USGS scientists work at sea inside a self-contained data-processing van, which can fit on larger vessels. Photograph by Chris Polloni, USGS, 1999.
|
|
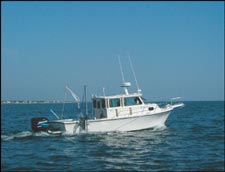
Figure 4. Small vessels are used to map the geology of the sea floor in shallow water near the coast. Sea-floor mapping systems are either rigidly mounted to the vessel, as shown above, or towed behind the vessel on a conducting cable. Photograph by Dann Blackwood, USGS, 2000.
|
|
|
|
Archive Capability
Sidescan-sonar, seismic-reflection, bathymetric, and navigation raw data from each research cruise are archived at sea on compact discs (CD-ROM and DVD-ROM). At-sea interpretations of these data are generally stored within a geographic information system (GIS) and distributed to principal investigators and collaborators. Paper copies of preliminary results are printed onboard by using large-format plotters.
For more information, please contact:
William C. Schwab
(e-mail: bschwab@usgs.gov)
or
William W. Danforth
(e-mail: bdanforth@usgs.gov)
U.S. Geological Survey
384 Woods Hole Road
Woods Hole, MA 02543-1598
Telephone: 508-548-8700
Fax: 508-457-2309
Web site: http://woodshole.er.usgs.gov/
Return to INDEX PAGE
U.S. Department of the Interior, U.S. Geological Survey
URL: https://pubsdata.usgs.gov/pubs/fs/fs039-02/fs039-02.html
For more information, contact William C. Schwab or William W. Danforth
Maintained by Eastern Publications Group
Last modified: 17:51:32 Tue 29 Nov 2016
Privacy statement | General disclaimer | Accessibility