Satellite Interferometric Synthetic Aperture Radar (InSAR) is a revolutionary technique that allows scientists to measure and map changes on the Earth's surface as small as a few millimeters. By bouncing radar signals off the ground surface from the same point in space but at different times, the radar satellite can measure the change in distance between the satellite and ground (range change) as the land surface uplifts or subsides. Maps of relative ground-surface change (interferograms) are constructed from the InSAR data to help scientists understand how ground-water pumping, hydrocarbon production, or other human activities cause the land surface to uplift or subside. Interferograms developed by the USGS for study areas in California, Nevada, and Texas are used in this Fact Sheet to demonstrate some of the applications of InSAR to assess human-induced land deformation. |
 |
 |
 |
 |
 |
 |
|
Los Angeles, California.
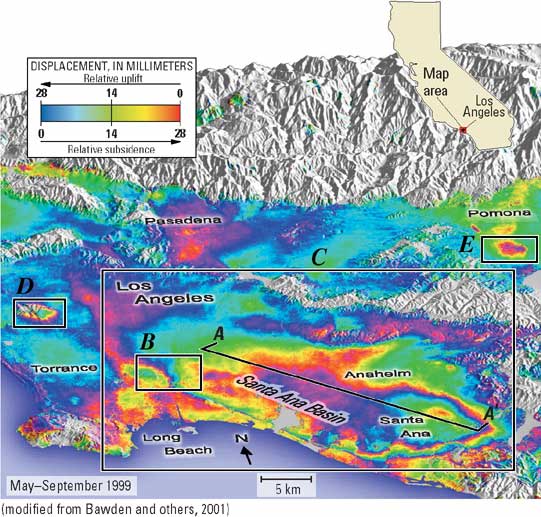
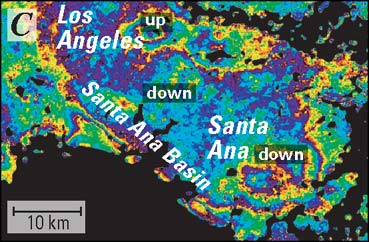
Terrain and InSAR image of Los Angeles and Santa Ana Basin shown as a location map for InSAR images B, C, D, E, and graph, A. |
Seasonal Deformation.
Widespread ground-water pumping in the summer produces large (about 60 mm) seasonal fluctuations in the land-surface elevation with 20 mm of net annual subsidence (April 1998 to May 1999). |
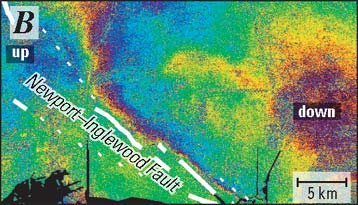
Ground-Water Barriers.
Faults and geologic structures often impede the flow of ground water and can be recognized as linear InSAR features where ground-water levels decline on one side of the fault or rise on the other side of the fault. |
Multi-Year Subsidence. As water levels decline near Santa Ana, the land surface subsides at a rate of about 20 mm per year (Oct. 1993–Oct. 1998). |
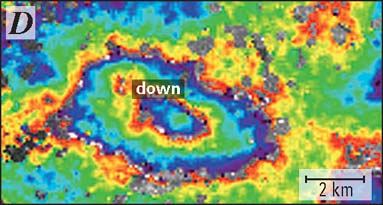
Hydrocarbon Production.
The pumping of oil is often imaged as a "bull's-eye" feature, such as the 58 mm of subsidence measured in the Beverly Hills Oil Field (5 years: Oct. 1993–Oct. 1998). |
Localized Subsidence.
More than 180 mm of ground-water-pumping induced subsidence (1993–95) resulted in cracked building foundations near Pomona. |
InSAR provides invaluable spatial information needed to assess and mitigate human-induced subsidence.
In metropolitan Los Angeles, InSAR imagery found wide-spread seasonal and annual human-induced surface deformation related to both ground-water and hydrocarbon production. The largest feature in the May–September 1999 interferogram (center) is the 40-km (kilometer) long Santa Ana Basin. Ground-water pumping and artificial recharge are producing as much as 60 mm (millimeter) of seasonal uplift and subsidence with 20 mm of net basin subsidence (April 1998–May 1999) (Fig. A). The Newport-Inglewood Fault bounds the southwest margin of the Santa Ana Basin; InSAR shows that there is about a 2-km offset between the mapped trace of the fault and the subsurface ground-water barrier (Fig. B). Many of the deformation features are long lasting (Fig. C) and can exhibit significant surface deformation as shown by the examples of hydrocarbon production in Beverly Hills (Fig. D) and property damage near Pomona (Fig. E). Additionally, the human-induced land deformation produces horizontal surface motion that obscures, and in some cases mimics, the tectonic signals expected from the blind thrust faults beneath Los Angeles (Bawden and others, 2001).
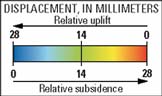
How to read an interferogram: |
1. Count the number of InSAR fringes between two points on the interferogram, where one fringe is one complete color cycle (i.e. yellow, red, blue, green,
yellow). |
2. Multiply the number of fringes by 28.3 mm (1.1 in). |
3. Determine if the ground moved closer (uplift) or farther away (subsidence) from the satellite
by matching how the colors change between the two points with the InSAR scale bar. (i.e. yellow, red, blue, green shows relative subsidence). |
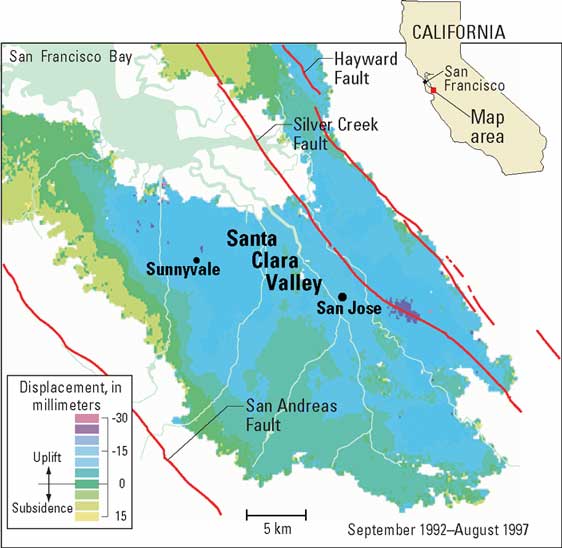
InSAR was used to evaluate seasonal and multi-year deformation patterns, which are critical for implementing appropriate water-management strategies that may include subsidence mitigation. Santa Clara Valley was the first area in the Nation (1940) where land subsidence (nearly 5 m) associated with ground-water withdrawal was recognized. A 5-year interferogram (Sept. 1992–Aug. 1997) shows a small amount (510 mm) of regional uplift. The uplift corresponds to a period of water-level recovery throughout the valley. An 8-month interferogram (Jan.–Aug. 1997) shows seasonal subsidence of about 30 mm near San Jose and corresponds to about a 10-m decline in water levels. The lack of subsidence between 199297 indicates that the seasonal subsidence was temporary (Galloway and others, 1999).
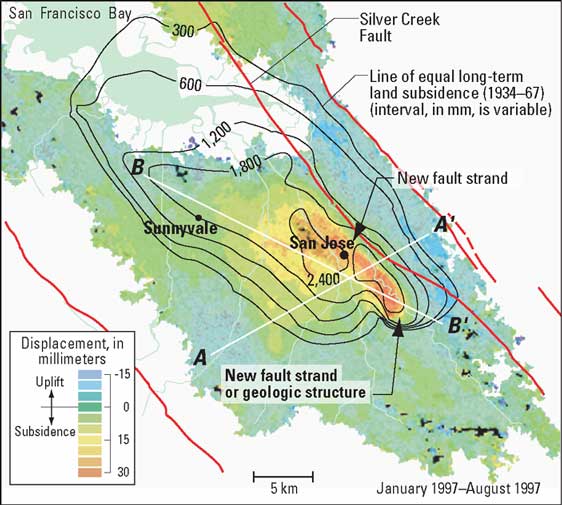
InSAR imagery identified new faults and geologic structures in the Santa Clara Valley. The A–A' cross section on the 8-month interferogram (bottom-right) shows that the location of the steep subsidence gradient is offset about 1 km from the mapped trace of the Silver Creek Fault. The USGS Earthquake Hazards Team conducted a seismic reflection/refraction survey across the InSAR feature and identified it as a previously unrecognized fault (Catchings and others, 2000).
Silicon Valley Subsides. An 8-month interferogram (Jan.–Aug. 1997)
shows seasonal subsidence of about 30 mm near San Jose and corresponds
to about a 10-m decline in water levels. |
Strand5–10 millimeters of multi-year uplift. The lack of subsidence
between 1992–97 indicates that the seasonal subsidence was temporary
(Galloway and others, 1999). |
30 millimeters of seasonal subsidence.
The A–A' cross section on the 8-month
interferogram shows that the location of the steep subsidence gradient
is offset about 1 km from the mapped trace of the Silver Creek Fault. |
The B–B' cross section (right) shows a steep
subsidence gradient in an area where there are no mapped faults, revealing a
previously
unrecognized structure or fault that also acts as a ground-water flow barrier.
Mapping faults and geologic structures in an aquifer system is crucial for understanding
ground-water flow, regional subsidence patterns, and potential seismic hazards.
LAS VEGAS VALLEY, NEVADA
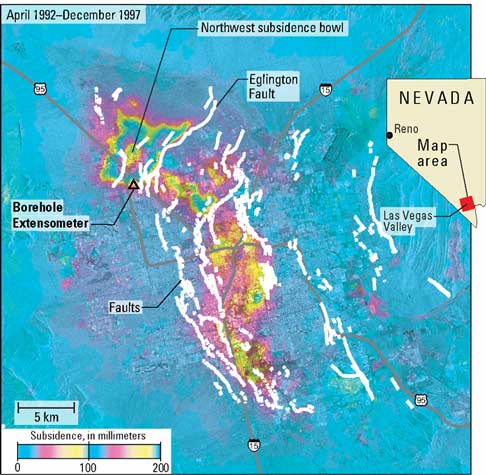
200 millimeters of multi-year subsidence. A 5-year interferogram (Apr.
1992– Dec. 1997) (left) shows the full extent of the aquifer system
and shows 190 mm of localized subsidence in a distinct bowl in the northwest
part of the valley. |
This well in Las Vegas Valley now extends about 2 meters above the land
surface because of subsidence. |
InSAR determined the spatial extent of subsidence and how the subsidence might affect urban development. Las Vegas Valley is one of the fastest growing areas in the Nation. Since the 1950s, ground-water pumping has resulted in water-level declines of more than 100 m. These large water-level declines have resulted in nearly 2 m of subsidence, which has caused fissures and damaged wells. A 5-year interferogram (Apr. 1992– Dec. 1997) shows the full extent of the aquifer system and shows 190 mm of localized subsidence in a distinct bowl in the northwest part of the valley. The southeastern margin of the bowl is structurally controlled by the Eglington Fault.
A borehole extensometer (an instrument to measure aquifer-system compaction) was constructed in 1995 to precisely measure the subsidence. However, interferograms show that the maximum subsidence is located north of the extensometer site. If the InSAR imagery were available prior to extensometer construction, it may have been constructed in the area of maximum subsidence. While extensometers measure subsidence at only one location, InSAR measures subsidence at thousands of points.
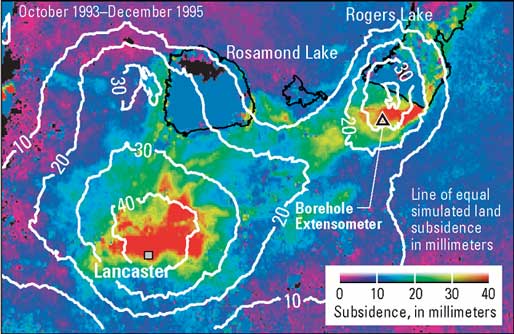
ANTELOPE VALLEY, CALIFORNIA
InSAR and computer model roughly agree...
During 1993–95, InSAR measured about 40 mm of subsidence at an extensometer
site in the Antelope Valley; the extensometer measured 31 mm. |
 |
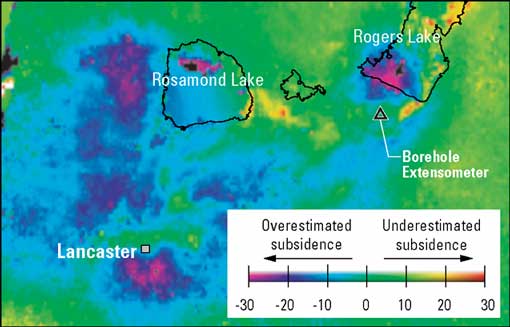
but residuals show added complexities. A residuals image shows that although the computer model simulated the subsidence reasonably well, it overestimated the subsidence in some areas. |
InSAR provides new techniques to calibrate scientific instrumentation and develop sophisticated ground-water models. Extensive pumping in Antelope Valley since the 1940s contributed to nearly 2 m of subsidence in Lancaster and more than 1 m south of Rogers Lake, Edwards Air Force Base. During 1993–95, InSAR measured about 40 mm of subsidence at an extensometer site in the Antelope Valley (upper left); the extensometer measured 31 mm. This disparity indicates that 20% of the subsidence occurred below the maximum depth of the extensometer (256 m). InSAR imagery was also used to evaluate a computer model that simulated land subsidence and ground-water flow. A residuals image (upper right) (InSAR observations subtracted from the modeled subsidence) shows that although the computer model simulated the subsidence reasonably well, it overestimated the subsidence in some areas. These results highlight the potential use of InSAR measurement to better constrain computer models of land subsidence (Galloway and others, 1998; Hoffmann and others, 2003).
 |
 |
 |
 |
Yucca Flat Nuclear Test Site, Nevada. InSAR monitoring shows fault-controlled deformation from the dissipation of residual ground-water pore-fluid pressure changes in response to past underground nuclear weapons testing. |
NW Suburban Houston, Texas. InSAR monitoring shows ground-water subsidence continues to follow historical patterns in the northwest Houston area. |
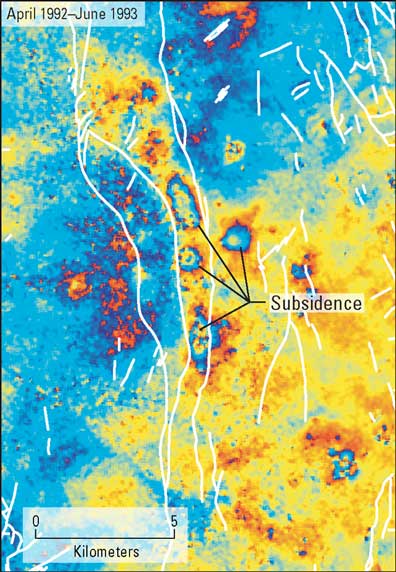
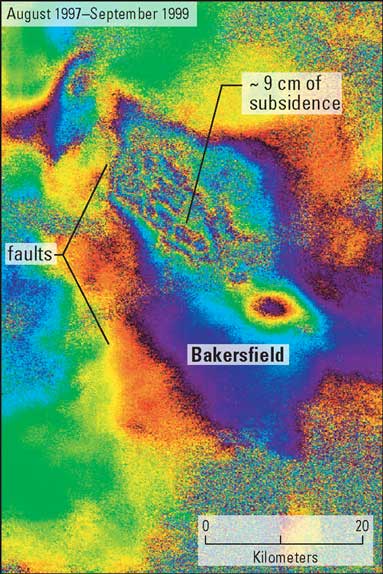
Bakersfield, California. InSAR imagery shows a complex subsidence pattern associated with hydrocarbon extraction north of Bakersfield and shows that faults play a vital role in subsidence. |
InSAR is ideally suited to measure the spatial extent and magnitude of surface deformation associated with fluid extraction and natural hazards (earthquakes, volcanoes, landslides). It is often less expensive than obtaining sparse point measurements from labor-intensive spirit-leveling and Global Positioning System (GPS) surveys and can provide millions of data points in a region about 10,000 square kilometers. By identifying specific areas of deformation within broader regions of interest, InSAR imagery can also be used to better position specialized instrumentation (such as extensometers, GPS networks, and leveling lines) designed to precisely measure and monitor surface deformation over limited areas.
Land subsidence measuring techniques |
| METHOD | Component displacement | Resolution1 (millimeters) | Spatial density2 (samples/survey | Spatial scale (elements) |
|---|---|---|---|---|
| Spirit level | vertical | 0.1-1 | 10-100 | line-network |
| Geoimeter | horizontal | 1 | 10-100 | line-network |
| Borehole extensometer | vertical | 0.01-0.1 | 1-3 | point |
| Horizontal extensometer: | ||||
| Tape | horizontal | 0.3 | 1-10 | line-array |
| Invar wire | horizontal | 0.0001 | 1 | line |
| Quartz tube | horizontal | 0.00001 | 1 | line |
| GPS | vertical horizontal |
20 5 |
10-100 | network |
| InSAR | range | 5-10 | 100,000- 10,000,000 |
map pixel3 |
| 1Measurement resolution attainable under optimum conditions. Values are given in metric units to conform with standard geodetic guidelines. (One inch is equal to 25.4 millimeters and 1 foot is equal to 304.8 millimeters.) 2Number of measurements generally attainable under good conditions to define the spatial extent of land subsi-dence at the scale of the survey. 3A pixel on an InSAR displacement map is typically 30 to 90 square meters on the ground. |
Radar data used to produce the interferograms shown in this fact sheet were obtained from the European Space Agency, distributed through Eurimage Corporation for the purposes of research and development.
- G.W. Bawden, M. Sneed, S.V. Stork, and D.L. Galloway
Amelung, F., Galloway, D.L., Bell, J.W., Zebker, H.A., and Laczniak, R.J., 1999, Sensing the ups and downs of Las Vegas—InSAR reveals structural control of land subsidence and aquifer-system deformation: Geology, v. 27, p. 483486.
Bawden, G.W., Thatcher, W., Stein, R.S., Hudnut, K.W., and Peltzer, G., 2001, Tectonic contraction across Los Angeles after removal of groundwater pumping effects: Nature, v. 412, p. 812815.
Catchings, R.D., Goldman, M.R., Gandhok, G., Rymer, M.J., and Underwood, D.H., 2000, Seismic imaging evidence for faulting across the northwestern projection of the Silver Creek Fault, San Jose, California: U.S. Geological Survey Open File Report 000125, 29 p.
Galloway, D.L., Hudnut, K.W., Ingebritsen, S.E., Phillips, S.P., Peltzer, G., Rogez, F., and Rosen, P.A., 1998, Detection of aquifer system compaction and land subsidence using interferometric synthetic aperture radar, Antelope Valley, Mojave Desert, California: Water Resources Research, v. 34, p. 2,573–2,585.
Galloway, D.L., Jones, D.R., and Ingebritsen, S.E., 1999, Land subsidence in the United States: U.S. Geological Survey Circular 1182, 175 p.
Galloway, D.L., Jones, D.R., and Ingebritsen, S.E., 2000, Measuring land subsidence from space: U.S. Geological Survey Fact Sheet 051–00, 4 p.
Hoffmann, J., Galloway, D.L., Zebker, H.A., 2003, Inverse modeling of interbed storage parameters using land subsidence observations, Antelope Valley, California: Water Resources Research, v. 39, no. 2, SBH 5.
For additional information on InSAR measured surface deformation, please contact:
Gerald Bawden (gbawden@usgs.gov)
U.S. Geological Survey—Placer Hall
6000 J Street
Sacramento, California 95819–6129
Document Accessibility: Adobe Systems Incorporated has information about PDFs and the visually impaired. This information provides tools to help make PDF files accessible. These tools convert Adobe PDF documents into HTML or ASCII text, which then can be read by a number of common screen-reading programs that synthesize text as audible speech. In addition, an accessible version of Acrobat Reader 5.0 for Windows (English only), which contains support for screen readers, is available. These tools and the accessible reader may be obtained free from Adobe at Adobe Access.
Send questions or comments about this report to the author, Gerald Bawden (gbawden@usgs.gov) 916.278.3131.
| AccessibilityFOIAPrivacyPolicies and Notices | |
 |
|