
|

Flooding in Delaware and the Eastern Shore of Maryland From Hurricane Floyd, September 1999
By Anthony J. Tallman and Gary T. Fisher
USGS Fact Sheet FS-073-01
Summary of Flooding
- Record floods as a result of Hurricane Floyd reached 100-year discharge on many streams, and floods on several streams reached the 500-year discharge.
- Major flooding was confined to the central and northern areas of the Delmarva Peninsula.
- Two children in Delaware were swept away and drowned by rapidly rising floodwaters and 7 other people throughout the region were injured as a result of the flooding.
- Property damage reached $14.75 million on the Eastern Shore of Maryland and $8.37 million in Delaware.
Rainfall Data
 Heavy rainfall associated with Hurricane Floyd began early on September 16, 1999, and continued late into the night. The amount of rainfall was highly variable over the region; some areas received more than 10 inches of rain while other areas received only 5 inches or less. Rainfall was heaviest in the central parts of the Eastern Shore of Maryland, with a maximum of 12.59 inches reported at Chestertown, Maryland.
Hurricane Floyd entered the lower half of Maryland’s Eastern Shore and followed a northeasterly track over the lower part of the Delmarva Peninsula (fig. 1). As the storm crossed over the southern end of the Delmarva Peninsula, the heaviest rainfall was on the northwestern side of the storm, where it collided with a stationary front that moved into the area from the northwest. Because of the interaction of the two air masses, the heaviest rainfalls were in New Castle County in Delaware, and Kent, Cecil, and Queen Annes Counties in Maryland.
Peak Streamflows
 Peak-flow data for the storm of September 16-17, 1999, and peak-flow data from the highest previous floods are presented in table 1. Information from active stream-gaging stations and discontinued stations is included in the table, and is listed in downstream order by U.S. Geological Survey (USGS) station number. USGS personnel surveyed high-water marks to determine peak stages for the storm at discontinued stations.
Flood-frequency analysis is a statistical technique that is used to estimate the probability, or chance, that an annual peak-flow value will be equaled or exceeded in any given year. A related statistic, the recurrence interval, is the average period of time between peak flows that are equal to or greater than a specified peak flow. For example, a peak flow that has a 1-percent chance of being equaled or exceeded in any given year will have an estimated recurrence interval of 100 years.
Peak flows in White Clay Creek in New Castle County, Delaware; Unicorn Branch in Queen Annes County, Maryland; Morgan Creek in Kent County, Maryland; and Little Elk Creek and Northeast Creek in Cecil County, Maryland, reached or exceeded calculated 500-year recurrence intervals. Christina River and Red Clay Creek in New Castle County, Delaware, exceeded 100-year recurrence intervals.
Flooding in Delaware
Record flooding in Delaware was confined mainly to the Christina River Basin in northern New Castle County, where most gaged streams reached record levels and discharges. Damage from the storm reached $8.37 million, with $8 million alone in New Castle County as a result of the flooding (National Climatic Data Center, 2001). Two children were swept away and drowned by rapidly rising waters in northern Delaware and two other people in the State were injured. Although heavy rain fell over the entire State, flooding in the south was less severe. Recurrence intervals ranged from greater than 500 years in the northern part of the State to about 2 years in the southernmost areas.
The Christina River Basin, the largest river basin in New Castle County, includes the drainage areas of White Clay Creek, Red Clay Creek, and Brandywine Creek. Discharges during the storm of September 16, 1999, reached peaks up to and exceeding the calculated 500-year recurrence intervals. Peak flows in the Christina River, White Clay Creek, and Red Clay Creek exceeded the highest levels previously recorded for the periods of record at these stations.
Before the peak on September 16, 1999, the highest discharge measured at the Christina River gaging station was 5,530 ft3/s (cubic feet per second) on July 5, 1989, at a recorded stage of 13.12 ft (feet). The peak of September 16 reached a recorded stage of 13.92 ft and a discharge of 7,050 ft3/s, surpassing the 100-year flood discharge of 5,370 ft3/s.
Stages and discharges at the three gaging stations on White Clay Creek also exceeded the highest previously recorded levels. Discharge at the gaging station near Newark reached a peak of 19,600 ft3/s, surpassing the previous record discharge by 8,000 ft3/s. Discharge at the discontinued station above Newark was 16,300 ft3/s, and exceeded the previous record by 6,100 ft3/s. Discharge at Newark reached a peak of 16,700 ft3/s, and was the peak of record; however, the station has been in operation only since 1994.
Stages and discharges in Red Clay Creek also reached record levels as a result of Hurricane Floyd. Peak discharge at Wooddale for the storm reached 7,650 ft3/s, surpassing the 100-year flood discharge. A peak discharge of 8,620 ft3/s was recorded on Red Clay Creek near Stanton, surpassing the previous peak discharge of 5,330 ft3/s. The estimated recurrence interval for the peak at Stanton only exceeded the 25-year flood discharge, because the station has been in operation only since 1988, and statistical computations are less reliable than those from stations that have been operating for longer periods of time.
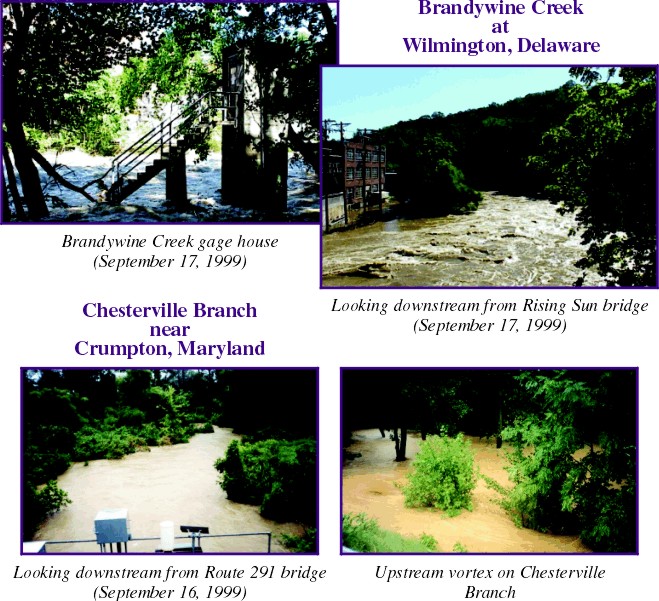
Brandywine Creek at Wilmington reached a peak discharge of 28,700 ft3/s, which is greater than the 50-year flood discharge. The peak discharge of September 1999 was only slightly lower than the record peak of 29,000 ft3/s, which occurred on June 22, 1972, as a result of Tropical Storm Agnes.

Flooding in Maryland
Record flooding associated with Hurricane Floyd was confined mainly to the central and northern parts of the Eastern Shore and northeastern Cecil County. Damage from the storm reached $14.75 million (National Climatic Data Center, 2001) as a result of the flooding. Five people throughout the State were injured as a result of the floodwaters. Flooding was less severe in the southern and extreme northwestern parts of the area.
Elk River Basin, in the northern part of the Eastern Shore of Maryland, includes the drainage areas of Big Elk Creek and Little Elk Creek. Flooding in this river basin reached record or near-record levels as a result of Hurricane Floyd.
Big Elk Creek reached a stage of 14.53 ft, just surpassing the previous recorded peak of 14.50 ft, and the peak discharge was 9,780 ft3/s. The discharge in 1999 was less than the previous peak of record, however, as a result of changes in the stream channel. The recurrence interval of the flood discharge was estimated to be only 30 years, because a flood in 1884 was reported to have reached a peak stage of about 19 ft, with an estimated discharge of about 18,000 ft3/s.
Little Elk Creek near the town of Childs reached a record stage of 11.19 ft, with an associated discharge of 8,700 ft3/s. Flooding in this basin reached the estimated 500-year flood discharge. The previous record flood occurred on August 12, 1955, when the creek reached a stage of 8.37 ft, with an associated discharge of 5,400 ft3/s. Other storm peaks have been observed since the station was discontinued in 1958, but none of those reached the level of the peak in 1955.
Northeast Creek, in the north-central part of Cecil County, also experienced record flows. The peak discharge associated with Hurricane Floyd was 9,000 ft3/s (stage 11.50 ft), surpassing the previous record of 4,800 ft3/s (stage 8.41 ft) that occurred on June 22, 1972, as a result of Tropical Storm Agnes.
Except for Little Elk Creek and Northeast Creek, the flooding in the northwestern part of the upper Eastern Shore was less severe than in the eastern areas, probably because the storm moved along a northeasterly track away from the region. Recurrence intervals ranged from 10 to 30 years.
The Chester River Basin, in the central part of the Eastern Shore of Maryland, includes the drainage areas of Morgan Creek, Unicorn Branch, and Chesterville Branch. Flooding from Hurricane Floyd exceeded the estimated 500-year recurrence interval on Morgan Creek and Unicorn Branch. The recurrence interval on Chesterville Branch was not computed because the gaging station has not been in operation long enough to provide the data needed to produce meaningful statistics.
The flood level on Morgan Creek, located east of Kennedyville, exceeded the stage experienced in 1972, when Tropical Storm Agnes hit the region. The peak stage of September 1999, 15.03 ft, exceeded the previous record of 1972 by almost 2 ft; the calculated peak discharge was 11,200 ft3/s.
The stage of Unicorn Branch, located near Millington, reached a new record level of 9.40 ft, with an associated peak discharge of 2,600 ft3/s. The previous record peak was on December 14, 1996, when the stream reached a stage of 6.09 ft, with an associated peak discharge of 1,160 ft3/s.
Selected References
- Dillow, J.J.A., 1996, Technique for estimating magnitude and frequency of peak flows in Delaware: U.S. Geological Survey Water-Resources Investigations Report 95-4153, 26 p.
- National Climatic Data Center, 2001, Storm data publications, accessed May 21, 2001, on the World Wide Web at URL http://www4.ncdc.noaa.gov/cgi-win/wwcgi.dll?wwEvent~Storms
- Paulachok, G.N., Simmons, R.H., and Tallman, A.J., 1995, Storm and flood of July 5, 1989, in northern New Castle County, Delaware: U.S. Geological Survey Water-Resources Investigations Report 94-4188, 29 p.
- National Oceanic and Atmospheric Administration, 1999, Climatological data, Maryland and Delaware, September 1999: Asheville, North Carolina, U.S. Department of Commerce, National Climatic Data Center, v. 103, no. 9.
- ______ 1999, Climatological Data, New Jersey, September 1999: Asheville, North Carolina, U.S. Department of Commerce, National Climatic Data Center, v. 104, no. 9.
- ______ 1999, Climatological Data, Pennsylvania, September 1999: Asheville, North Carolina, U.S. Department of Commerce, National Climatic Data Center, v. 104, no. 9.
- ______ 2000, Storm Data: Asheville, North Carolina, U.S. Department of Commerce, National Climatic Data Center, v. 41, no. 9
Editor: Valerie M. Gaine
Graphics and design: Timothy W. Auer
Photos: Anthony J. Tallman

For further information contact:
District Chief
Visit the Maryland-Delaware-D.C. District Homepage on the World Wide Web at: Download Fact Sheet FS-073-01 pdf 1.2MB Maintainer: webmaster@md.water.usgs.gov
U.S. Geological Survey
8987 Yellow Brick Road
Baltimore, MD 21237
http://md.water.usgs.gov
