| |  | | | | | | | | Faults & Releveling Surveys |  |
| | | | | | |
|  |
| | |
| | Coincidence of Subsurface and Surface FaultsThroughout the Gulf Coast region there are many deep faults that serve as structural traps for the hydrocarbons. Some of the primary faults that trap hydrocarbons also extend upward to shallow depths near the surface (fig. 1). If the pressure drop in the producing formation is large, faults that are near the threshold of failure may be reactivated, and rocks along them may move. When the fault is active, the land area subsides on the downthrown side of the fault near the fault plane. Depending on the depth and angle of the fault, the induced subsidence may occur several kilometers away from the producing wells (fig. 1) rather than directly above the producing reservoirs (fig. 2). Releveling Surveys Subsidence and fault displacement also can be inferred from benchmark releveling surveys. The elevations of benchmarks in the Gulf Coast region are periodically resurveyed by the National Geodetic Survey. Comparing leveling surveys provides a basis for measuring rates of subsidence for the period between the dates of the surveys. For example, releveling surveys in 1965 and 1982 along Louisiana Highway 1 between Valentine and Leeville, La., showed that subsidence was greater near hydrocarbon-producing fields than between the fields (fig. 5). 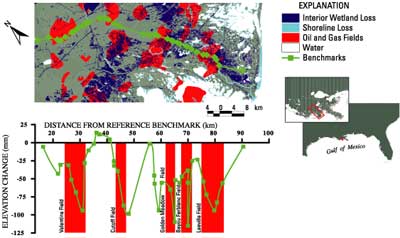 | | Figure 5. Map along Louisiana Highway 1 between Valentine and Leeville, La., showing locations of benchmarks, oil and gas fields, and shoreline and wetland losses and graph showing changes in surface elevation (in millimeters) at the benchmarks between 1965 and 1982. Subsidence was greatest near the oil and gas fields. Wetland losses from Britsch and Dunbar (1993). Elevation changes from National Geodetic Survey data. [larger image] | « Regional Depressurization | Correlations & Rates » |