

| The world-famous Yellowstone geysers and hot springs are fueled by heat released from an enormous reservoir of magma (partially molten rock beneath the ground). Since the 1970s, scientists have tracked rapid uplift and subsidence of the ground and significant changes in hydrothermal (hot water) features and earthquake activity. In 2001, the Yellowstone Volcano Observatory was created by the U.S. Geological Survey (USGS), the University of Utah, and Yellowstone National Park to strengthen scientists' ability to track activity that could result in hazardous seismic, hydrothermal, or volcanic events in the region
|
In the 1970s, a resurvey of benchmarks discovered the unprecedented uplift of the Yellowstone Caldera of more than 28 inches (72 cm) over five decades. More recently, new and revolutionary satellite-based methods for tracking the Earth's shifting ground motions have enabled University of Utah, U.S. Geological Survey, and other scientists to assemble a more precise and detailed picture of Yellowstone's ground movements.
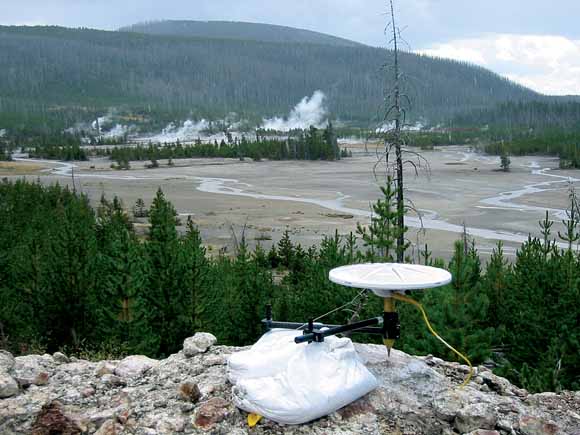 |
| Global Positioning System (GPS) stations like this one in the Norris Geyser Basin can detect changes in elevation and horizontal shifts of 1 inch or less per year, helping scientists understand the processes that drive Yellowstone's active volcanic and earthquake systems. (Photo courtesy of Christine Puskas, University of Utah.) |
No actual volcanic eruption has occurred in the Yellowstone National Park region of Wyoming, Montana, and Idaho since a lava flow poured out about 70,000 years ago. However, the area's many geysers and hot springs indicate that the underlying volcanic system remains active. In the early 1970s, Earth scientists found evidence that this system was more active than even these spectacular hydrothermal (hot water) features had suggested.
One important clue was found along the south shore of Yellowstone Lake, where trees were dying because their trunks were partly below water and a boat dock had become completely submerged. At the same time, the water level at the lake's outlet on its north side appeared little changed.
Scientists reasoned that these observations could be explained by southward tilt of the area around Yellowstone Lake, including the lake basin itself. If the entire area was being pushed up, perhaps the ground at the north end of the lake was rising more than the south end, like a giant bathtub lifted at one end. In this way, the water level of Yellowstone Lake would appear to rise at the south end.
To test this idea, in 1975–77 scientists from the University of Utah and the U.S. Geological Survey (USGS) resurveyed a series of benchmarks along roads throughout Yellowstone National Park. These benchmarks were originally installed and their elevations and locations precisely determined in 1923. The results of the resurvey showed dramatically that the central part of the park had indeed risen. The greatest uplift appeared to be in the area of Le Hardy Rapids on the Yellowstone River, a few miles downstream from the lake's outlet. There the ground had risen 28.5 inches (72 cm) since 1923, raising the nearby north end of Yellowstone Lake much more than the south end. Scientists then focused their attention on what could be causing the ground to rise and whether the uplift was still going on.
Later eruptions of many large lava flows, some as thick as 400 feet (120 m), buried the original caldera floor and most of the caldera walls. Mount Washburn, a prominent landmark in the park, is a section of the caldera rim that escaped burial. The most recent series of eruptions at Yellowstone, 160,000 to 70,000 years ago, covered much of the caldera floor with more than 20 thick lava flows, including the Elephant Back flow, which can be seen west of Fishing Bridge.
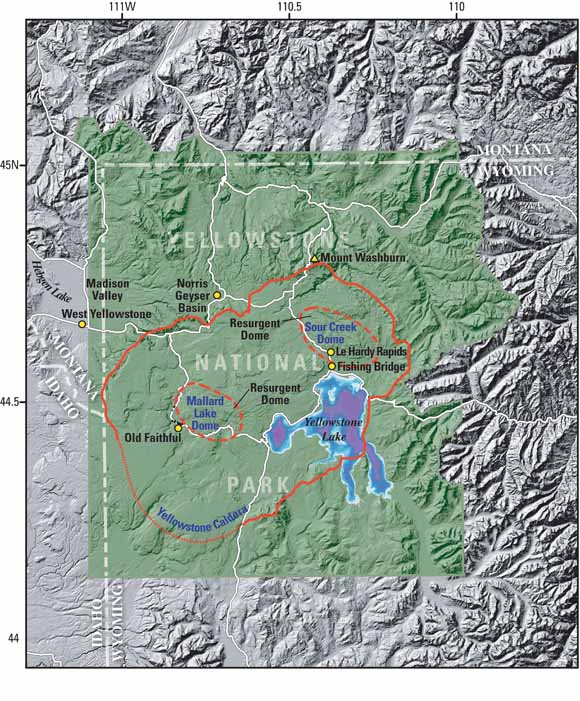 |
| The region of Yellowstone National Park in Wyoming, Montana, and Idaho is famous for its spectacular geysers and extensive hot springs, indications that an underlying volcanic system remains active. The central part of the park is occupied by the great, partly filled depression of the Yellowstone Caldera, formed in a giant volcanic eruption 640,000 years ago that blasted 240 cubic miles (1,000 km3) of molten rock (magma) into the atmosphere-more than 1,000 times the volume erupted at Mount St. Helens in 1980. Later eruptions largely filled the caldera and pushed up two resurgent domes within it—the Sour Creek and Mallard Lake Domes. No actual volcanic eruption has occurred in the Yellowstone region for about 70,000 years. However, since the 1970s, scientists have detected significant changes in this remarkable volcanic and hydrothermal (hot water) system, including rapid ground uplift and subsidence and bursts of earthquake activity. |
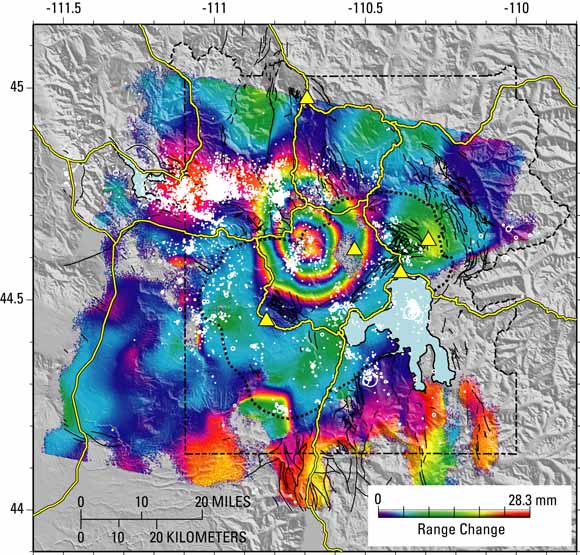 |
| A new satellite-based technique known as Interferometric Synthetic Aperture Radar (InSAR) allows direct and precise measurement of the vertical changes in ground level. This InSAR image of the area around the Yellowstone Caldera (dotted line) shows vertical changes during the 4-year period 1996–2000. The ringed pattern centered northwest of Yellowstone Lake is a prominent area of dome-shaped uplift. Each complete cycle of colors in the color bands represents a little more than one inch (28.3 mm) of vertical change. Yellow triangles are continuous GPS stations; white dots are locations of earthquakes in the period 1996–2000. |
The fact that the uplift documented in the 1970s was centered within the caldera near the resurgent domes seemed to indicate that the magma reservoir was again exerting pressure upward. What could be causing this? Was new magma entering Yellowstone's enormous reservoir from below? Perhaps volcanic gas was escaping from the magma reservoir, percolating upward and causing the surface to bow upward? Perhaps some of Yellowstone's hot water had become trapped beneath the surface, exerting pressure on the caldera floor from below? New volcano-monitoring data soon forced scientists to think again about what was occurring beneath Yellowstone's active caldera.
These new data reveal that Yellowstone is in nearly continuous but frequently changing movement—the floor of the caldera continued to rise until 1984, stopped rising during 1984–85, and then subsided for the next 10 years. Parts of the central caldera began rising again in 1995, but a more complex pattern of uplift and subsidence has prevailed since 2000. InSAR data show that between 1995 and 1997 a large area along the northwest rim of the Yellowstone Caldera, centered near Norris Geyser Basin, started to rise. The picture that emerges from all these data is of a dynamic system in which the caldera floor is in almost constant motion—episodes of uplift and subsidence occur at various locations and over different time scales.
What could cause different areas in and around the caldera to go up and down over such short time intervals? A clue to this mystery, and a further indication that the region remains an active volcanic system, is the frequency and distribution of earthquakes at Yellowstone, one of the most seismically active areas in North America.
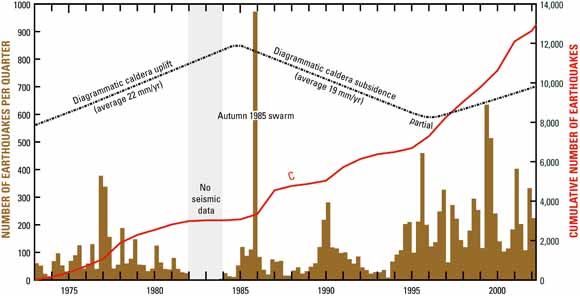 |
| The Yellowstone area is one of the most seismically active parts of the United States, but the frequency of earthquakes varies dramatically and is related to other events in this active volcanic system. Precise measurements of elevation made regularly since the 1970s document the rise and fall (shown diagrammatically here) of the ground surface in the Yellowstone Caldera, thought to be caused by movements of magma (molten rock) or hydrothermal (hot, watery) fluids beneath the surface. The spectacular earthquake swarm of late 1985 may have been caused by the escape of hydrothermal fluids through the impermeable rock layer above the magma reservoir, which also initiated an episode of subsidence in the caldera. |
An early written account of Yellowstone's earthquakes was given by Ferdinand Hayden in 1872, when his survey party was camped on the northeast shore of Yellowstone Lake:
| We were informed by mountain-men that these earthquake shocks are not uncommon, and at some seasons of the year very severe, and this fact is given by the Indians as the reason why they never visit that portion of the country. I have no doubt that if this part of the country should ever be settled and careful observations made, it will be found that earthquake shocks are of very common occurrence. |
To document and monitor this seismic activity, the USGS installed a permanent network of instruments in 1973. University of Utah and USGS scientists have since pinpointed the locations of thousands of earthquakes in the Yellowstone region. Most are small (magnitude less than 3), shallow quakes that sometimes occur in swarms lasting days to weeks or longer. Swarms have been located both within the caldera and between the caldera and the rupture zone of the Hebgen Lake earthquake to the northwest. Although many earthquakes are associated with known active faults or former sites of volcanic eruptions (vents), some are not.
A new analysis by University of Utah scientists of the 1985 swarm shows that during the first month the locations of earthquakes moved to the northwest, away from the rim of the Yellowstone Caldera, along a narrow zone at an average rate of 500 feet (150 m) per day. For the rest of the swarm, into the following year, the earthquake locations grew systematically deeper, from less than 2 miles (3 km) to more than 5 miles (8 km) deep, at an average rate of about 80 feet (25 m) per day. This intense earthquake swarm generally coincided in time with the 1985–86 reversal of ground movement in the central part of the caldera-from uplift to subsidence. Was there a common trigger for both sets of events?
A likely cause of the 1985 earthquake swarm, according to scientists, was the rupture of a widespread layer of impermeable rock (through which fluids cannot pass) above the magma reservoir. The rupture of this rock layer allowed pressurized hydrothermal fluids (hot watery solutions) to move upward and laterally out of the caldera and into an adjacent network of fractures over a period of many weeks. As the fluids pushed through this network, cracks were opened and adjacent rocks were broken, resulting in several thousand small quakes. At the same time, according to this model, the lateral escape of fluids through the impermeable layer dramatically decreased the upward pressure normally exerted by the hydrothermal system beneath the caldera, resulting in subsidence there.
Another earthquake swarm occurred at Yellowstone in 1995. Because this swarm was not accompanied by caldera subsidence but rather by the latest period of caldera uplift, it has led scientists to ponder other possible models that link magma intrusion, hydrothermal fluid migration, and uplift of the caldera.
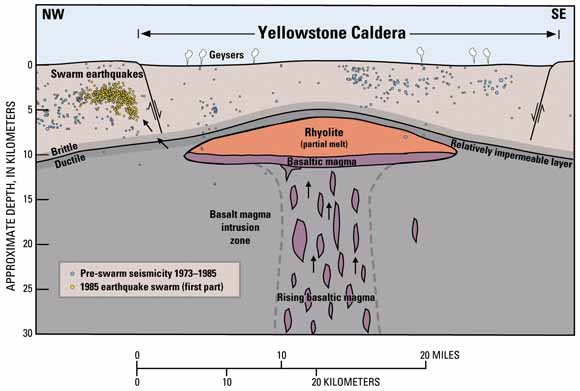 |
| Volcanic and hydrothermal activity in the Yellowstone area is fueled by a large reservoir of magma (partially molten rock) beneath a caldera (volcanic depression) that formed in a cataclysmic eruption 640,000 years ago. The magma reservoir includes both rhyolitic magma, rich in silica (SiO2), and basaltic magma, which contains less SiO2 and is denser. Capping the magma reservoir is a zone of hot, ductile rock that can slowly flow to close any fractures and is therefore relatively impermeable (meaning that fluids cannot easily pass through). The cooler rock above behaves in a more brittle manner and can be readily fractured. Sometimes the impermeable rock can be ruptured, allowing hot, salty fluids to escape upward and laterally, moving through cracks in brittle rock. As shown in this diagram, such a fluid release in 1985 is thought to have triggered a large swarm of earthquakes just northwest of the caldera. |
Future monitoring at Yellowstone will seek answers to questions such as these:
Coordination of scientists' efforts by the Yellowstone Volcanic Observatory will lead to better understanding of the region's remarkable volcanic and hydrothermal system and ultimately to a greater ability to predict potentially hazardous events. This work at Yellowstone is only part of the ongoing efforts by the USGS Volcano Hazards Program to protect people's lives and property in all of the volcanic regions of the United States, including the Pacific Northwest, California, Alaska, and Hawaii.
|
Increased scientific surveillance of Yellowstone in the past 30 years has detected unmistakable changes in its vast underground volcanic system, similar to historical changes observed at many other large calderas (volcanic depressions) in the world. To strengthen the capabilities of scientists to track and respond to changes in Yellowstone's activity, a fifth U.S. volcano observatory was created in 2001, complementing existing ones for Hawaii, Alaska, the Cascades, and Long Valley, California. The Yellowstone Volcano Observatory (YVO) is supported jointly by the U.S. Geological Survey, the University of Utah, and Yellowstone National Park.
The principal goals of YVO include: |
 |
By
Steven R. Brantley, Jacob B. Lowenstern, Robert L. Christiansen, Robert B. Smith, Henry Heasler, Greg Waite, and Charles Wicks
Edited by Peter H. Stauffer
Graphic design by Sara Boore and Susan Mayfield
Banner design by Bobbie Myers
COOPERATING ORGANIZATIONS
Yellowstone National Park
University of Utah
For questions about the content of this report, contact Steve Brantley
For more information contact:
U.S. Geological Survey
(650) 329–5227
http://volcanoes.usgs.gov/yvo
or
Yellowstone National Park
http://www.nps.gov/yell/home.htm
PDF version of this fact sheet (2.1 MB)
Download a copy of Acrobat Reader version 5.0 for free
| Help | PDF help | Western Publications main page | Western Fact Sheets |
| Department of the Interior
| Privacy Statement | Disclaimer
| Accessibility |
URL of this page: https://pubs.usgs.gov/fs/fs100-03/
Maintained by: Michael Diggles
Created: June 22, 2004
Last modified: January 19, 2006 (mfd)