Publications—Fact-Sheet 104–00
By Kernell G. Ries III and Peter A. Steeves of the U.S. Geological Survey; Aleda Freeman, of MassGIS; Raj Singh, of Syncline, Inc.
U.S. Geological Survey Fact-Sheet 104–00
This publication is available in Portable Document Format (PDF):
FS 104–00 (744 KB) – 4
pages
A World Wide Web application has been developed to make it easy to obtain streamflow statistics for user-selected locations on Massachusetts streams. The Web application, named STREAMSTATS (available at http://water.usgs.gov/osw/streamstats/massachusetts.html ), can provide peak-flow frequency, low-flow frequency, and flow-duration statistics for most streams in Massachusetts. These statistics describe the magnitude (how much), frequency (how often), and duration (how long) of flow in a stream.
The U.S. Geological Survey (USGS) has published streamflow statistics, such as the 100-year peak flow, the 7-day, 10-year low flow, and flow-duration statistics, for its data-collection stations in numerous reports. Federal, State, and local agencies need these statistics to plan and manage use of water resources and to regulate activities in and around streams. Engineering and environmental consulting firms, utilities, industry, and others use the statistics to design and operate water-supply systems, hydropower facilities, industrial facilities, wastewater treatment facilities, and roads, bridges, and other structures. Until now, streamflow statistics for data-collection stations have often been difficult to obtain because they are scattered among many reports, some of which are not readily available to the public. In addition, streamflow statistics are often needed for locations where no data are available. STREAMSTATS helps solve these problems.
 (100kb)
Figure 1. View of the STREAMSTATS-user interface at start up with the map window showing town boundaries and data-collection stations in Massachusetts.
STREAMSTATS was developed jointly by the USGS and MassGIS, the State Geographic Information Systems (GIS) agency, in cooperation with the Massachusetts Departments of Environmental Management and Environmental Protection. The application consists of three major components: (1) a user interface that displays maps and allows users to select stream locations for which they want streamflow statistics (fig. 1), (2) a data base of previously published streamflow statistics and descriptive information for 725 USGS data-collection stations, and (3) an automated procedure that determines characteristics of the land-surface area (basin) that drains to the stream and inserts those characteristics into equations that estimate the streamflow statistics. Each of these components is described and guidance for using STREAMSTATS is provided below.
STREAMFLOW STATISTICS FOR DATA-COLLECTION STATIONS. The USGS operates or has operated four types of streamflow-data-collection stations in Massachusetts: (1) continuous-record stations, (2) peak-flow partial-record stations, (3) low-flow partial-record stations, and (4) miscellaneous-measurement stations. A network of 74 streamgaging stations is currently (2000) operated in the State. Continuous records of streamflow of various length are available for these stations and for 79 streamgaging stations that were previously operated. Networks of peak-flow and low-flow partial-record stations were previously operated throughout the State, although none are currently in operation. Streamflow and water-level measurements were obtained occasionally over a period of years at the partial-record stations to determine either peak- or low-flow statistics for those stations. Streamflow data also have been collected at hundreds of miscellaneous-measurement stations. These stations were operated primarily for specific hydrologic studies with various objectives. All streamflow data collected by the USGS in Massachusetts are stored in the USGS National Water Information System (NWIS) data base. This data base also contains descriptive information for each data-collection station. Data from NWIS were used to determine streamflow statistics for the 725 stations included in the STREAMSTATS database. Many other stations are not in the STREAMSTATS database, either because not enough data were available to accurately compute the statistics, or the flows were affected by human activities.
The STREAMSTATS data base is much smaller and faster to operate over the Web than the NWIS data base. Descriptive information was loaded from NWIS into the STREAMSTATS data base for all stations. Descriptive information includes USGS station identification number, station name, station type, period of record, latitude and longitude, hydrologic unit code, major drainage basin name, directions to locate the station, and remarks indicating effects of human activities on the flow or other pertinent information about the station. Basin characteristics and streamflow statistics were entered into the STREAMSTATS data base for all stations for which these data were available. Available basin characteristics include drainage-basin area (the land surface-area that contributes streamflow to the location), area of stratified drift (coarse-grained sand and gravel areas where aquifers are usually located), area of water bodies (lakes, ponds, and wide streams), and area of wetlands, all in square miles; total length of streams, in miles; mean basin slope, in percent; and minimum, mean, and maximum basin elevations, in feet. Available peak-flow frequency statistics include the mean annual flood, and the 10-, 25-, 50-, 100-, and 500-year recurrence interval floods. Available low-flow frequency statistics include the 7-day, 2-year and the 7-day, 10-year recurrence interval low flows. Available flow-duration statistics include streamflows at selected durations exceeded between 99 and 1 percent of the time, and the August median streamflow. Definitions of these statistics are provided in the Web page for the application.
Not all of the streamflow statistics are available for all sites. Only peak-flow frequency statistics are likely to be available for peak-flow partial-record stations, whereas only low-flow frequency and low-flow duration statistics are likely to be available for low-flow partial-record stations. Streamgaging stations may have all available statistics or only a portion of them. Miscellaneous-measurement stations may have any of the statistics, but most of them have only low-flow statistics; thus most of these stations have been grouped with the low-flow partial-record stations in the database. In addition, many stations have few or no basin characteristics available. All statistics for the stations in the STREAMSTATS database were published previously in USGS reports, and the methods used to determine the statistics are described in those reports. Citations are provided along with each streamflow statistic served.
STREAMFLOW STATISTICS FOR LOCATIONS WHERE NO DATA ARE AVAILABLE. The USGS has developed equations that can be used to estimate various streamflow statistics for locations on Massachusetts streams where no data are available (Ries and Friesz, 2000). The equations were derived by regression analysis, which statistically relates the streamflow statistics for a group of data-collection stations to physical characteristics of the drainage basins for the stations. Physical characteristics for a site where no data are available can be measured and inserted into the regression equations to obtain estimates of the streamflow statistics for the site.
Regression analysis has been used to develop equations for estimating streamflow statistics in many other areas; however, use of the equations has been limited because measuring the physical characteristics needed to solve the equations has been difficult and time-consuming, and the equations are complex for some users. Historically, most physical characteristics were measured by hand from various maps. This process could take from several hours to days to complete for a single site. In addition, many of the maps were not widely circulated, and many potential users did not possess the equipment or expertise necessary to measure the values from the maps. STREAMSTATS eliminates these problems by automating the process of measuring the physical characteristics and solving the equations. As a result, users can now obtain streamflow statistics for selected locations within a few minutes. The STREAMSTATS low-flow analysis procedure measures physical characteristics for user-selected locations from digital map data using ArcView GIS (Environmental Systems Research Institute, Inc., 1996a), and its accompanying programming language, AVENUE (Environmental Systems Research Institute, Inc., 1996b). STREAMSTATS does not require knowledge of how to use a GIS; users simply select the location of interest from a map displayed in the user interface, and STREAMSTATS does the rest.
After the user selects a site of interest from the map, STREAMSTATS determines the drainage-basin boundary and area. This is done using a combination of two sets of digital map data, known as data layers. One data layer contains drainage-basin boundaries for about 2,300 locations on Massachusetts streams, an average of one set of boundaries for every 4 square miles of land surface in the State. The other data layer is a Digital Elevation Model (DEM), developed by the USGS at 1:25,000 scale, that consists of a rectangular grid of elevation points spaced approximately every 100 feet along the land surface (Elassel and Caruso, 1983). The DEM elevations correspond to elevations shown on 1:25,000-scale USGS topographic quadrangle maps. If the user selects a site on an existing drainage-basin boundary, the area associated with that boundary is summed with areas for all upstream subbasins to determine the total drainage-basin area for that site. If the user selects a site not on an existing boundary, STREAMSTATS uses the DEM to define the boundary up to points at which the newly defined boundary coincides with existing boundaries. From that point, the existing boundaries are used to determine the total drainage-basin boundary and area for the site.
After STREAMSTATS determines the drainage-basin boundary, it then determines the remaining basin characteristics needed to solve the regression equations from other digital map layers: total length of streams, area of surficial stratified drift, mean basin slope, and hydrologic region. This process is more fully explained by Ries and Friesz (2000). STREAMSTATS then solves the regression equations and provides estimated streamflow statistics for the site to the user. Equations are available to estimate the 7-day, 2-year and the 7-day, 10-year recurrence-interval low flows; streamflows exceeded 99-, 98-, 97-, 95-, 90-, 75-, and 50-percent of the time; and the August median streamflow. STREAMSTATS also calculates prediction intervals at the 90-percent confidence level for the estimates as an indication of their reliability. The true values of the streamflow statistics for the selected sites are within the provided intervals 90 percent of the time. MassGIS employees did much of the programming for the STREAM-STATS automated procedure and developed many of the digital map layers it uses. The MassGIS Watershed Analyst tool includes some of the features of this application and also includes several additional features. The Watershed Analyst tool, the map layers used by STREAMSTATS, and their descriptions are available through the MassGIS Web page ( http://www.state.ma.us/mgis/ ).
USING STREAMSTATS. The STREAMSTATS user interface was developed for the USGS by Syncline, Inc., of Cambridge, Mass. The user interface is a Java applet (Sun Microsystems, Inc., 1999) that delivers interactive maps to users by use of the Internet Map Server software extension to ArcView (Environmental Systems Research Institute, Inc., 1999). Maps delivered over the Web can be used to select sites for which streamflow statistics will be provided. The applet incorporates a map window, a map legend window, a map action toolbar, and a menu command toolbar (fig. 1). First-time users of STREAMSTATS start on an introductory page, and are led through seven tutorial pages that provide instructions before they can start the applet. The introductory page also contains a link that allows users to view an on-line demonstration to help them become familiar with the application. Experienced users can bypass the tutorial on return visits and go to the main entry page for the application. The main entry page contains links to the tutorial pages for reference and a GO button that activates the user interface.
The user interface initially displays a map of Massachusetts in the map window with town boundaries and locations of data-collection stations (fig. 1). Buttons in the toolbars allow users to zoom in, zoom out, and pan to change the area displayed; to add, delete, and change the drawing order of map layers; and to identify features on the map. More than 100 map layers can be displayed to aid in locating sites of interest. The legend window identifies the displayed map layers.
The tutorial pages provide guidance on selecting map layers for locating sites. Usually, only a few map layers are needed. These usually include some combination of watershed boundaries, roads, stream centerlines, 1:25,000-scale lakes and ponds (including wetlands), and digital topographic maps.
Users must first zoom in to select a location for which they want streamflow information. When the location of interest is a data-collection station, users should select the Station Lookup button, then click their left mouse button on the station symbol on the map to get streamflow statistics and descriptive information for the station from the data base. The map scale of an entire river basin is usually sufficient for selecting data-collection stations. When the location of interest is not a data-collection station, users should select the Low-Flow Analysis button, then click their left mouse button on a point on a centerline stream to get estimates of the statistics for the location. Users must first zoom in to a map scale greater than 1:5,000 and the centerline streams must be activated in the legend window before the Low-Flow Analysis button is selected.
STREAMSTATS output appears in a separate Web browser window that opens automatically. This window contains a table of previously published information for data-collection stations. The window contains a map, a map legend, measured basin characteristics, estimated streamflow statistics, and prediction intervals for the estimates for sites where no data are available (fig. 2). The map shows the generated basin boundary for the selected site, any previously delineated basin boundaries within the map area, and the centerline streams within the basin boundary. Users should carefully inspect the map and the measured basin characteristics for the site to assure that the basin delineation appears correct. Incorrect delineations occasionally occur when selected sites are in or near flat areas such as wetlands and water bodies, and near stream confluences. Moving the selected point a short distance upstream or downstream from the original location will often correct these problems. Users can use their Web browser to print the information displayed by STREAMSTATS.
LIMITATIONS OF STREAMSTATS. The equations used in the STREAMSTATS low-flow analysis procedure provide estimates of natural streamflow. If human activities such as dam regulation and water withdrawals substantially affect the timing, magnitude, or duration of flows at a selected location, the estimates from the equations should be adjusted by the user to account for those activities. The low-flow analysis procedure can be run at locations of data-collection stations on streams that are affected by human activities to obtain estimates of natural streamflow conditions for the stations. Users should not assume, however, that the differences between the two sets of estimates (data base and low-flow analysis) are equivalent to the effects of human activities on streamflow at the station because there are errors associated with both sets of estimates. STREAMSTATS provides an error message when the basin characteristics for a selected site are outside the ranges of those for the stations used to develop the regression equations. Estimates can be obtained for these sites, but prediction intervals are not provided. The program does not provide estimates for sites on major rivers with drainage basins that extend into areas outside of Massachusetts where data for running STREAMSTATS are not available.
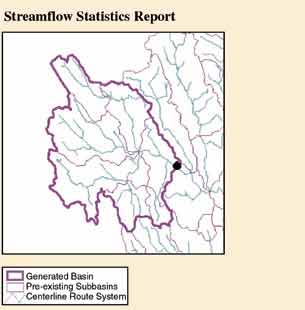
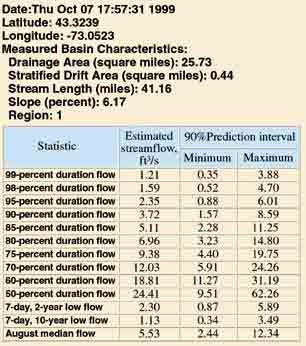
Figure 2. Example output from the STREAMSTATS low-flow analysis procedure, including a map of the drainage basin determined for the user-selected site, a map legend, and a table of estimated streamflow statistics.
The regression equations in STREAMSTATS do not apply in the eastern part of the Buzzards Bay Basin, the southern part of the South Coastal Shore Basin, on Cape Cod, or the Islands, because the data available in these areas were inadequate for use in the regression analyses. Flows for most streams in these areas, shown as the Southeast Coastal region in the Hydrologic Regions data layer, are highly affected by regulation, diversions, or cranberry bogs. In addition, the region is underlain almost entirely by coarse-grained stratified drift. Surface-water drainage boundaries commonly do not coincide with contributing areas of ground water for streams in the region.
REFERENCES CITED.
Elassel, A.A., and Caruso, V.M., 1983, USGS digital cartographic standards: digital elevation models: U.S. Geological Survey Circular 895-B, 40 p.
Environmental Systems Research Institute, Inc., 1996a, Using ArcView GIS: Redlands, Calif., 350 p.
Environmental Systems Research Institute, Inc., 1996b, AVENUE, Customization and Application Development for ARCVIEW: Redlands, Calif., 239 p.
Environmental Systems Research Institute, Inc., 1999, ArcView Internet Map Server: at http://www.esri.com/software/arcview/extensions/imsext.html accessed 10/7/99
Sun Microsystems, Inc., 1999, What is the JavaTM Platform?: at http://java.sun.com/nav/whatis/ accessed 10/7/99
This report is available online in Portable Document Format (PDF). If you do not have the Adobe Acrobat PDF Reader, it is available for free download from Adobe Systems Incorporated.
Document Accessibility: Adobe Systems Incorporated has information about PDFs and the visually impaired. This information provides tools to help make PDF files accessible. These tools convert Adobe PDF documents into HTML or ASCII text, which then can be read by a number of common screen-reading programs that synthesize text as audible speech. In addition, an accessible version of Acrobat Reader 8.0 for Windows (English only), which contains support for screen readers, is available. These tools and the accessible reader may be obtained free from Adobe at Adobe Access.
Suggested Citation:
Ries, K.G., III, Steeves, P.A., Freeman, A., and Singh, R., 2000, Obtaining streamflow statistics for Massachusetts streams on the World Wide Web: U.S. Geological Survey Fact Sheet 104-00, 4 p.
For additional information write to:
Director,
USGS Massachusetts–Rhode Island Water Science Center
10 Bearfoot Road
Northborough, MA 01532or visit our Web site at:
http://ma.water.usgs.gov
| AccessibilityFOIAPrivacyPolicies and Notices | |
| U.S. Department of the Interior, U.S. Geological Survey
Persistent URL: https://pubs.water.usgs.gov/fs10400 Page Contact Information: USGS Publishing Network Last modified: Tuesday, 29-Nov-2016 18:18:47 EST |
 |
