
Interpretive maps of the sea-floor geology provide a fundamental framework for research and management in the coastal ocean. They show the composition of the seabed and the shape (topography) of the sea floor; they also show areas of present and past dumping of sediments and pollutants, as well as locations and impacts of other human activities. They provide information on the transport of sediment and help to define biological habitats. All this information can be used to develop predictive models to guide habitat and resource management, monitoring strategies, and other research studies.
|
|
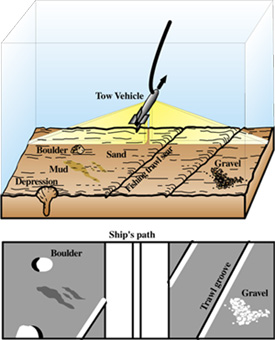
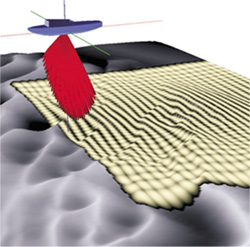
| Figure 1. Upper: A sidescan sonar "fish" towed behind a vessel surveys the sea floor by sending sound to either side of the ship's path. Typical survey swaths (yellow area) are a few hundred meters wide. Lower: The intensity and pattern of sound reflected from the ocean floor provide information on the composition of sediments and the topography. Strong reflections from boulders, gravel, and the walls of trawl grooves appear as light tones on this data record; weak reflections from finer sediments or shadows behind vertical features are dark. A composite image, pieced together from multiple survey strips, provides an image of the sea floor similar in detail to an aerial photograph. | Figure 2. High-resolution multibeam mapping systems use sound from arrays of 60 to more than 150 electronically separated transducers to measure water depth as well as sediment characteristics of the sea floor. The transducers form beams a few degrees wide that produce a footprint of a few square meters on the sea floor in water depths of 50 meters. Because the system is fixed to the ship's hull, the data can be easily georeferenced and surveys can be run at speeds of 15 knots. The multibeam surveys provide a new, highly detailed view of the sea floor. Used with the permission of the University of New Brunswick. |
[Click on thumbnail to open larger
|
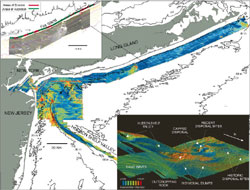
Figure 3. The USGS has mapped the sea floor in the New York Bight apex and along the southern shore of Long Island by using sidescan sonar, and the Hudson Shelf valley and adjacent shelf by using multibeam. This combined backscatter image (red is high backscatter and blue is low backscatter) shows a complex pattern of sediment properties that is a result of the underlying geology, modern processes, and anthropogenic activity. The backscatter intensity is related to sediment texture, as well as other properties. In general, high backscatter indicates coarse-grained sediment or outcropping rock, and low backscatter indicates fine sands, silt, or clays. The Hudson Shelf valley is floored with fine-grained sediments. The box outlines the location of the multibeam image shown at right; the black arrow indicates the look direction -- to the southwest. From Schwab and others (1997); Butman and others (1998). |
| Top left: Along the southern shore of Long Island, Cretaceous age (>65 million years old) rocks outcrop approximately 6 kilometers off central Fire Island (bright high-backscatter region) and exert a primary control on observed patterns of coastal change. This area acted as a headland during times of lower sea level about 10,000 years ago. Erosion of this headland during subsequent sea-level rise furnished sediments to the inner shelf downdrift to the west. These sediments, in turn, were reworked by oceanographic processes into a series of sand ridges. Note the halo of coarser sediment to the west of the outcropping rock. A westward and onshore sediment flux from these ridges may supply sediment to the beaches of western Fire Island and may influence the pattern of erosion of the barrier-island system. From W.C. Schwab and others, written commun. (1998). | Lower right: Sun-illuminated perspective view (looking to the southwest) of the topography and sediment characteristics of the shelf at the head of the Hudson Shelf valley (area in box, fig. 3). The image was constructed by draping color-coded backscatter intensity over the bathymetry, as measured by a multibeam system. Water depth at the northern portion of the region is approximately 30 meters; water depth in the Hudson Shelf valley at the left of the image is about 50 meters. Features observed include relatively smooth mounds composed of material dumped since the 1800's; mounds (as high as 10 meters) of dredged material from more recent disposal; a smooth, roughly circular region that resulted from disposal of contaminated sediments and is capped with coarse sand; outcrops of southwestward-dipping Cretaceous age coastal plain strata at the head of the Hudson Shelf valley; low-relief (amplitude <1 meter) sand waves suggesting sediment transport to the southwest; and individual dumps of material, some arranged in lines, in some cases probably large rocks from construction activity in New York (referred to as "derrick stones"). From Butman and others (1998). |
The surveys off the New York-New Jersey area are being carried out by the USGS in cooperation with the U.S. Army Corps of Engineers, Texas A&M University, the State University of New York at Stony Brook, the University of New Brunswick, the Canadian Hydrographic Service, Wesleyan University (Connecticut), and Coastal Carolina University.
|
For more information, please contact:
Bradford Butman |
|
U.S. Department of the Interior U.S. Geological Survey |
USGS Fact Sheet 133-98 February 1999 |