
Bottom sediments have been regarded as memory banks for contaminant inputs to urban waterways. Bottom sediments accumulate by the addition of particles that enter the waterway from many sources (U.S. National Research Council, 1989). Sediments include solid contaminants, as well as contaminants from the water column that are adsorbed on organic matter or soil (rock) particles. Sediments from Boston Harbor and adjacent parts of Massachusetts Bay are now among the most intensively studied in the Nation in terms of chemical composition.
Scientists at the U.S. Geological Survey (USGS), Woods Hole, Mass., undertook a pioneering effort to assemble a database from all available sources of information on chemicals in sediments of the Boston Harbor study area. The database was created to help understand the distribution of sediment contaminants and their sources, transport, and other processes and to support environmental management. The work involved collaboration with the U.S. Environmental Protection Agency (USEPA), the U.S. Army Corps of Engineers (USACOE), the Massachusetts Water Resources Authority, and other organizations. More than 100,000 sediment measurements from more than 3,000 samples were gleaned from 1,500 references. New approaches were developed to scientifically edit and validate data from heterogeneous sources. The compiled data included inorganic and organic chemical information and physical parameters like sediment texture (grain size), as well as documentation to minimize a userąs need to track down hard-to-find reports.
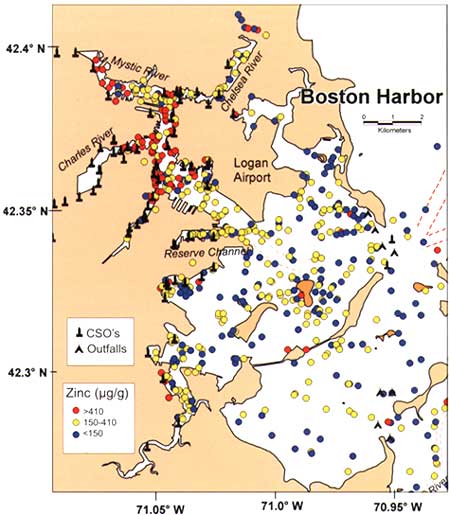
Figure 1. Zinc concentrations in Boston Harbor sediments (total database including all depths). The color coding uses the screening-level, bulk-sediment toxicity criteria of Long and others (1995). The concentration levels denoted by red, yellow, and blue correspond to "Effects Range Medium," "Effects Range Low," and concentrations below those expected to produce toxic effects on bottom organisms, respectively. Natural background concentrations of zinc in average sediments are approximately 90 µg/g. "Outfall" means a submarine pipe (present or past) discharging sewage effluent or sludge; combined sewage outfalls (CSO's) combine street runoff with household wastewater and may discharge raw sewage to the harbor during heavy rains. |
Bulk-sediment toxicity guidelines of the kind used in figure 1 (Long and Morgan, 1990; Long and others, 1995) are among the few means available to interpret the toxicity status of samples described by historical data. The criteria based on concentration levels are generally agreed to be conservative and help constrain areas that may require more specific (higher tier) toxicity evaluations. These evaluations include site-specific animal toxicity tests, AVS (acid-volatile sulfide) measurement, bioaccumulation tests, and bottom organism community analysis. The criteria of Long and Morgan (1990) and Long and others (1995) were developed by the National Standards and Trends benthic monitoring program of the National Oceanic and Atmospheric Administration.
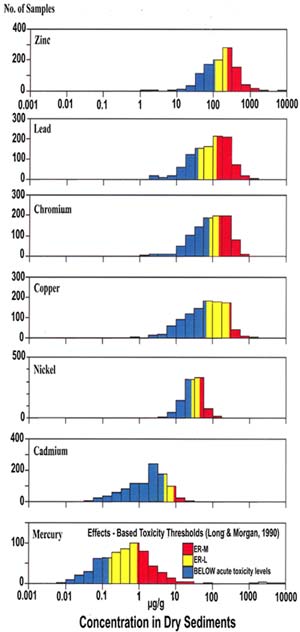
Figure 2. Sample frequency distribution for seven potentially toxic metals in sediments from Boston Harbor and inner Massachusetts Bay (1993 data). Colors correspond to those in figure 1. |
Arsenic and silver (not shown) and other metals are also found at higher levels than background values for naturally occurring estuarine sediments. Organic contaminants such as polychlorinated biphenyls (PCBąs), polyaromatic hydrocarbons (PAHąs), and pesticides like DDT and chlordane are also widely distributed in the sediments, although the proportions of the sediments that fall into toxic ranges are smaller.
In spite of these coherent statistical patterns, the spatial distribution of contaminants shows a high degree of patchiness, as can be inferred from figure 1. Local variability becomes more extreme in Boston Inner Harbor close to the coasts. Here, samples 100 meters apart may show markedly different concentration levels, a condition that is partly related to proximity to point sources of contaminants. In harbor environments, sediment composition at any given point may not be representative of larger areas; the often extreme spatial variability emphasizes the importance of extensive spatial data coverage.
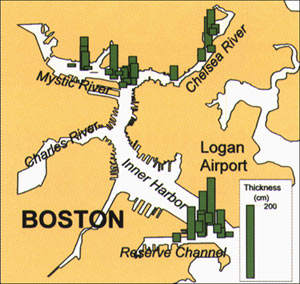
Figure 3. Thickness of sediments in various locations, Boston Inner Harbor bottom. |
Such data allow estimation and prediction of sediment supply and burial rates. Accumulation rates help define specific contaminant loading per unit time. Burial rates are important to estimate the time needed to cover severely contaminated sediment layers with cleaner sediments that result from improvement in wastewater management.
|
For more information, please contact:
Frank Manheim, Marilyn Buchholtz ten Brink, Polly Hastings, or Ellen Mecray URL: http://coast-enviro.er.usgs.gov/boseco/ and linked sites |
|
U.S. Department of the Interior U.S. Geological Survey |
USGS Fact Sheet FS-078-99 March 1999 |