INTRODUCTION
The Cambrian-Ordovician aquifer system is a complex multiaquifer system with individual aquifers separated by leaky confining units. The several aquifers are capped by the Maquoketa confining unit, which confines them as an aquifer system.
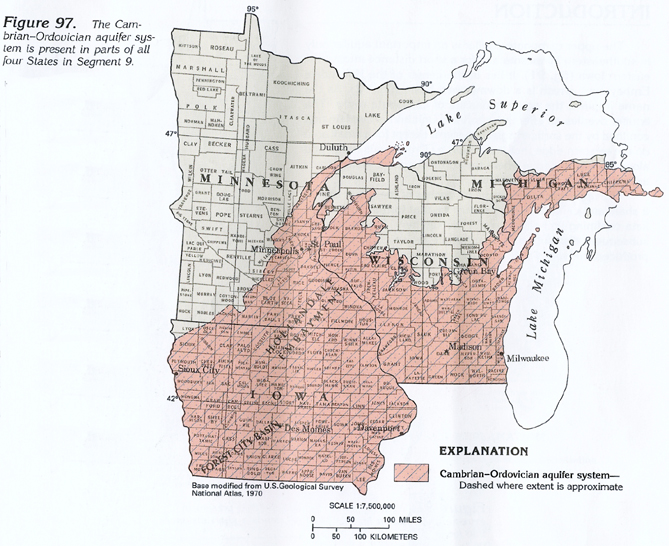
Cambrian and Ordovician rocks crop out in each of the four States of Segment 9 (fig. 97). In Minnesota, the rocks crop out in the southeastern quarter of the State (fig. 97) in the Hollandale Embayment. The underlying Precambrian sedimentary rocks-the Hinckley Sandstone-extend northward to Lake Superior (fig. 97), and are hydraulically connected to the Cambrian rocks. They are included within the Cambrian-Ordovician aquifer system in this report (fig. 98).
In Iowa, Cambrian and Ordovician rocks are present throughout the State except for the extreme northwestern corner; they crop out in the northeastern corner of the State and along the Mississippi River and are buried beneath Silurian and younger rocks as they dip southwestward into the Forest City Basin.
In Wisconsin, Cambrian and Ordovician rocks form the bedrock surface in the southern two-thirds of the State (fig. 97) and underlie Silurian rocks along the eastern edge where the section dips eastward into the Michigan Basin. The Precambrian Lake Superior Sandstone, which is present in Wisconsin along the southern shore of Lake Superior, is included with the Cambrian-Ordovician aquifer system.
Cambrian and Ordovician rocks in Michigan are present in all but a small area in the central and eastern parts of the Upper Peninsula and underlie the entire Lower Peninsula. These rocks crop out along the northern periphery of the Michigan Basin and dip into the basin where they are covered by Silurian and younger rocks. In the Lower Peninsula, these rocks are deeply buried, contain brine, and are known only from deep oil test wells. Consequently, the rocks are not considered to be an aquifer.
The Cambrian-Ordovician aquifer system is under stress from extensive ground-water withdrawals in southeastern Wisconsin, much of Iowa, and especially in the Chicago, Illinois area in the adjoining Segment 10. In all but the deeply buried parts of the aquifer system, the water is chemically suitable for all uses.
HYDROGEOLOGIC UNITS
Cambrian and Ordovician rocks in parts of the four States (fig. 97) consist primarily of sandstone
in the lower part and sandstone and shale interbedded with limestone
or dolomite in the upper part. Based on differences in the lithology
and the water-yielding character of the rock units, three principal
aquifers, which are separated by confining units, are differentiated
in the Cambrian and Ordovician section. These aquifers and confining
units comprise the Cambrian-Ordovician aquifer system that
is underlain by low-permeability crystalline rocks (fig.
98). The Maquoketa confining unit also is considered to be
part of the Cambrian-Ordovician aquifer system; where this
confining unit is present (fig. 99),
it overlies and confines the entire system as a leaky artesian
aquifer system. Each of the aquifers crops out at the bedrock
surface, with progressively older rocks exposed in a generally
northerly direction toward the Transcontinental Arch and Wisconsin
Dome. Where the aquifers crop out at the bedrock surface, they
are hydraulically connected with the overlying surficial aquifer
system. In places, fine-grained material in the glacial deposits
forms local confining beds.
The Cambrian-Ordovician aquifer system in Wisconsin is
referred to as the sandstone aquifer (fig.
98). In Iowa, the system is separated by a significant confining
unit into the upper Cambrian-Ordovician aquifer system and
the lower Dresbach aquifer (fig. 98).
The Cambrian-Ordovician aquifer system in southeastern Minnesota
and the Upper Peninsula of Michigan is called the Cambrian-Ordovician
aquifer. The same hydrogeologic units or their equivalents comprise
the aquifer system in Minnesota, Iowa, Wisconsin, and the Upper
Peninsula of Michigan.
Hydrogeologic units that comprise the aquifer system are (in descending
order) the Maquoketa confining unit, the St. Peter-Prairie
du Chien-Jordan aquifer, the St. Lawrence-Franconia confining
unit, the Ironton-Galesville aquifer, the Eau Claire confining
unit, and the Mount Simon aquifer.
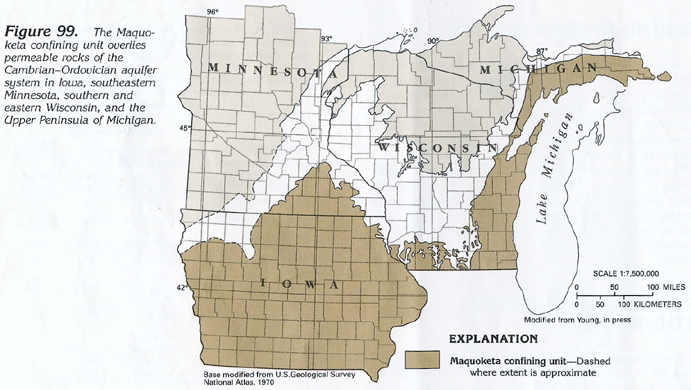
Maquoketa Confining Unit
The Maquoketa confining unit consists of various geologic formations
in each of the four states. The entire Maquoketa confining unit
(fig. 99) generally is present only
where overlain by Silurian and younger rocks. In those areas,
the Maquoketa confining unit effectively confines the underlying
aquifers that consist of Cambrian and Ordovician rocks. Where
Silurian and younger rocks have been removed by erosion, the upper
shale of the Maquoketa confining unit generally has been eroded
away, and the underlying dolomite formations form the bedrock
surface. Although these formations are fractured and contain dissolution
features, they also partially confine the underlying aquifers.
In the Upper Peninsula of Michigan, the shaly Richmond Group forms
a confining unit that is equivalent to the Maquoketa Shale (fig. 100).
Although part of the Maquoketa confining unit in the subsurface, the Galena Dolomite and the Decorah and the Platteville Formations, where they crop out in broad areas of Wisconsin and northeastern Iowa, form a local aquifer that is primarily used for domestic supply. Equivalent rocks in the Upper Peninsula of Michigan comprise the Trenton-Black River aquifer, which also is used mostly for domestic supply. In southeastern Minnesota and a small part of northeastern Iowa, the Maquoketa Shale and the Galena Dolomite, together with the overlying Devonian Cedar Valley Limestone (fig. 98), form the upper carbonate aquifer, as discussed above.
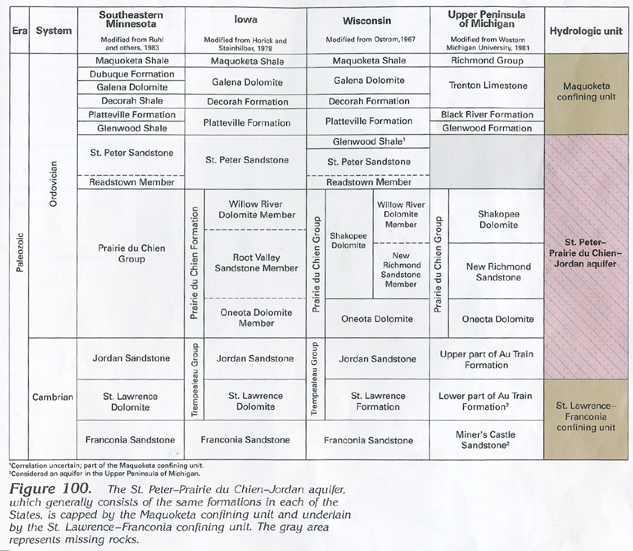
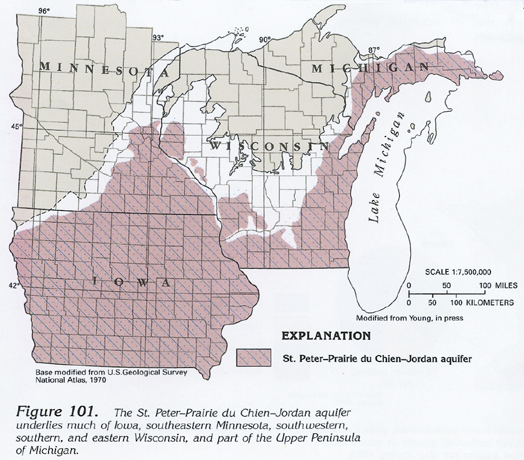
St. Peter-Prairie du Chien-Jordan Aquifer
The St. Peter Sandstone, the Prairie du Chien Group, and the Jordan
Sandstone (fig. 100) comprise the
St. Peter-Prairie du Chien-Jordan aquifer, which is an
important source of water primarily in southeastern Minnesota;
northern Iowa; southwestern, southern, and eastern Wisconsin;
and the Upper Peninsula of Michigan (fig.
101). The three rock units generally are hydraulically connected
and function as one aquifer. Because of differences in thickness,
grain size, or dissolution of the rocks, however, well yields
and, therefore, the importance of the individual units, are areally
variable.
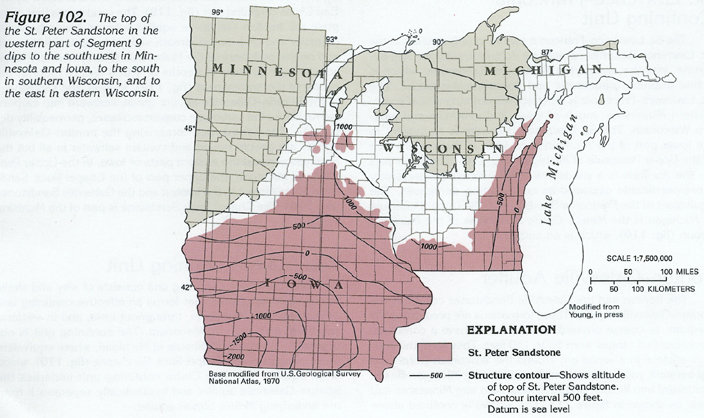
The top of the St. Peter Sandstone dips to the southwest from about 1,000 feet above sea level in Minnesota to more than 1,000 feet below sea level in southwestern Iowa (fig. 102). It is deeply buried under younger rocks in the southern half of Iowa. The St. Peter dips southward in southern Wisconsin toward the Illinois basin and eastward in eastern Wisconsin into the Michigan Basin.
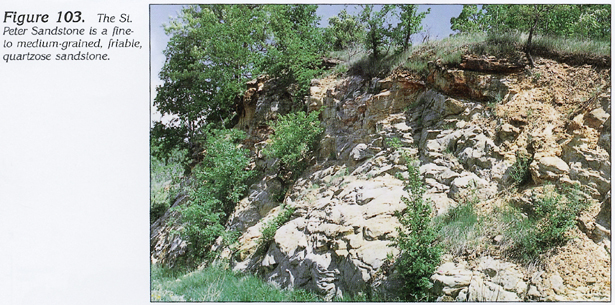
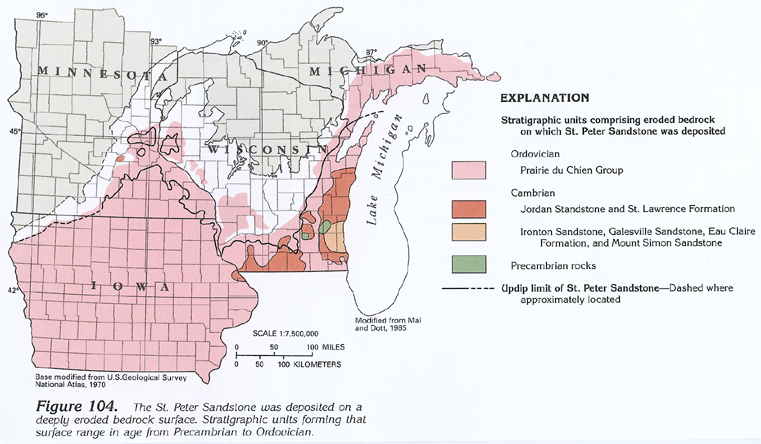
The St. Peter Sandstone is a fine- to medium-grained, friable, quartzose sandstone (fig. 103) that was deposited by a trangressive Ordovician sea. The sandstone was deposited on a deeply eroded bedrock surface and is in contact with underlying rocks that range in age from Precambrian to Ordovician (fig. 104). The most deeply eroded bedrock is in eastern Wisconsin where the St. Peter Sandstone was deposited on the Mount Simon Sandstone. The St. Peter locally rests on Precambrian rocks in south-central Wisconsin, but these areas are remnant highs on the eroded crystalline-rock surface that project upward through the Ironton and Galesville Sandstones, Eau Claire Formation, and Mount Simon Sandstone. The St. Peter was deposited on the eroded surface of the Jordan Sandstone and the St. Lawrence Formation in part of eastern Wisconsin and along the Wisconsin-Illinois border. In the remainder of its extent, the St. Peter lies unconformably on dolomite of the Prairie du Chien Group except for small areas where the dolomite might have been removed by erosion.
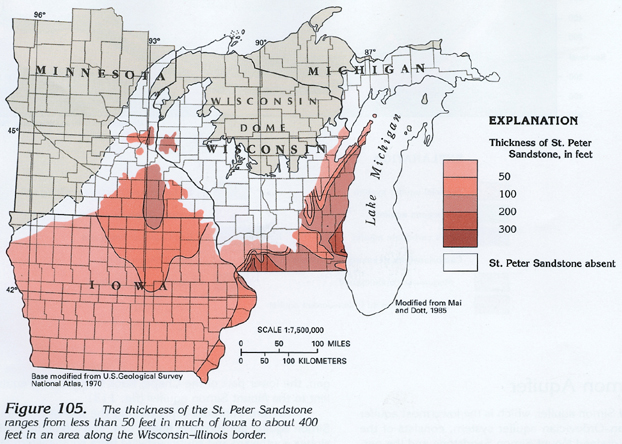
The St. Peter Sandstone is present in southeastern Minnesota, most of Iowa, and southwestern, southern, and eastern Wisconsin (fig. 105). The sandstone is about 330 feet thick in the Milwaukee area of eastern Wisconsin and about 400 feet thick in the southwestern part of Wisconsin, but generally is less than 200 feet thick in the remainder of the State. The St. Peter is generally 50 to 100 feet thick in Iowa and part of Minnesota (fig. 105).
The Readstown Member of the St. Peter Sandstone is present at the base of the sandstone (fig. 100) in areas where the sandstone is thick. The Readstown is a conglomeratic shale, siltstone, and silty sandstone that was deposited on the sub-St. Peter erosional surface. The Readstown is about 80 feet thick in the Minneapolis-St. Paul area of Minnesota and probably has a similar thickness in southeastern Wisconsin. Because of its fine-grained texture, the Readstown functions as a confining unit locally, and hydraulically separates the St. Peter Sandstone from the underlying Prairie du Chien Group, the Jordan Sandstone, and older rocks.
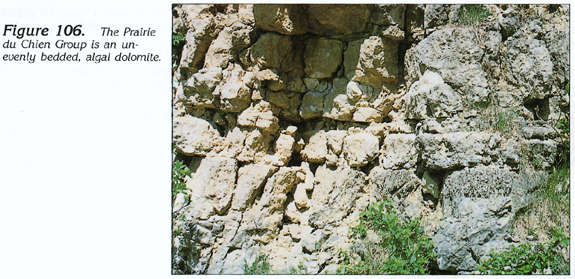
The Prairie du Chien Group consists of upper and lower dolomite units with an intervening sandstone unit (fig. 100). The dolomite is unevenly bedded, as shown in figure 106. The Prairie du Chien Group thins from a maximum of about 500 feet thick (in Iowa) to a featheredge in northwestern Iowa on the western side of the Hollandale Embayment and in an arc surrounding the Wisconsin Dome. The group is missing in areas where the St. Peter Sandstone is thick in southern and eastern Wisconsin (fig. 104). In the Green Bay area, the entire St. Peter-Prairie du Chien-Jordan aquifer thickens eastward from a featheredge to about 250 feet. The Prairie du Chien Group is present in much of the Upper Peninsula of Michigan.
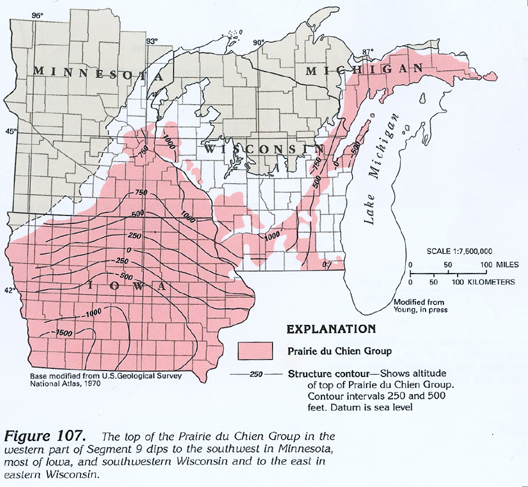
The top of the Prairie du Chien Group dips southwestward from about 1,000 feet above sea level in southeasternmost Minnesota to about 1,000 feet below sea level in southwestern Iowa (fig. 107). The group dips eastward and southward into the Michigan Basin on the eastern edge of Wisconsin (fig. 107) and in the Upper Peninsula of Michigan.
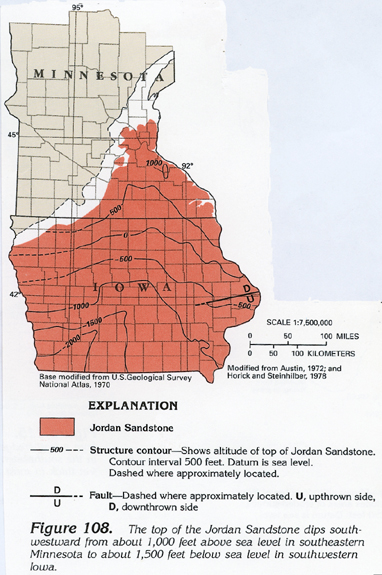
The Jordan Sandstone is a well sorted, fine- to coarse-grained, quartzose sandstone. The top of the Jordan dips southward and southwestward from about 1,000 feet above sea level in southeastern Minnesota to about 1,500 feet below sea level in southwestern Iowa (fig. 108). The Jordan ranges from about 60 to 140 feet in thickness in Minnesota and northeastern Iowa; in southwestern Iowa, it is about 20 to 60 feet thick, as shown in figure 109. In western Wisconsin, the Jordan is as much as 80 feet thick, but it is only about 30 feet thick around the flanks of the Wisconsin Dome. The Jordan Sandstone is equivalent to the upper part of the Au Train Formation, which is also a sandstone, in the Upper Peninsula of Michigan (fig. 100).
St. Lawrence-Franconia Confining Unit
The St. Lawrence-Franconia confining unit consists of the
St. Lawrence Dolomite, which is a dolomitic siltstone and dolomite,
and the underlying Franconia Sandstone, which is a fine-grained,
glauconitic and dolomitic sandstone. The St. Lawrence-Franconia
is an effective confining unit in southeastern Minnesota, much
of Iowa, and southern and eastern Wisconsin. The St. Lawrence
Dolomite is equivalent to the lower part of the Au Train Formation
in the western part of the Upper Peninsula of Michigan (fig.
110). The lower part of the Au Train is a sandstone that becomes
progressively more permeable eastward as cementation decreases.
The equivalent of the Franconia Sandstone in the Upper Peninsula
of Michigan is the Miner's Castle Sandstone of the Munising Group
(fig. 110), which is an aquifer.
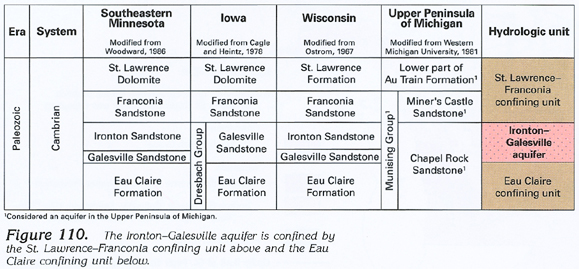
Ironton-Galesville Aquifer
The Ironton and the Galesville Sandstones comprise the Ironton-Galesville
aquifer. These formations are predominantly medium- to coarse-grained
sandstone and have a combined thickness that ranges from 50 to
150 feet. They form the bedrock surface in a broad arc around
the Wisconsin Dome and dip beneath younger rocks eastward into
the Michigan Basin, southward into Illinois, and southwestward
into Minnesota and Iowa, as shown in figure
111. The aquifer is confined above by the St. Lawrence-Franconia
confining unit and below by the Eau Claire confining unit (fig.
110). The sandstones that comprise the Ironton-Galesville
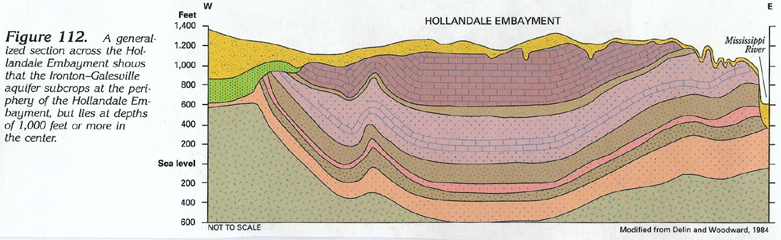
aquifer subcrop beneath glacial deposits and crop out in stream
valleys in central Wisconsin and on the periphery of the Hollandale
Embayment of Minnesota but are present at depths of 1,000 feet
or more in the center of the embayment (fig.
112). In Iowa, the sandstones of the Ironton-Galesville
aquifer grade westward into carbonate rocks. As the carbonate
content increases, permeability decreases. The sandstones comprising
the Ironton-Galesville aquifer are deeply buried and contain
saltwater in all but the northeastern and the eastern parts of
Iowa. In the Upper Peninsula of Michigan, the upper part of the
Chapel Rock Sandstone is equivalent to the Ironton and the Galesville
Sandstones (fig. 110). The Chapel
Rock Sandstone is part of the Munising aquifer.
Eau Claire Confining Unit
The Eau Claire confining unit consists of silty and shaly, fine-grained
sandstone that forms an effective confining unit in southeastern
Minnesota, throughout Iowa, and in western, southern, and eastern
Wisconsin. The confining unit is not present in the Upper Peninsula
of Michigan, where equivalent rocks are part of the Chapel Rock
Sandstone (fig. 110), which is an
aquifer. The Eau Claire confining unit underlies the Ironton-Galesville
aquifer and hydraulically separates it from the underlying Mount
Simon aquifer.
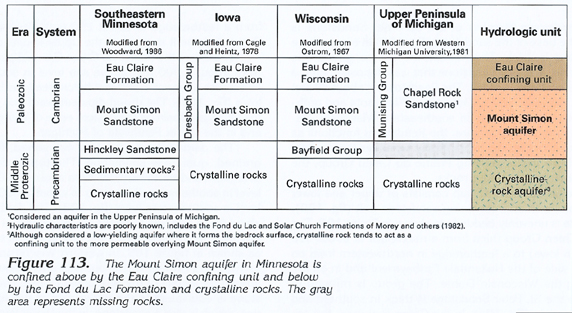
Mount Simon Aquifer
The Mount Simon aquifer, which is the lowermost aquifer of the
Cambrian-Ordovician aquifer system, consists of the coarse-
to fine-grained Mount Simon Sandstone and the permeable Hinckley
Sandstone in Minnesota and the Bayfield Group in Wisconsin. The
aquifer is extensively used in the southeastern quarter of Minnesota.
In Iowa, the Mount Simon aquifer, the Eau Claire confining unit,
and the Ironton-Galesville aquifer comprise the Dresbach aquifer,
which contains saltwater in all but the extreme eastern part of
the State and is not extensively used. In Wisconsin, the Mount
Simon aquifer underlies the southern two-thirds of the State and
has the broadest distribution of any of the aquifers in the Cambrian-Ordovician
aquifer system. Wells penetrating the Mount Simon aquifer in Wisconsin
generally are open to overlying Cambrian-Ordovician aquifers.
These aquifers are collectively called the sandstone aquifer.
In the Upper Peninsula of Michigan, the lower part of the Chapel
Rock Sandstone is equivalent to the Mount Simon aquifer (fig.
113).
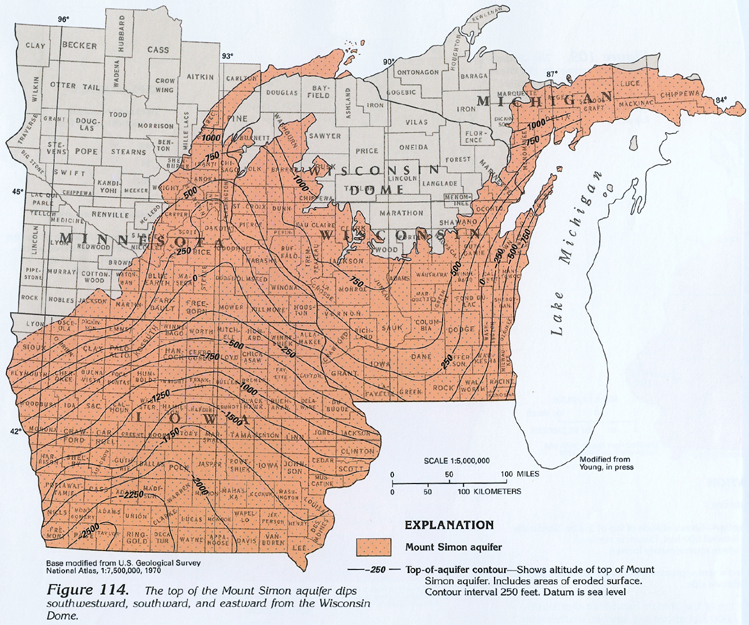
Structure contours representing the top of the Mount Simon aquifer are shown in figure 114. The top of the aquifer slopes southward and southwestward from southeastern Minnesota and western Wisconsin where it is 1,000 feet or more above sea level to southwestern Iowa where it is about 2,500 feet below sea level. From eastern Wisconsin, the aquifer slopes eastward into the Michigan Basin and southward into the Illinois Basin (fig. 114).
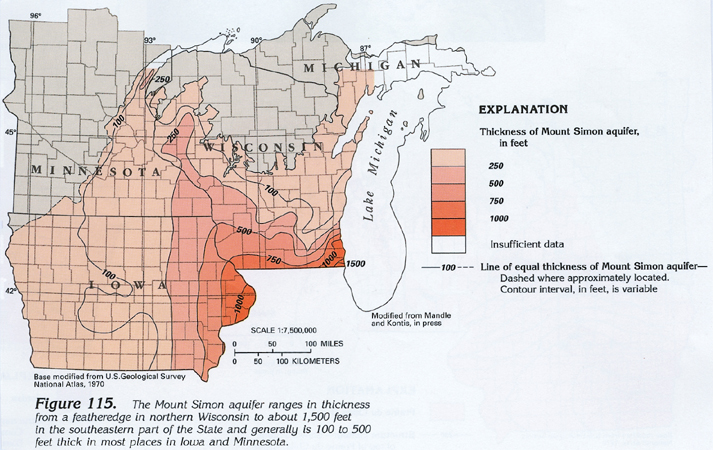
The Mount Simon aquifer ranges in thickness from a featheredge along its northern periphery to about 1,500 feet in southeastern Wisconsin, as shown in figure 115. The aquifer increases in thickness toward the Michigan and Illinois Basins. The aquifer generally is 100 to 250 feet thick in the principal area of use in Minnesota and Wisconsin. The aquifer is confined above by the Eau Claire confining unit and overlies less-permeable rocks of Precambrian age (fig. 113).
GROUND-WATER FLOW
Ground-water flow in the St. Peter-Prairie du Chien-Jordan
aquifer is part of the regional flow in the Cambrian-Ordovician
aquifer system, which is a leaky artesian system. Although individual
aquifers in the system are separated by confining units that may
be much less permeable than the aquifers, some water moves vertically
through these confining units. Hydraulic heads in the individual
aquifers of the Cambrian-Ordovician aquifer system generally
are at successively lower altitudes, which indicates that water
moves vertically downward into the aquifer system in most areas.
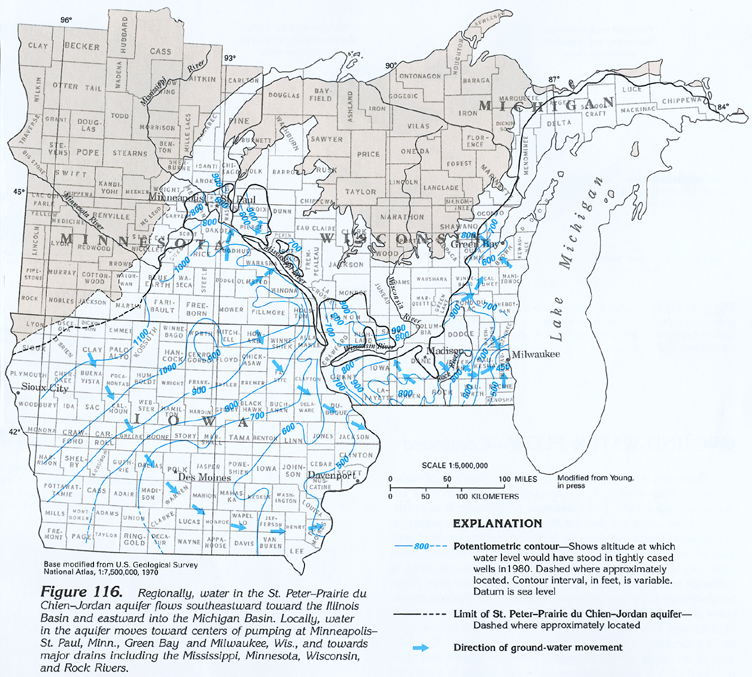
In Iowa, southeastern Minnesota, and southwestern Wisconsin, the regional direction of ground-water flow in the St. Peter-Prairie du Chien-Jordan aquifer is southeastward toward the Illinois Basin in south-central Illinois (fig. 116). In eastern Wisconsin, the flow is eastward toward Lake Michigan. Water also moves toward centers of pumping, such as Green Bay and Milwaukee, Wis., and Minneapolis-St. Paul, Minn., and toward regional discharge areas, such as the Mississippi, the Wisconsin, and the Rock Rivers (fig. 116).
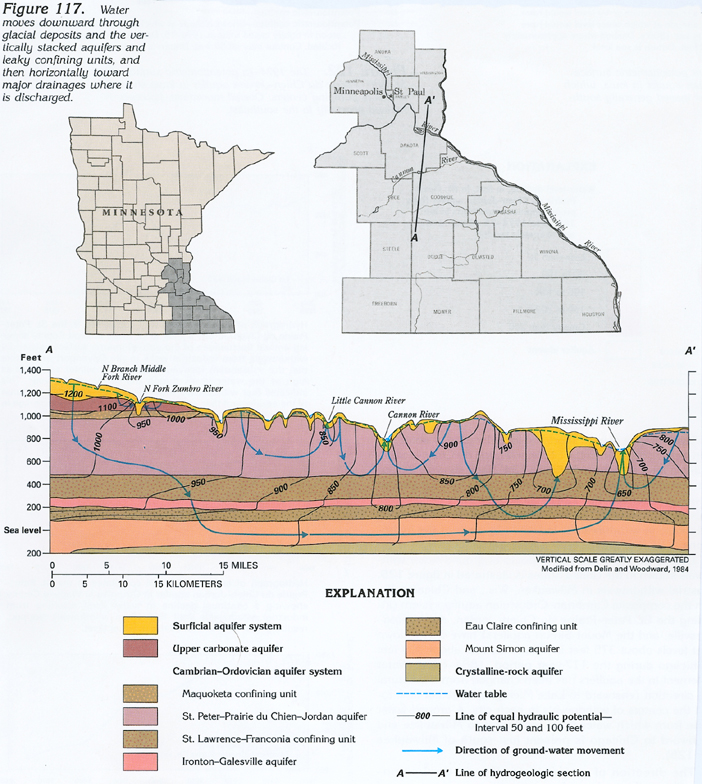
Ground-water flow in the St. Peter-Prairie du Chien-Jordan aquifer, as in all the aquifers in the Cambrian-Ordovician aquifer system, is downward in interstream areas where the aquifer crops out or is thinly confined; for example, in Minnesota, some of the water from precipitation moves downward into the surficial aquifer system and then moves down the vertical hydraulic gradient to recharge the upper carbonate aquifer,as shown in figure 117. In the upper carbonate aquifer, some of the water moves laterally along a horizontal gradient to local streams where it moves upward and is discharged to the streams. However, some of the water continues to percolate downward through successively deeper confining units and aquifers. Water that reaches each aquifer moves laterally, generally long distances (especially in the lower aquifers), and eventually discharges upward to regional drains, such as the Mississippi River (fig. 117).
Water in the St. Peter-Prairie du Chien-Jordan aquifer, as in all the aquifers of the Cambrian-Ordovician aquifer system, generally is under artesian (confined) conditions. In southeastern Minnesota and northeastern Iowa, however, in the deeply entrenched drainage system of the Mississippi River, where glacial deposits are thin or missing, the aquifer crops out and contains water under water-table (unconfined) conditions. The potentiometric surface of the St. Peter-Prairie du Chien-Jordan aquifer in that area indicates ground water moves toward and discharges to local streams.
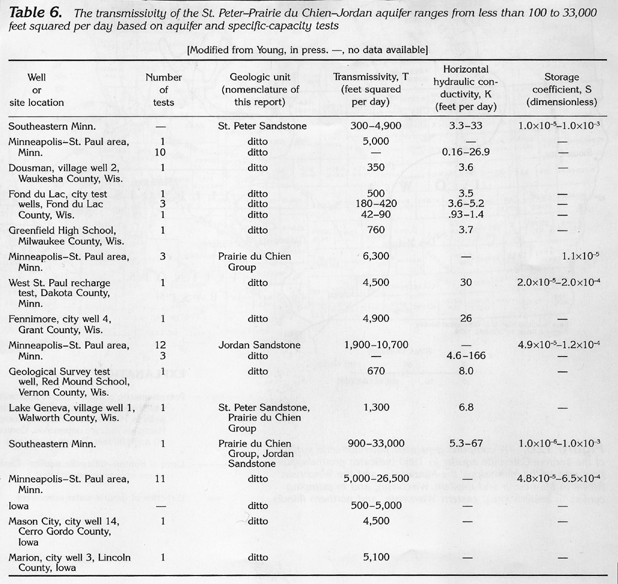
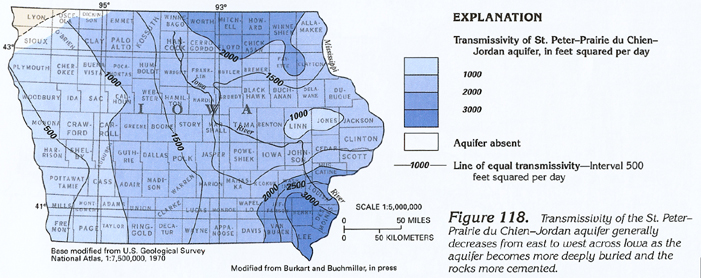
Transmissivity values for the St. Peter-Prairie du Chien-Jordan aquifer, based on aquifer-test results and estimates from specific-capacity data, are variable, as shown in table 6. The maximum transmissivity and hydraulic-conductivity values for the aquifer are in the Minneapolis-St. Paul area and in southeastern Minnesota, eastern Iowa, and extreme southwestern Wisconsin, primarily due to the larger hydraulic-conductivity values of the Prairie du Chien Group and Jordan Sandstone. Generalized ranges of transmissivity values for the St. Peter-Prairie du Chien-Jordan aquifer in Iowa are shown in figure 118. Values decrease from about 3,000 feet squared per day in the southeast to about 500 feet squared per day in the west. This pattern coincides with increased cementation of the sandstone and greater depth of burial of the aquifer to the southwest.
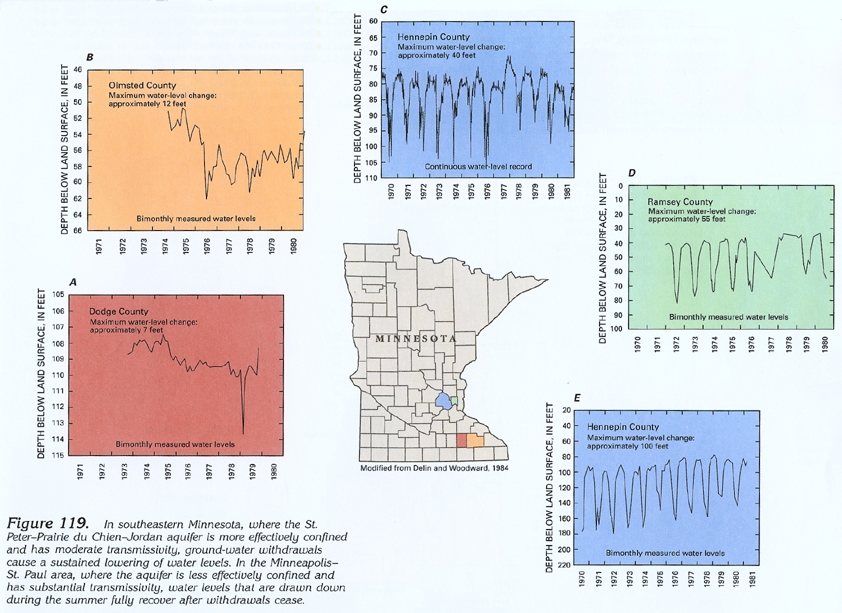
Hydrographs of water levels in wells completed in the St. Peter-Prairie du Chien-Jordan aquifer in the Minneapolis-St. Paul area and in southwestern Minnesota are shown in figure 119 and illustrate fluctuations of ground-water levels largely in response to withdrawals. Hydrographs in figures 119A and 119B represent water levels in southeastern Minnesota where the aquifer is deeply buried and where withdrawals are moderate. Under these conditions, water levels decline and recover as much as 7 to 12 feet seasonally due to larger water demands during the summer months than during the winter months. The overall trend of the hydrographs, however, is downward, indicating that recharge is not adequate to replace the water withdrawn.
Three hydrographs of wells completed in the St. Peter-Prairie du Chien-Jordan aquifer (figs. 119C-E) near Minneapolis-St. Paul, where the aquifer transmissivities are high, show drawdowns of as much as 100 feet in response to large withdrawals during the summer. Water levels in each of the wells, however, recover completely during the winter when withdrawals are reduced. The overall trend of seasonal high water levels is level or upward. Recharge in this area is, therefore, equal to or greater than withdrawal.
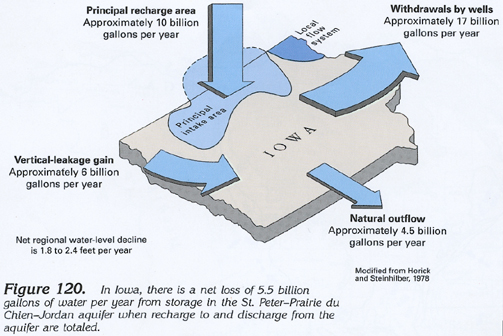
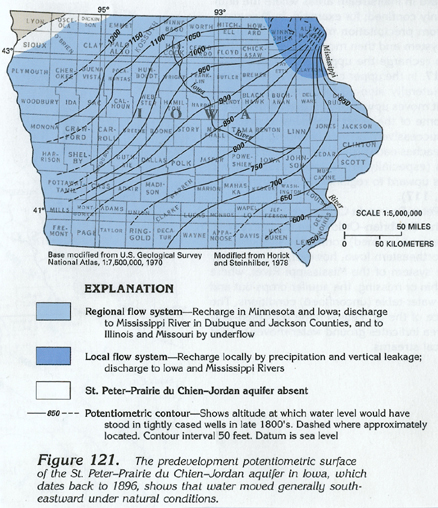
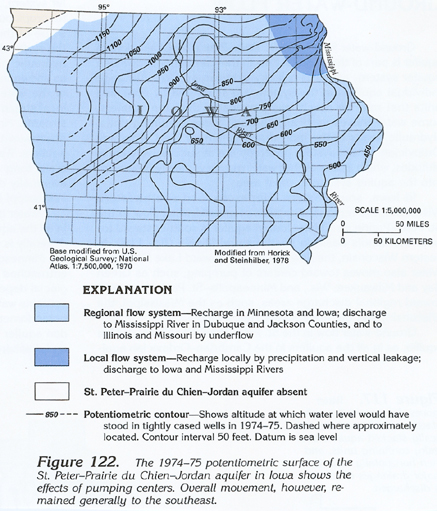
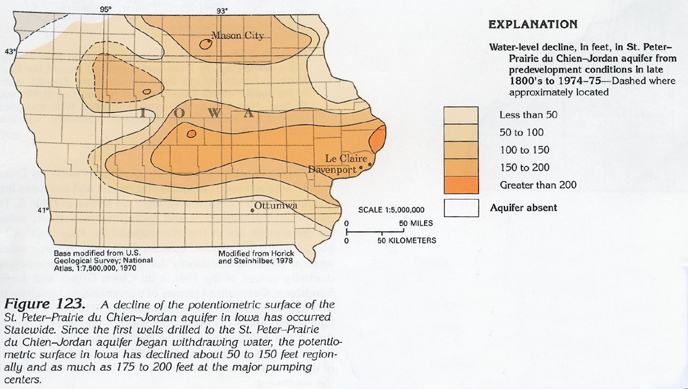
Estimates of the principal inflow and outflow of water to the St. Peter-Prairie du Chien-Jordan aquifer in Iowa are shown in figure 120. The main area of recharge is in north-central Iowa and south-central Minnesota where the aquifer is at a shallow depth and recharge is from precipitation. Recharge also occurs throughout the State as downward leakage from overlying aquifers and confining units. These two sources of recharge equal an estimated 16 billion gallons per year. Aquifer discharge is by two principal means; downgradient movement and withdrawal by wells. The sum of these two methods of discharge from the St. Peter-Prairie du Chien-Jordan aquifer is estimated to be 21.5 billion gallons per year. Comparison of recharge to and discharge from the aquifer indicates a deficit of 5.5 billion gallons per year, which is balanced by a decrease in the volume of water stored in the aquifer. The decrease is reflected by a decline in water levels. Water-level declines in the aquifer from prepumping water levels (dating back to 1896) through 1975 are shown in figures 121, 122, 123.
A map of the potentiometric surface of the St. Peter-Prairie du Chien-Jordan aquifer in Iowa prior to any substantial withdrawals from the aquifer is shown in figure 121. The potentiometric surface of the aquifer in 1974-75 is shown in figure 122. The regional water-level decline, or the difference between these two potentiometric surfaces, is mapped in figure 123. Water-level declines of about 150 feet occurred throughout a substantial part of the aquifer in Iowa in the 78 to 79 years of ground-water withdrawals. Water-level declines of 50 feet or more from predevelopment levels have occurred in an estimated 75 percent of the area of the aquifer.
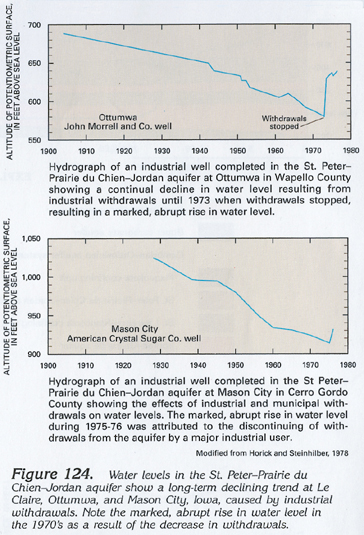
Hydrographs of both short and long duration of water levels in wells completed in the St. Peter-Prairie du Chien-Jordan aquifer in Iowa are shown in figure 124. Each shows a declining trend in water levels, and the longest-term hydrograph (for the well at Ottumwa, fig. 124) indicates a steady decline that totals about 130 feet. The rapid rise of water levels following a decrease in withdrawals is indicated by each of the hydrographs.
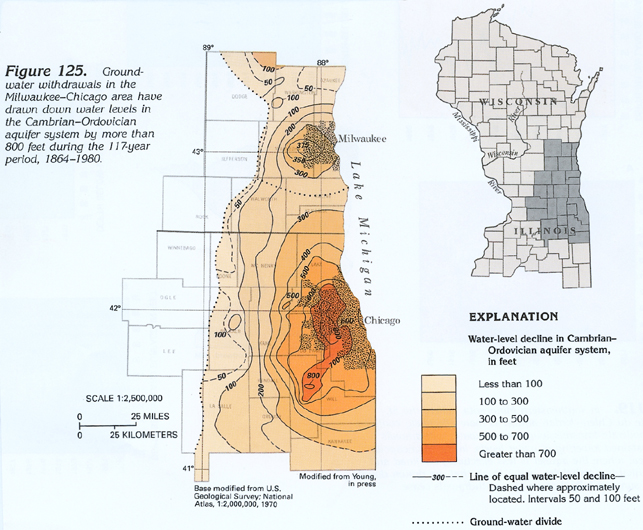
One of the most dramatic effects of ground-water withdrawals known in the United States is illustrated in figure 125. Industrial withdrawals in Milwaukee, Wis., and Chicago, Ill., from the composite Cambrian-Ordovician aquifer system (including the St. Peter-Prairie du Chien-Jordan, the Ironton-Galesville, and the Mount Simon aquifers) have drawn down water levels about 375 feet in Milwaukee and about 800 feet in Chicago during the 117-year period, 1864-1980. Water movement in the aquifers has been changed from the natural flow direction (eastward to Lake Michigan) to radial flow toward the centers of withdrawals in each city. A ground-water divide from which water flows northward to Milwaukee and southward to Chicago is present just south of Milwaukee (fig. 125).
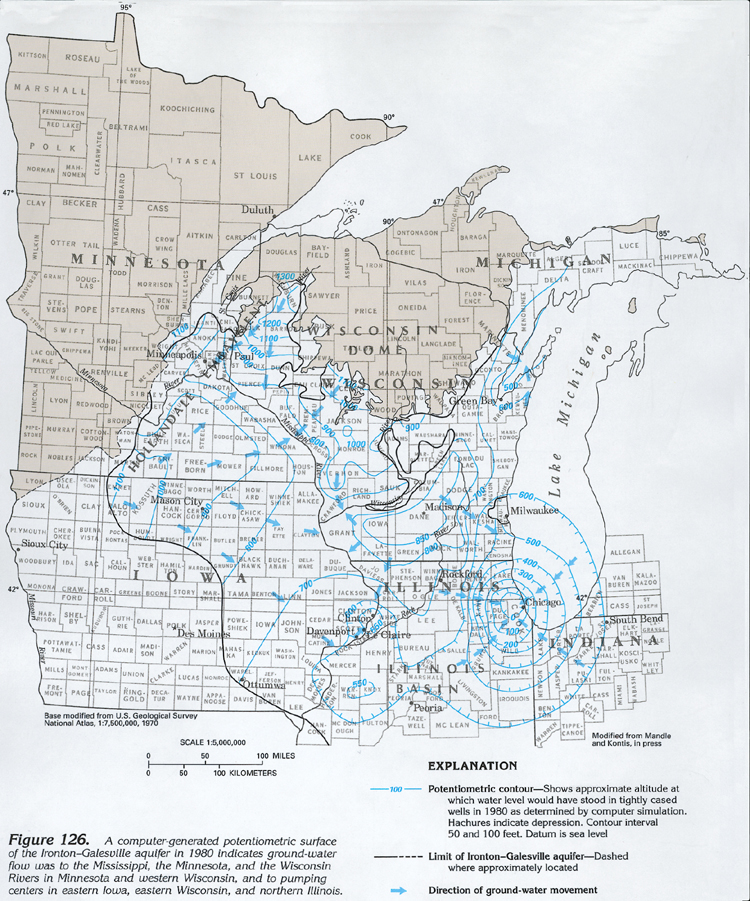
The direction of ground-water flow in the Ironton-Galesville aquifer is shown by a computer-generated map of the potentiometric surface of the aquifer in 1980 (fig. 126). Regional flow in this aquifer, as in the other aquifers in the Cambrian-Ordovician aquifer system, is toward the Mississippi, Minnesota, and Wisconsin Rivers in southeastern Minnesota and western Wisconsin and southeastward in eastern Iowa toward the Illinois Basin. In eastern Wisconsin and northern Illinois, however, the potentiometric surface is dominated by the effects of ground-water withdrawals at Chicago, Ill., Milwaukee and Green Bay, Wis., and Clinton, Iowa. A deep cone of depression in the potentiometric surface at Chicago has coalesced with shallower cones at Milwaukee and Clinton. Flow in the Ironton-Galesville aquifer is toward the cone from all directions. Originally, flow was eastward toward Lake Michigan in eastern Wisconsin and southward toward the Illinois Basin in southern Wisconsin and northern Illinois.
The Ironton-Galesville aquifer is confined where it is overlain by the St. Lawrence-Franconia confining unit in southeastern Minnesota, much of Iowa, and eastern Wisconsin (fig. 126). The aquifer is unconfined to partially confined in extreme northeastern Iowa and in much of Wisconsin on the periphery of the Wisconsin Dome and the Hollandale Embayment. Throughout its area of occurrence, the aquifer is confined below by the Eau Claire confining unit.
Transmissivity values calculated from aquifer tests in 14 wells completed in the Ironton-Galesville aquifer ranged from 200 to 3,000 feet squared per day with a median value of 1,100 feet squared per day. Hydraulic conductivity of the Ironton-Galesville aquifer, as determined from packer tests in 16 wells (including the 14 wells used to calculate transmissivity), ranged from 1.0 to 31 feet per day, with a median value of 8.4 feet per day.
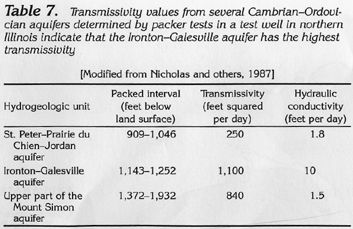
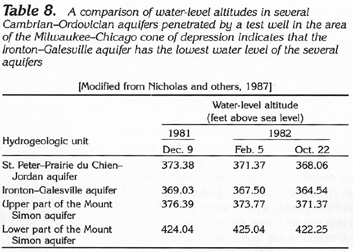
Packer tests were conducted in a deep test well located in extreme northeastern Illinois about halfway between centers of withdrawal in the Chicago-Milwaukee cone of depression. The well penetrated the St. Peter-Prairie du Chien-Jordan aquifer (only the St. Peter Sandstone is present), the Ironton-Galesville aquifer, and the Mount Simon aquifer (which is split into two separate parts by a confining unit in that area). Hydraulic properties of the aquifers, as determined from the packer tests, are summarized in table 7. Static water levels in the several aquifers are presented in table 8. The Ironton-Galesville aquifer has a transmissivity of 1,100 feet squared per day compared to a transmissivity of only 250 and 840 feet squared per day (table 7) for the other two aquifers, and a hydraulic conductivity of 10 feet per day compared to a hydraulic conductivity of only 1.8 and 1.5 feet per day (table 7) for the other two aquifers. The water level in the Ironton-Galesville aquifer also was consistently the lowest of the three aquifers (table 8). Thus, the Ironton-Galesville aquifer is apparently the largest contributor to wells in the Milwaukee-Chicago cone of depression, andwater from overlying and underlying aquifers flows vertically into the Ironton-Galesville in response to withdrawal. Historical water-level declines due to large withdrawals from the Cambrian-Ordovician aquifer system have been about 800 feet without lowering the composite hydraulic head of the aquifer system to the top of the Ironton-Galesville aquifer.
A computer-generated map of the 1980 potentiometric surface of the Mount Simon aquifer is shown in figure 127. The configuration of the potentiometric surface is similar to that of the Ironton-Galesville aquifer (fig. 126) and indicates that ground-water flow in the Mount Simon aquifer is toward the major drains, the Illinois Basin, and cones of depression created by large withdrawals at Milwaukee and Green Bay, Wis., Clinton, Iowa, and Chicago, Ill. Major discharge areas for the Mount Simon aquifer are along the principal rivers in the northern part of the area where depth to the aquifer is at a minimum (fig. 127). Water enters the aquifer at recharge areas at or near the outcrop of the aquifer and moves toward the Mississippi River and its tributaries, the Minnesota, St. Croix, Wisconsin, and Rock Rivers, where it is discharged. In Iowa, where the aquifer is deeply buried, flow is generally south toward the Missouri River in Missouri and southeastward toward the Illinois Basin. In eastern Wisconsin, flow is generally toward cones of depression at Milwaukee and Green Bay.
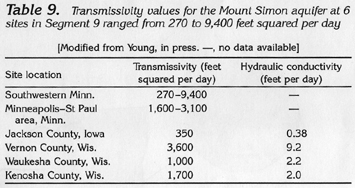
Hydraulic-property data for the Mount Simon aquifer are available from Minnesota, Iowa, and Wisconsin. Representative values of transmissivity and hydraulic conductivity that were calculated from aquifer or packer tests are listed in table 9. Transmissivity values ranged from 270 to 9,400 feet squared per day; the median value was about 1,650 feet squared per day. Hydraulic-conductivity values ranged from 0.38 to 9.2 feet per day; the median was 4.8 feet per day.
GROUND-WATER QUALITY
Water from the St. Peter-Prairie du Chien-Jordan aquifer
is not greatly mineralized in areas where the aquifer crops out
or is buried only to shallow depths, but mineralization increases
downgradient where the aquifer is deeply buried. The distribution
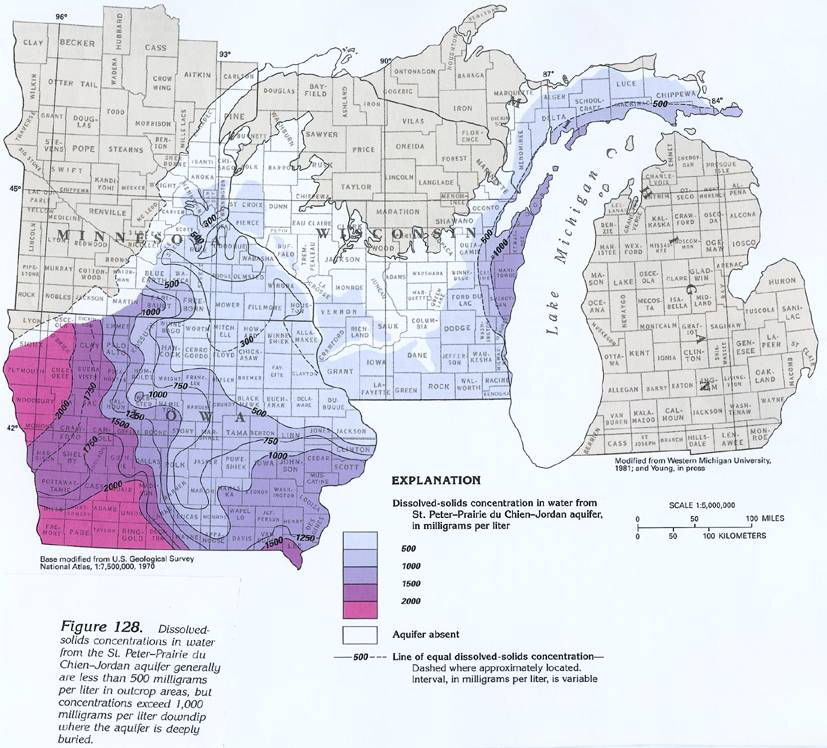
of dissolved-solids concentrations in water from the aquifer (fig. 128) documents this increase. In
much of southeastern Minnesota, northeastern Iowa, southern Wisconsin,
and the Upper Peninsula of Michigan (all areas where the aquifer
is at or near land surface) dissolved-solids concentrations in
water from the aquifer are 500 milligrams per liter or less. Concentrations
of dissolved solids increase to about 2,000 milligrams per liter
to the west and the south in Iowa where the aquifer is deeply
buried. Similarly, dissolved-solids concentrations increase downdip
in eastern Wisconsin and the Upper Peninsula of Michigan as the
aquifer dips into the Michigan Basin and becomes covered by younger
rocks.
The direction of downdip increase of dissolved-solids concentrations in water from the St. Peter-Prairie du Chien-Jordan aquifer in Minnesota and Iowa is approximately perpendicular to the direction of the flow in the aquifer (fig. 116). This is contrary to the usual case, where dissolved-solids concentrations increase downgradient in regional systems. Oxygen-isotope data indicate that water in the aquifer in central Iowa was recharged from a cold-water source. It is theorized that subglacial meltwater moved into the aquifer during Pleistocene time from areas of extremely high hydraulic heads created by the weight of the glacial ice. The chemistry of the water in the aquifer has not yet attained equilibrium; hence, the anomalously small dissolved-solids concentrations.
Major cations in water from the St. Peter-Prairie du Chien-Jordan
aquifer are calcium, magnesium, and sodium; major anions in the
water are bicarbonate, sulfate, and chloride. The patterns of
distribution of concentrations of these cations and anions are
similar to that of dissolved-solids concentrations. Concentrations
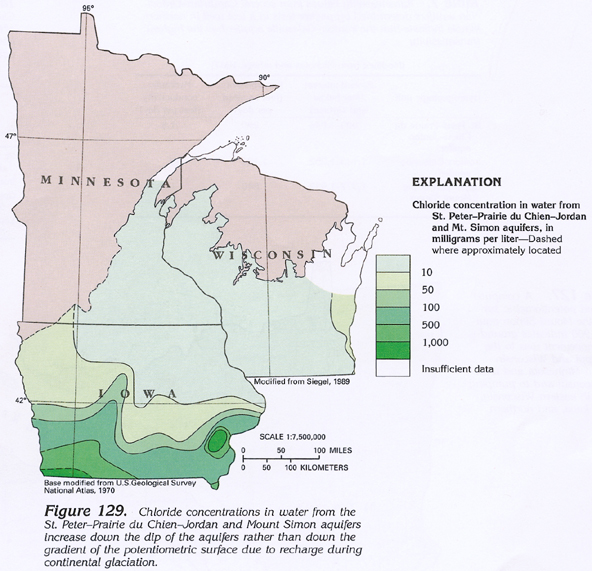
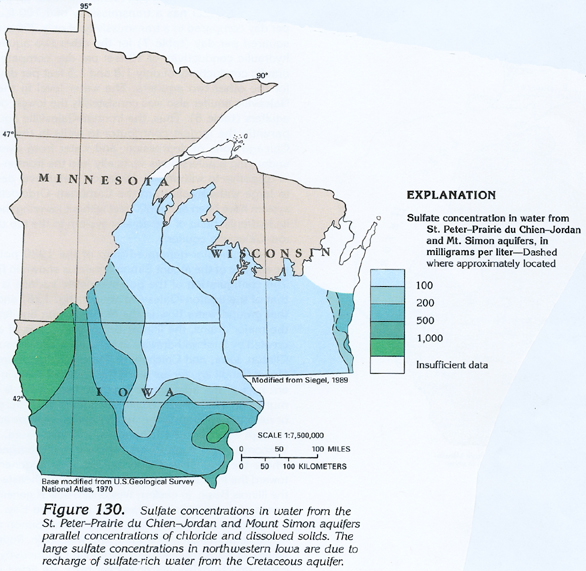
of chloride and sulfate in the combined St. Peter-Prairie
du Chien-Jordan and Mount Simon aquifers are shown in figures 129 and 130.
Concentrations of these ions also are anomalously small in central
Iowa and are similar to those of dissolved-solids concentrations.
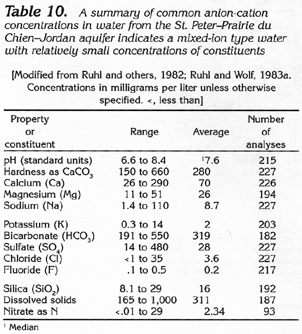
A summary of representative analyses of water from the St. Peter-Prairie
du Chien-Jordan aquifer in Minnesota is presented in table
10. Average values are representative for much of the area
where dissolved-solids concentrations are less than 500 milligrams
per liter (fig. 128). The water is
typically a mixed ion type (table 10)
and locally contains objectionable concentrations of iron and
manganese. Although large concentrations of iron and manganese
inwater are a nuisance, they are not deleterious to health and
are easily removed by water treatment.
Water in the Ironton-Galesville aquifer is a mixed ion type throughout the area of occurrence of the aquifer in Minnesota, Wisconsin, and the Upper Peninsula of Michigan. In Iowa, the aquifer contains freshwater in the extreme northeastern part of the State, but the water rapidly becomes salty southwestward. The southwestward increase in dissolved-solids concentrations in the Ironton-Galesville aquifer also is apparent in Minnesota, where concentrations increase from 300 to 400 milligrams per liter along the Mississippi River to about 1,000 milligrams per liter in the southwestern part of the area of occurrence of the aquifer.
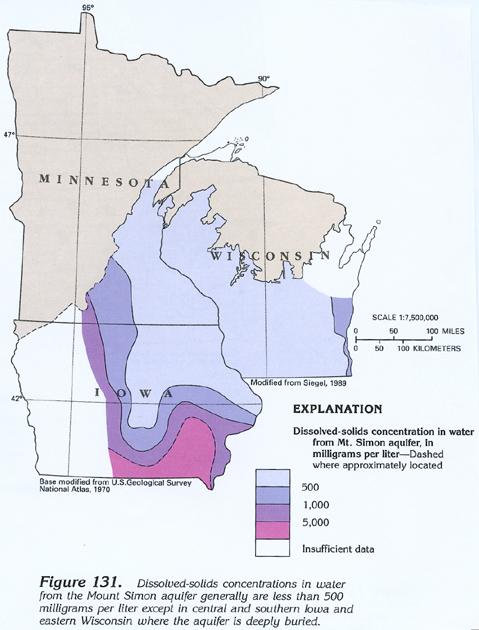
The quality of the water in the Mount Simon aquifer, like that in the St. Peter-Prairie du Chien-Jordan aquifer, is apparently affected by recharge that took place during continental glaciation. The regional distribution of dissolved-solids concentrations in water from the Mount Simon aquifer is shown in figure 131. In the northern area, where water moves along short flowpaths from outcrop recharge areas to nearby rivers, dissolved-solids concentrations are less than 500 milligrams per liter. In areas of Iowa and eastern Wisconsin, however, where the aquifer is deeply buried and flow paths are long, dissolved-solids concentrations increase in a southwestward direction to about 5,000 milligrams per liter. The movement of water in the aquifer is southeastward toward the Illinois Basin. The anomalous south-trending trough in the pattern of dissolved-solids concentrations in central Iowa is postulated to have resulted from recharge during continental glaciation. Water in this part of the aquifer has not yet attained chemical equilibrium with surrounding water in the aquifer.
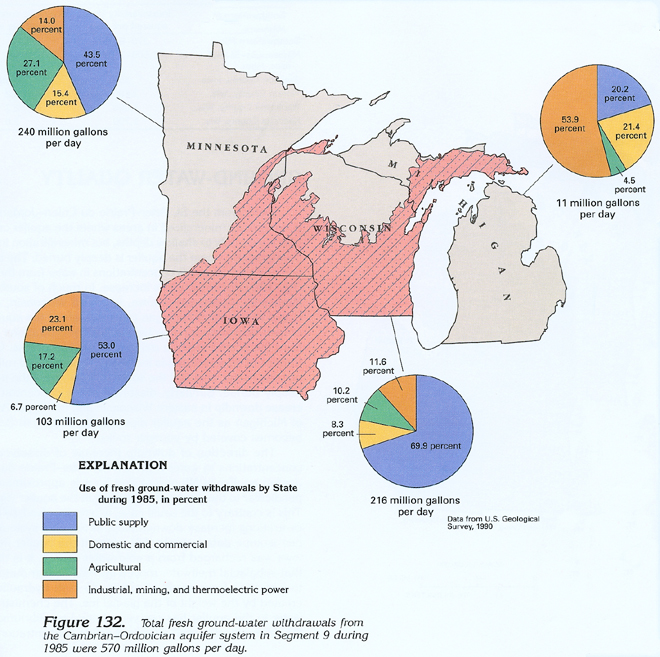
FRESH GROUND-WATER WITHDRAWALS
Total fresh ground-water withdrawals from the Cambrian-Ordovician
aquifer were 570 million gallons per day during 1985 (fig.
132). Most of the water, 54.8 percent, or 312.4 million gallons
per day, was used for public supply; 12.5 percent, or 71.3 million
gallons per day, was used for domestic and commercial purposes;
17.7 percent, or 100.9 million gallons per day, was used for agricultural
purposes; 15 percent, or 85.5 million gallons per day, was used
for industrial, mining, and thermoelectric-power purposes.