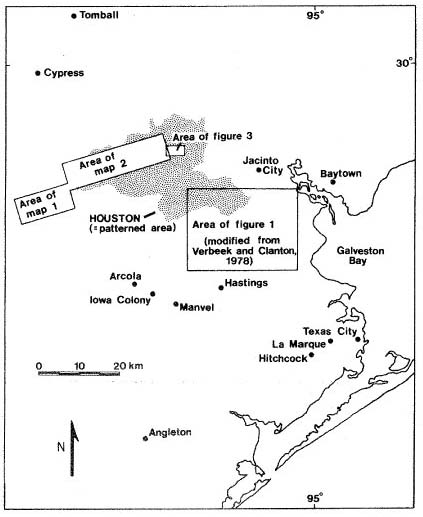
Figure 2. Houston and vicinity, showing areas covered by published 1:24,000-scale fault maps. Additional faults have been mapped in or near every incorporated area (solid circles) shown on figure.
Figure 3 | Contents | Back to Text