
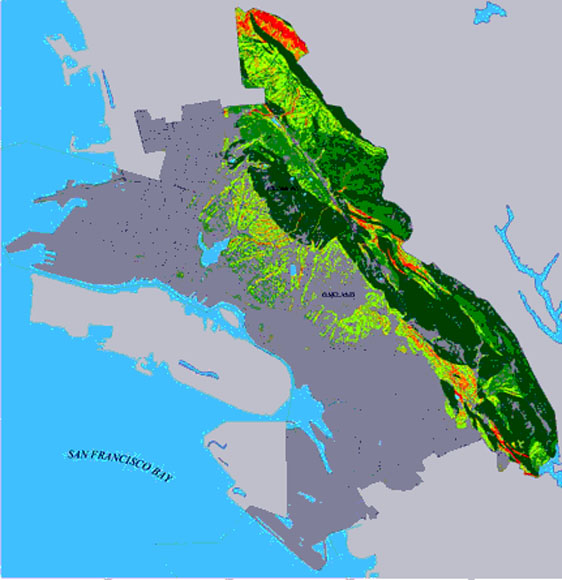
This image of the seismic landslide map of the cities of Oakland and Piedmont shows the differing susceptibilities of both cities to landslides. The highest haraed of most landslide-prone areas are shown in red and yellow while the low hazard landslide-prone areas are shown in green colors; nearly level areas with essentially no landslide susceptible areas are shown in a dark gray tone.
This map depicts a possible scenario of hazards due to earthquake-induced landslides within the cities of Oakland and Piedmont, California. The map is intended as a tool for regional planning. Any site-specific planning or analysis should be undertaken with the assistance of a qualified geotechnical engineer. This hazard map should not be used as a substitute to the State of California Seismic Hazard Zones map for the same area. This map should not be used as a basis to determine the absolute risk from seismically triggered landslides at any locality, as the sole justification for zoning or rezoning any parcel, for detailed design of any lifeline, for site-specific hazard reduction planning, or for setting or modifying insurance rates.
The hazards depicted by this map was modeled for a scenario corresponding to an M7.1 earthquake on the Hayward Fault. This scenario magnitude is associated with complete rupture of the northern and southern segments of the Hayward Fault, an event that has an estimated reoccurance period of about 500 years. The modeled hazard also corresponds to completely saturated ground-water conditions resulting from an extreme storm event or series of storm events. This combination of earthquake and ground-water scenarios represents a particularly severe state of hazard for earthquake-induced landslides. For dry ground-water conditions, the overall hazard will be less, while the relative patterns of hazard are not likely to change.
Levels of hazard depicted by the map should be interpreted on a relative basis. The map includes six levels of relative hazard: Low, Moderately Low, Moderate, Moderately High, High, and Very High. Thus, zones of High hazard should be interpreted as having a modeled hazard that is greater than Moderately High and less than Very High. Zones of Low hazard may be interpreted as having the lowest relative hazard within the mapped area. However, in locations of steep slope or immediate proximity to the Hayward Fault, landslides are possible within zones of Low hazard due to mechanisms not modeled. For the purposes of interpretation, it may be useful to view the modeled hazard as a concentration (for example, number of landslides per square kilometer). Thus, zones of Very High hazard may experience some dense concentrations of landslides, while Low hazard zones will only experience a few isolated landslides. Although the likelihood of slope failure increases with greater levels of hazard, the actual area effected by landslides within each given level of hazard will be only a small to moderate percentage of the overall area of the particular hazard zone. Note that most areas of highest hazard are associated with relatively weak bedrock units east of the Hayward Fault, but that some areas of Moderate to Very High hazard also exist west of the fault, particularly associated with ancient alluvial-fan drainage channels.
Areas of slope less than 5 degrees from the horizontal were not analyzed because of negligible hazard from landslides. However, such areas may be susceptible to liquefaction, and a more complete evaluation for the potential for earthquake-induced ground deformation may be obtained by using this map in combination with a map of liquefaction hazard, such as that published by the California Geological Survey.
The map was created using the 1998 model of Jibson and others. The model is based on the 1965 sliding-block analogy of Newmark that treats a potential landslide as a rigid block resting on an inclined plane. In essence, the procedure considers the factors of earthquake magnitude, distance to the fault, strength of geologic material, ground water conditions, and hill slope. Susceptibility to slope failure was characterized by treating each 10-meter pixel within the map as an infinitely long slope and estimating the earthquake ground motion required to displace the slope. Earthquake ground motion was characterized using the Arias intensity model together with the selected scenario magnitude of M7.1 and the distance of each pixel from the Hayward Fault. The modeling procedure is described in detail within the technical explanation.
In interpreting any hazard map, it is important to consider the limitations of the model employed and the inherent uncertainties in parameterizing the model. The Newmark sliding-block analogy was developed for analyzing man-made dams and embankments, and, thus, does not consider the mechanisms of failure for soil and rock falls, disrupted soil and rock slides, and liquefaction-induced landslides. The 1998 model of Jibson and others and 1993 model of Wilson are well-used alternatives among a number of viable models. Use of different models in the construction of this map may lead to different results, with the relative hazard being similar (see the technical explanation for further information). The uncertainty associated with the model parameters varies with respect to the particular parameter and the level of aggregation (that is, size of support). Due to a lack of earthquake records for the Hayward Fault, the greatest degree of uncertainty is likely associated with the expected levels of earthquake-shaking intensity. The uncertainty associated with the relative strengths between geologic units is smaller. However, the absolute strength within a particular geologic unit is highly variable and, hence, uncertain.
Files available for download:
oakmap.pdf - PDF of hazard map: 36" x 48" (344 kb).
oakpamph.pdf - PDF of map pamphlet (52 kb).
oakpdf.zip - Zipped file containing both map and pamphlet PDF (1 MB).
Note: These PDFs were generated using GNU Ghostscript.
oakeps.zip - Zipped file (file name: oakmap.eps) containing an EPS (Encapsulated PostScript) plot file of hazard map 36" x 48" in size. Fonts are embedded and there are no thumbnails or previews for the EPS file (1.3 MB).
oakdb.zip - Zipped file containing the digital database for this map (1.7 MB).
readme.txt An ASCII text file explaining the contents of the database and other zip files (4 kb).
oakland.met.txt FGDC-compliant metadata (16 kb).
For questions about the scientific content of this report, contact Dave Keefer.
For questions about the files enclosed in the data packages, contact Scott Miles.
Download a free copy of Adobe Reader
This report is available via print on demand.
| Help
| PDF help |
| Publications main page
| Miscellaneous Field Studies Maps |
| Department of the Interior
| U.S. Geological Survey |
| Geologic Division
| Earthquake Hazards Program
| Privacy Statement
| Disclaimer
| Accessibility |
URL of this page is:
https://pubs.usgs.gov/mf/2001/2379/
Please send comments and suggestions, or report problems, to:
Michael Diggles
Updated: April 20, 2007 (bwr)