![]()
The 17 January 1994 Northridge, California, earthquake (M=6.7) triggered more than 11,000 landslides over an area of about 10,000 km². Most of the landslides were concentrated in a 1,000-km² area that includes the Santa Susana Mountains and the mountains north of the Santa Clara River valley. We mapped landslides triggered by the earthquake in the field and from 1:60,000-scale aerial photography provided by the U.S. Air Force and taken the morning of the earthquake; these were subsequently digitized and plotted in a GIS-based format, as shown on the accompanying maps (which also are accessible via Internet). Most of the triggered landslides were shallow (1-5 m), highly disrupted falls and slides in weakly cemented Tertiary to Pleistocene clastic sediment. Average volumes of these types of landslides were less than 1,000 m³, but many had volumes exceeding 100,000 m³. Many of the larger disrupted slides traveled more than 50 m, and a few moved as far as 200 m from the bases of steep parent slopes. Deeper ( >5 m) rotational slumps and block slides numbered in the hundreds, a few of which exceeded 100,000 m³ in volume. The largest triggered landslide was a block slide having a volume of 8X10E06 m³. Triggered landslides damaged or destroyed dozens of homes, blocked roads, and damaged oil-field infrastructure. Analysis of landslide distribution with respect to variations in (1) landslide susceptibility and (2) strong shaking recorded by hundreds of instruments will form the basis of a seismic landslide hazard analysis of the Los Angeles area.
At 4:31 a.m. local time on 17 January 1994, a M-6.7 earthquake struck the Los Angeles metropolitan area in southern California. The earthquake hypocenter was 18 km beneath the city of Northridge in the San Fernando Valley (fig. 1) on a blind thrust fault striking N. 58º W. and dipping 42º southward (Wald and Heaton, 1994).
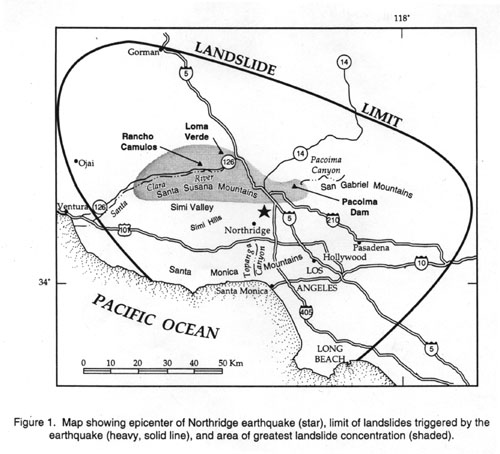 Figure 1.
Map showing epicenter of Northridge earthquake (star), limit of landslides triggered by the earthquake
(heavy, solid line) , and area of greatest landslide concentration (shaded).
Figure 1.
Map showing epicenter of Northridge earthquake (star), limit of landslides triggered by the earthquake
(heavy, solid line) , and area of greatest landslide concentration (shaded).Free-field peak horizontal ground accelerations of about 2 g were recorded at some sites, and high levels of ground shaking extended over a broad region. In addition to inflicting considerable damage to structures, the ground shaking also triggered thousands of landslides over a large area (Jibson and others, 1994a).
We documented, both in the field and from airphotos, more than 11,000 landslides triggered by the Northridge earthquake. Landslide locations, as described below, were digitized and have been plotted on the accompanying computer-generated maps. Plate 1 (UNIX Z compressed 6MB size) shows all of the landslides mapped in the region at 1:100,000 scale; plate 2 shows the area of greatest landslide concentration at 1:50,000 scale. The maps and the discussion in this accompanying text provide an initial overview of our findings, including a brief description of how we mapped the landslides, a regional overview of landslide distribution, characterization of the major types of landslides triggered and brief descriptions of notable major landslides, and discussion of the damaging effects of the landslides. We conclude by describing the procedure to access and download the digital map files via Internet.
![]()
![]()
![]()

![]() U.S. Department of the Interior |
U.S. Geological Survey
U.S. Department of the Interior |
U.S. Geological Survey
URL: http://pubsdata.usgs.gov/pubs/of/1995/ofr-95-0213/ABSTRAC2.HTML
Page Contact Information: GS Pubs Web Contact
Page Last Modified: Wednesday, 07-Dec-2016 15:57:15 EST