
Earthquake Hazards Program
High-Resolution Surface-Seismic Imaging Techniques for NEHRP Soil Profile Classifications and Earthquake Hazard Assessments in Urban Areas
U.S. Geological Survey
Open-File
Report 97-501
(online edition)
By
Robert A. Williams, William J. Stephenson, Jack K. Odum, and David M. Worley
Site
MAY, |
Damage
caused by 1994 Northridge Earthquake
NEHRP
soil type D: ![]() = 245 m/s
= 245 m/s
U.S.
Department of the Interior
U.S. Geological Survey
Golden,
Colorado
1997
This report is preliminary
and has not been reviewed for conformity with U.S.Geological Survey editorial
standards nor with the North American Stratigraphic Code.Any use of trade
names in this publication is for descriptive purposes only and does not
imply endorsement by the U.S.Government.
Abstract
The 17 January 1994 magnitude 6.7 Northridge earthquake caused widespread damage throughout the San Fernando Valley. There were also well-defined zones of significantly higher levels of building damage in the valley, such as in Sherman Oaks and in the vicinity of the California State Northridge campus. Previous aftershock site-response studies indicate that areas with extensive building damage are associated with high levels of ground motion amplification. We acquired high-resolution seismic-refraction data on the ground surface in some of these areas to help explain the earthquake damage patterns and the variation in ground motion. We used these data to determine the compressional- and shear-wave velocities (Vp and Vs) at 20 aftershock recording sites to 30-m depth. Two other sites are located in Sherman Oaks next to 90-m deep USGS boreholes with downhole Vp and Vs data and show that we imaged very similar seismic-velocity structures in the upper 40 m. We acquired two additional profiles in North Hollywood, an area lacking site response data but containing anomalous damage patterns.
In Sherman Oaks, we correlate the areas of high building damage and ground motion south of the Los Angeles River with a thick sequence of low Vs(~ 10 m thick at <185 m/s) and a 10-m deep water table. These deposits are distinct both in seismic velocity and grain size from the deposits located north of the Los Angeles River in Sherman Oaks.
Overall,
high site response appears to be associated with low Vs in
the near surface. Twelve sites can be classified as soil profile type
D using the 1994 NEHRP guidelines (average Vs (![]() )
of 180 to 360 m/s in the upper 30 m). Nine of the sites in this soil
type had aftershock site amplification at least a factor of 3 higher
than a reference site located on rock (Hartzell and others, 1996); the
remaining 3 sites in this group had ground motions amplified by a factor
of 1.8, 2.3 and 2.8. We classified six sites as NEHRP soil type C (
)
of 180 to 360 m/s in the upper 30 m). Nine of the sites in this soil
type had aftershock site amplification at least a factor of 3 higher
than a reference site located on rock (Hartzell and others, 1996); the
remaining 3 sites in this group had ground motions amplified by a factor
of 1.8, 2.3 and 2.8. We classified six sites as NEHRP soil type C (![]() :
360 to 760 m/s), and four of these sites had site amplification factors
above 2.0. One of the type C sites was considered to be a rock site
during the aftershock site response study. Two rock sites were classified
as soil type B (
:
360 to 760 m/s), and four of these sites had site amplification factors
above 2.0. One of the type C sites was considered to be a rock site
during the aftershock site response study. Two rock sites were classified
as soil type B (![]() :
760 to 1500 m/s), and their site amplification factors were 0.7 and 1.5.
:
760 to 1500 m/s), and their site amplification factors were 0.7 and 1.5.
Introduction
The 17 January 1994 magnitude 6.7 Northridge earthquake (Hauksson and others, 1994) ranks as one of the most damaging in history with total economic losses near 20 billion dollars (U.S. Geol. Survey and Southern California Earthquake Center, 1994). The earthquake caused widespread damage throughout the San Fernando Valley (SFV), but there were also well-defined zones of significantly higher levels of building damage in the valley. Heavily damaged areas included Sherman Oaks and several buildings on the California State Northridge campus. Previous studies show that decreasing mean shear-wave velocity in the near surface generally correlates with an increase in the average amplification of earthquake ground motion (Borcherdt, 1970; Borcherdt and Gibbs, 1976; Fumal, 1978). These earlier studies used downhole techniques to determine P- and S-wave seismic-velocity profiles in the upper 30 m of the ground surface. Following the guidelines of earlier studies, but changing the approach slightly, we used seismic-refraction methods on the ground surface to determine the near-surface compressional- and shear-wave velocities. In this study, we (1) report on the Vp and Vs determined for each site, (2) compare our results from two sites with nearby borehole data, (3) describe the correlation of near-surface geology with Vp and Vs, and (4) assess the correlation of site response from Hartzell and others (1996) with our assignment of a 1994 National Earthquake Hazard Reduction Program (NEHRP) (Building Seismic Safety Council, 1994) Vs soil profile type to 20 sites (table 1).
Table 1. NEHRP Soil Profile Type Classifications
|
Soil Profile Type |
Average Shear-Wave Velocity to 30-m depth ( |
|---|---|
|
A |
|
|
B |
760 m/s < |
|
C |
360 m/s < |
|
D |
180 m/s < |
|
E |
|
Nine high-resolution P- and S-wave refraction profiles were acquired at or near the portable seismograph stations established for the U.S.G.S.-Golden Northridge aftershock study (fig. 1; table 2). These sites are in addition to the eleven sites described in Williams and others, (1996) which are also shown in Figure 1. A generalized surficial geology map from Tinsley and Fumal (1985) is also shown in figure 1. In addition, we determined Vp and Vs at four other sites in the SFV: two sites (SOW and SOP) were selected adjacent to recently-drilled holes in Sherman Oaks to compare our results with Vp and Vs data derived from the boreholes (Gibbs and others, 1996). Additionally, two sites (NOHO and BAK) were located in North Hollywood, an area lacking aftershock site response data, to compare an area containing heavier building damage against an area of lighter damage 1.5 km away.
Table 2. Site locations, Vp and Vs, amplification factor, surficial geology, and NEHRP soil type.
|
Site Name |
Latitude (oN) |
Longitude (oW) |
Address |
Average Vp upper 30 m (m/s) |
Average Vs upper 30 m (m/s) |
Vp/Vs |
amplification factor* |
Surficial Geologic Map Unit |
NEHRP Vs Soil Profile Type |
|---|---|---|---|---|---|---|---|---|---|
|
AB1 |
34.2419 |
118.5244 |
On sidewalk, 50 m west of collapsed parking garage, Cal State Northridge |
373 |
268 |
1.4 |
3.1 |
Qyf |
D |
|
ARA |
34.2437 |
118.5701 |
On paved street, Quakertown Ave, Northridge |
563 |
295 |
1.9 |
2.3 |
Qyf |
D |
|
ARG |
34.1405 |
118.4318 |
On soil, near 3826 Benedict Canyon drive, Sherman Oaks |
859 |
454 |
1.9 |
3.1 |
Ts |
C |
|
BAK |
34.1830 |
118.3770 |
On paved street, Bakman Ave, North Hollywood |
592 |
343 |
1.7 |
no data |
Qyc |
D |
|
BLA |
34.1469 |
118.4317 |
On paved street, Mammoth Ave, Sherman Oaks |
907 |
298 |
3.0 |
4.8 |
Qyf |
D |
|
CS1 |
34.2422 |
118.5293 |
On grass, east side of business admin. Building, Cal State Northridge |
377 |
247 |
1.5 |
3.1 |
Qym |
D |
|
ER1 |
34.1450 |
118.5100 |
On soil, 1 km from aftershock recording site, Encino Reservoir |
1507 |
906 |
1.7 |
0.7 |
Ts rock site |
B |
|
GAR |
34.2677 |
118.5202 |
On paved street, 17745 Tribune, Granada Hills |
591 |
363 |
1.6 |
4.4 |
Qym |
C |
|
JQ1 |
34.2920 |
118.5280 |
On paved street, Zelzah Ave, Porter Ranch |
860 |
479 |
1.8 |
2.8 |
Ts rock site |
C |
|
LD1 |
34.1527 |
118.4328 |
On paved street, 4490 Matilija Ave, Sherman Oaks |
902 |
188 |
4.8 |
3.7 |
Qyf |
D |
|
LOS |
34.1664 |
118.5160 |
On paved street, Weddington St., Encino |
978 |
475 |
2.1 |
1.4 |
Qom |
C |
|
MAY |
34.1871 |
118.5486 |
On soil, along L.A. river near VanAlden Ave, Reseda |
930 |
245 |
3.8 |
3.3 |
Qyf |
D |
|
MCK |
34.1545 |
118.4364 |
On paved street, 14000 Valleyheart, Sherman Oaks |
poor data |
224 |
7.3 |
Qyf |
D |
|
|
MUE |
34.2364 |
118.6508 |
On paved street, Woolsey Canyon Dr., Chatsworth |
1515 |
796 |
1.9 |
1.5 |
Ts rock site |
B |
|
NOHO |
34.1690 |
118.3770 |
On soil, along S.P. railway at Lankershim Blvd, North Hollywood |
491 |
250 |
2.0 |
no data |
Qyc |
D |
|
PG1 |
34.2438 |
118.5231 |
On grass, 100 m north of collapsed parking garage, Cal State Northridge |
360 |
244 |
1.5 |
4.1 |
Qyf |
D |
|
POT |
34.2481 |
118.4999 |
On paved street, 16914 Kinzie St., Northridge |
518 |
387 |
1.3 |
2.9 |
Qom |
C |
|
SCH |
34.1508 |
118.4343 |
On paved street, 4410 Stern Ave, Sherman Oaks |
1087 |
206 |
5.3 |
7.6 |
Qyf |
D |
|
SMI |
34.2487 |
118.5444 |
On paved street, Labrador St., Northridge |
499 |
310 |
1.6 |
4.9 |
Qyf |
D |
|
SOP |
34.1610 |
118.4400 |
On grass, Sherman Oaks Park, Sherman Oaks |
743 |
322 |
2.3 |
no data |
Qym |
D |
|
SOW |
34.1540 |
118.4310 |
On paved street, Valleyheart Dr, Sherman Oaks |
829 |
231 |
3.6 |
no data |
Qyf |
D |
|
TRE |
34.2095 |
118.5494 |
On paved street, Lull St., Reseda |
1178 |
237 |
5.0 |
2.8 |
Qyf |
D |
|
UK1 |
34.2567 |
118.5312 |
On grass, near 10216 Rathburn Ave., Northridge |
814 |
370 |
2.2 |
1.5 |
Ts |
C |
|
YK1 |
34.1594 |
118.4322 |
On paved street, 4858 Matilija Ave, Sherman Oaks |
768 |
278 |
2.8 |
1.8 |
Qym |
D |
*amplification factors are from Hartzell and others (1996); Qyf - Holocene fine-grained sediment (silt and clay), Qym - Holocene medium-grained sediment (sand), Qyc - Holocene coarse-grained sediment (gravel), Qom - Pleistocene medium-grained sediment (sand), Ts - Tertiary sedimentary rocks (Tinsley and Fumal, 1985).
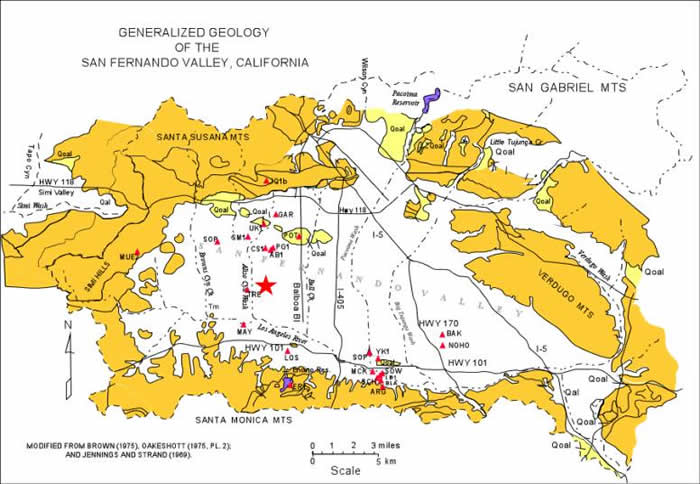
Figure 1. Generalized geologic map of the San Fernando Valley with station locations and site names where P- and S-wave seismic refraction profiles were acquired (red triangles). Sites are roughly co-located with the aftershock recording stations. A red star marks the Northridge main shock epicenter location. Dot-dash lines are streams. Solid lines are major highways. Figure courtesy of John Tinsley. White area of San Fernando Valley is Quaternary or older Quaternary deposits (yellow). Yellow-brown shade represents Tertiary and Mesozoic rocks surrounding the Valley.
The new Sherman Oaks profiles described below were located in the vicinity of the heavily damaged area and extend the comparison (begun in Williams and others, 1996) of the shallow S-wave velocities at sites of higher amounts of building damage (sites BLA, SOW) south of the Los Angeles River, to one site (SOP) in an area of less damage north of the river. To check seismic velocities of the soils near the Los Angeles River outside of Sherman Oaks, we acquired one profile (MAY) at the site of a spectacular apartment collapse on the south edge of the Los Angeles River near the town of Reseda. We also tested site MAY because it is in an area of generally lower damage (the apartment collapse was a relatively anomalous occurrence in the area) as compared to Sherman Oaks. The position of site LOS, located south of the L.A. River in Encino, is similar to that of the Sherman Oaks sites relative to the northern edge of the Santa Monica Mountains and the river. Three ‘rock’ sites ER1, JQ1, and MUE were also tested, but due to space limitations at the aftershock recording stations, the seismic refraction profiles had to be located 1 to 2 km away from them, but still on or within about a meter above of the same mapped geological formation. Three other sites ARA, SMI, and TRE are located on Quaternary alluvium in Northridge and Reseda.
Method
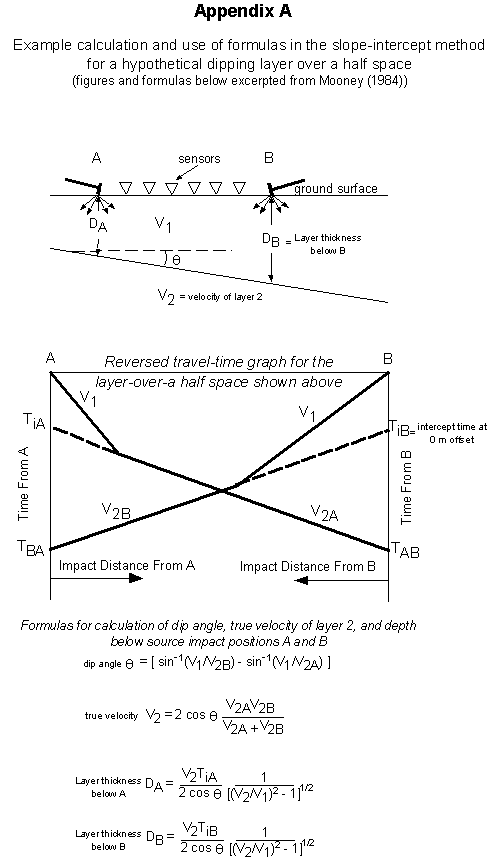
With the exception of the rock profiles, the borehole sites, and the North Hollywood sites, these profiles were acquired within about 50 m of the aftershock recording site. Generally, the aftershock stations were located in the backyard of a private home while the seismic profiles were located on the paved street in front of the residence. We interpreted the data using the slope-intercept method of analysis (Mooney, 1984). A hypothetical dipping two-layer case and the formulas used to calculate the velocity structure by the slope-intercept method are shown in the Appendix. Recording parameters for the data acquired in 1996 are listed in table 3.
Table 3. - Seismic data recording parameters
Recording system: Geometrics StrataView (30 channels)
Sampling interval: 0.001 seconds
Record length: 1 second
Recording format: SEG-2
Geophones: 30 4.5-Hz horizontal, and 30 14-Hz vertical - single component
Geophone array: linear with single phones at 3-m intervals; vertical and shear phones planted within 0.3 m of each other
Source: 4.0 kg sledgehammer on metal plate or 100-kg vacuum-assisted weight drop (P-wave); 4.0-kg sledgehammer on weighted wood timber (S-wave)
Source array: Reversed spreads, multiple off-end shots
Reversed seismic S-wave profiles ranged in length from 87 to 132 m. These S-wave profile lengths resulted in a maximum survey depth range of about 30 m. In some cases no additional layers were detected below about 15 to 20 m. To estimate a maximum imaged depth in these cases, the maximum depth was approximated by assuming that a higher-velocity layer would have been detected on the next geophone beyond the end of the profile (Mooney, 1984). P-wave source energy was stronger for far-offset shots than the S-wave signal because we used a 100 kg vertical weight drop source; consequently, maximum depth ranges were greater and reached about 40 m in some cases.
The shear-wave seismic source consisted of a 4-kg sledgehammer manually impacted on a wooden timber placed on the pavement, weighted down by a vehicle, at right angles to the direction of the profile. As in the previous study, multiple impacts (usually 2 to 8) were summed to increase signal. The data were digitally recorded at 30 positions on the ground by 4.5-Hz horizontal geophones that were spaced at 3-m intervals and oriented transverse to the profile. Reversed polarity seismic energy was produced by striking opposite ends of the timber. The onset of the S-wave energy was usually clearly identified by over plotting normal and reversed polarity records and observing the first high-amplitude phase (fig. 2). Occasionally, there was interference from P- and S-wave phases propagating through the pavement, but these phases attenuated strongly after traveling laterally about 10 m. We picked first-arrival phases assumed to be refracted from the same interface at all recording sites, calculated the velocity from the slope of the line connecting these phases, and then extended the line connecting these phases back to the zero offset point (fig. 2). The interpreted slopes (velocities), intercept times, calculated depths, seismic data, and individual site locations are shown for each site in the Appendix. Generally, alternative interpretations of the slopes of the lines connecting similar arrivals were within about 5 to 10 percent of each other, thus the calculated layer thicknesses determined in this study could vary by 5 to 10 percent. Noisier sites tend to have less certainty in their interpretation because phase arrival times can be obscured or emergent. There are two other limitations underlying this technique: (1) an assumption that layer velocity is constant across the length of the profile, and (2) low-velocity layers underlying a high-velocity layer (velocity inversions) cannot be detected. Given the length of the seismic profiles used in this study, the velocity we calculate for each layer is really an average over the length of the profile, and considering that the level of accuracy needed to get an average Vp and Vs over a 30 m depth interval, assumption (1) is probably not going to significantly affect the result. We also found that at most sites the individual layer velocities of the reversed shots were quite similar, suggesting continuity of layer velocity across the profiles. For assumption (2), we found velocity inversions appear to be a rare occurrence in the San Fernando Valley after examining previously published downhole data from 25 other sites. Significant velocity inversions (>10% change in velocity) were noted for Vp and Vs at only 4 and 2 sites, respectively, among the 25 sites examined. If undetected low velocity layers exist at the sites we studied, the calculated depths of layers below the low-velocity layer will always be greater than the true depths (Mooney, 1984).
Downhole - Surface Refraction Results Comparison
In spite of these assumptions and level of accuracy, the surface-refraction methods we employed in this study appear to generate accurate representations of near-surface Vp and Vs data based on comparison with two seismic velocity downhole profiles determined from co-located shallow boreholes in Sherman Oaks (Gibbs and others, 1996). Incidentally, no velocity inversions were found in the data for these boreholes. For Vp at site SOW our initial interpretation defined 2 layers: an 8-m thick surface layer with Vp of 300 m/s underlain by at least 32 m of deposits with Vp of 1900 m/s. Given the 2.5-m difference in elevation between the borehole and the seismic profile, this initial model agreed or closely agreed with the downhole data in: (1) number of seismically distinct layers, (2) thickness of the surficial layer to within 8%, (3) velocity of surficial layer to within 22%, and, (4) velocity of the second layer to within 8%. After referring to the Vp downhole data, we re-interpretated the refraction data and produced a refined model that decreased the difference in velocities of the surficial layer and second layer from 8% to 6% and from 8% to 7%, respectively (fig. 3). The new Vp depth model increased the thickness of the surficial layer to 9 m, which is still within 8% of the downhole data (fig. 3A).
We followed the same procedure for interpreting Vs data at this site as described for Vp above. In our preliminary Vs model, we interpreted 3 layers (with prospects for a 4th layer) in the upper 50+ m, which compared to 4 layers interpreted in the downhole data. The velocities for the top two layers agreed to within less than 6%, and the thickness of the surficial layer agreed to within 4%. After referring to the downhole data, we had more confidence in including the 4th layer, and the re-interpreted Vs model agreed with the downhole data to within 14% in layer depths and velocities in the upper 50+ m (fig. 3A).
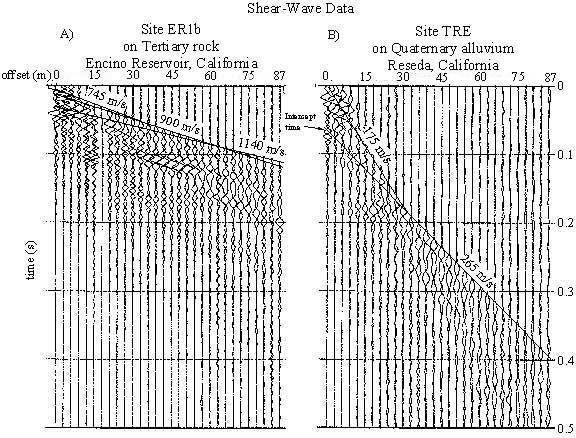
Figure 2. A) Shear-wave profile recorded at site ER1b, a rock site with the lowest site amplification measured by Hartzell and others (1996). B) Shear-wave profile recorded at site TRE on Quaternary alluvium in Reseda, California. Shear-wave source is at the zero-offset position in both profiles. Reverse polarity traces were generated by striking opposite ends of the source. Heavy lines on the data mark the distinct onset of S-wave arrivals emanating from a subsurface layer with common seismic velocity (annotated above the line).
At site SOP we generated a final interpretation of the refraction data without knowledge of the downhole data. The two data sets show similar numbers of layers in the upper 40 m, very similar velocities (average difference of 13% for Vp and 7% for Vs), and comparable layer thicknesses averaging 7% difference for Vp and 8% for Vs, assuming the two intermediate layers in the shear-wave refraction data are equivalent to the single layer interpreted in the downhole data over the same general interval (fig. 3B). These comparisons and the ones described in Williams and others (1996), gives us confidence that this time-tested method is a valid technique for determining near-surface seismic P and S velocities.
Vp and Vs, Nehrp Site Classifications, and Site Response
Sherman Oaks
A previous study of aftershocks by Hartzell and others (1996) showed that the Sherman Oaks area south of the Los Angeles (L.A.) River produced some of the largest site amplification factors in the San Fernando Valley. This area also contains a characteristic sequence of surficial deposits with low Vs that correlates with the high site response and greater amounts of building damage (Williams and others, 1996). We acquired three new sites in the Sherman Oaks area BLA, SOW, and SOP, two of them south of the L.A. River (fig. 1), that have similar velocity structures to the 5 Sherman
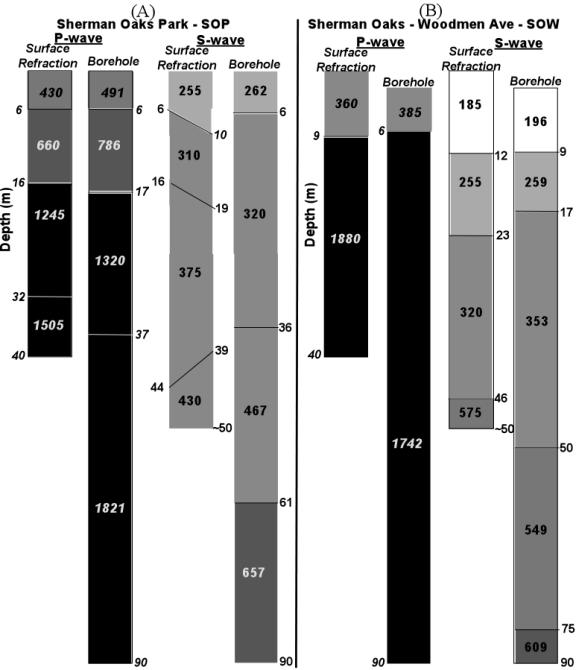
Figure 3. (A) Comparison of downhole and surface-refraction methods interpretations of Vp and Vs seismic velocity structures at site SOP. Annotated seismic velocities are in meters/second. (B) Comparison of downhole and surface-refraction methods interpretations of Vp and Vs seismic velocity structures at site SOW. Offset of refraction and borehole results shows 2.5 elevation difference between the two locations. Ninety-meter depth positions are not to scale.
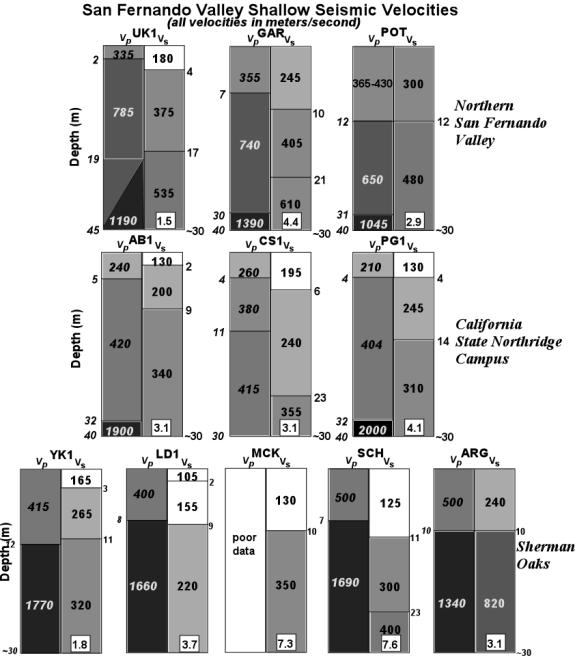
Oaks profiles shown in Williams and others (1996). Because the previous results are discussed frequently in this report they are included in this report as Figure 4. The two new sites south of the L.A. River have the characteristic 10- to 12-m thick deposit at the surface with Vs below 200 m/s and the relatively high water table indicated by a Vp of about 1500 m/s at 6 to 9 m depth (fig. 5). Site SOP is located about 550 m north of the River and, like the one other Sherman Oaks site (YK1) surveyed north of the river (Williams and others, 1996), is characterized by a slightly higher Vs at the surface (255 m/s). The water table depth at site SOP is uncertainly determined to be between 16
|
Figure 4. P- and S-wave velocity interpretations to about 30-m depth for the 11 refraction profiles described in Williams and others (1996). Site names annotated at the top of each rectangle. Seismic velocities are annotated in the shaded boxes. Boxes are shaded according to velocity value; the lower the velocity the lighter the shading. The small box inset at the bottom of the S-wave velocity column gives the mean shear wave site response amplification factor between 2 and 6 Hz (Hartzell and others, 1996) that is discussed in the text.
and 32 m depth. This lack of certainty is created by the presence of a layer with a seismic velocity of 1245 m/s at 16 m depth that is probably partially saturated. Usually, a water-saturated unconsolidated deposit has a seismic velocity of about 1500 to 1600 m/s. This compares to about 12 m depth for site YK1, though this difference could be partially the result of a one year time difference between measurements. These sites in the Sherman Oaks area clarify the difference in Vp and Vs structure between the north and south sides of the river. This difference in seismic velocity structure may be related to a clear difference in grain size of mapped Holocene alluvial deposits (Tinsley and Fumal, 1985). Generally, north of the L.A. River in Sherman Oaks the deposits are mapped as medium-grained Holocene deposits, while south of the river they are mapped as fine-grained Holocene deposits.
Encino-Tarzana-Reseda
To compare
seismic velocities from Sherman Oaks to other sites near the Los Angeles
River we acquired: 1) profile LOS 2 km south of the river in Encino,
Calif.; 2) profile MAY 30 m south of the channelized L.A. River; and
3) profile TRE 2 km north of the river in Reseda (fig. 1). All sites
are located on Quaternary alluvium, but LOS is located on Pleistocene
deposits while MAY and TRE are located on Holocene deposits (Tinsley
and Fumal, 1985). Site MAY was acquired on the ground surface where
a series of collapsed 2-story apartment buildings within a single complex
were built over ground-level open carports (see title page photograph). The
apartments were red-tagged and demolished after the earthquake and we
were able to acquire the seismic profile on the soil where the old carports
were located and the new apartments were being constructed. The Vp and
Vs structure at MAY and TRE closely resemble
the velocities observed south of the L.A. River in Sherman Oaks (fig.
5), although some
of the Sherman Oaks sites are about 20 to 30% slower in Vs in
the upper 10 m. Each of these sites has at least 25 m of deposits with
a Vs from 170 to 270 m/s and a water table
at less than 10 m depth, thus both sites are classified as soil profile
type D. Site
TRE is about 500 m west of the Aliso Canyon Wash which could produce
a high water table and thus a velocity structure more similar to a site
near the L.A. River. The site amplification factors for sites MAY and
TRE, however, are in the moderate range at 3.3 and 2.8, respectively
(Hartzell and others, 1996). In contrast, possibly because site LOS
is located on older, more compacted alluvium, the average ![]() data
from this site classify it as soil type C. There is a layer with a 415
m/s velocity (soil profile type C) within 3 to 5 m of the surface (fig.
5), a much different structure than the Sherman Oaks sites and a correspondingly
lower site amplification factor of 1.4. The water table depth at 11
m for site LOS, however, is quite similar to sites in Sherman Oaks. The
results from site MAY and TRE indicate that the average seismic velocity
structures in the upper 30 m of the Sherman Oaks sites south of the river
are not unique, but the Sherman Oaks sites have the slowest Vs profiles
in the upper 10 m of those investigated in the San Fernando Valley.
data
from this site classify it as soil type C. There is a layer with a 415
m/s velocity (soil profile type C) within 3 to 5 m of the surface (fig.
5), a much different structure than the Sherman Oaks sites and a correspondingly
lower site amplification factor of 1.4. The water table depth at 11
m for site LOS, however, is quite similar to sites in Sherman Oaks. The
results from site MAY and TRE indicate that the average seismic velocity
structures in the upper 30 m of the Sherman Oaks sites south of the river
are not unique, but the Sherman Oaks sites have the slowest Vs profiles
in the upper 10 m of those investigated in the San Fernando Valley.
Northwestern San Fernando Valley
We profiled sites ARA and SMI in the northwestern part of the San Fernando Valley. Both have the same mapped surficial geology, similar near-surface seismic velocities, but differ by a factor of two in site amplification (table 2). Both sites are also located on fine-grained Holocene alluvium and are located within 100 m of fluvial washes. We found that these sites have a 5% difference in average Vs in the upper 30 m (295 m/s vs. 310 m/s) and are thus both classed as soil type D. The difference in average Vp is 11% (563 m/s vs. 499 m/s) (table 2). From these similar velocity profiles, the difference in site amplification at site SMI of 4.9 versus 2.3 at site ARA (Hartzell and others, 1996) is not explainable. Among other possible reasons the focusing effects of deeper structures may be responsible for the difference.
North Hollywood - Southeastern San Fernando Valley
Measured by the number and density of red-tagged buildings, the commercial-industrial area along Lankershim Blvd in North Hollywood sustained an anomalously high amount of building
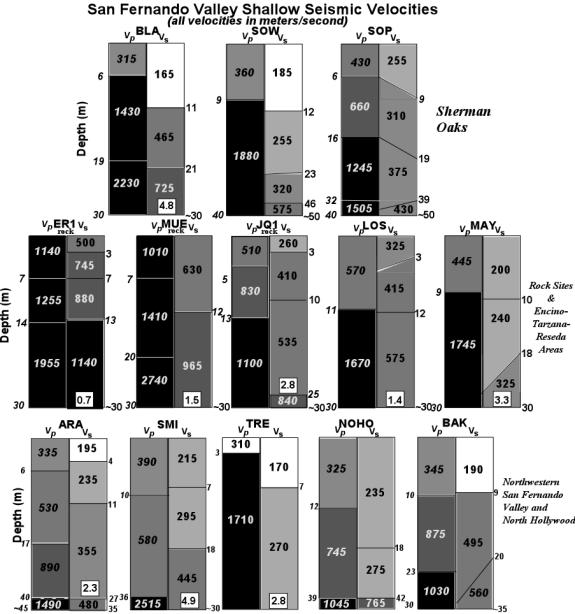 |
Figure 5. P-
and S-wave velocity interpretations to about 30-m depth for the 13 refraction
profiles with site names annotated at the top of each rectangle. Seismic
velocities are annotated in the shaded boxes. Boxes are shaded according
to velocity value; the lower the velocity the lighter the shading. The small
box inset at the bottom of the S-wave velocity column gives the mean shear
wave site response amplification factor between 2 and 6 Hz (Hartzell and
others, 1996) that is discussed in the text.
damage as compared to the surrounding parts of the community (fig. 1). Although no aftershock site amplification values are available for this area, we decided to compare the difference in near-surface seismic velocities between site NOHO in a heavily damage zone to site BAK outside this zone (fig 1). We found that the average Vs in the upper 30 m at site NOHO at 250 m/s (class D) is significantly slower than the 343 m/s (class D) average at site BAK (table 2). Though both sites are located on the same mapped unit, Holocene coarse-grained alluvium (Tinsley and Fumal, 1985), the central branch of the Tujunga Wash, 500 m from site NOHO and 1.8 km from BAK, probably more frequently supplied loosely consolidated deposits to site NOHO and lesser amounts to site BAK. This may help explain the difference in near-surface seismic velocities. Although there is a difference in building type between these two locations, it appears that low Vs in the near-surface of North Hollywood probably increased the site response and contributed to the higher levels of building damage along Lankershim Blvd.
Rock Sites
Three rock sites were profiled in this study and significant
differences were found in near-surface velocity that appear to explain
part of the measured differences in site amplification. The rock sites
are located in the Santa Monica Mountains (ER1b), Simi Hills west of
the SFV (MUE2), and the Santa Susana Mountains (JQ1b) north of the SFV
(fig. 1). These sites are located on three different mapped geologic
rock types. Site ER1b is located on the Topanga Formation, which consists
of a conglomerate with an average Vs and Vp of
906 m/s and 1507 m/s, respectively (table 2 and fig. 5) at the profile
location. This average Vs classifies site ER1b as soil profile
type B. This is the highest average![]() found
among the 24 sites studied, it is also the site with the lowest site
amplification factor in the SFV (Hartzell and others, 1996). Site MUE2
had the second lowest site amplification factor at 1.5 (Hartzell and
others, 1996) and is located on the Chico Formation (sometimes called
the Chatsworth Formation in this area), a massive brown sandstone at
the profile location and at the aftershock station. The 796 m/s
found
among the 24 sites studied, it is also the site with the lowest site
amplification factor in the SFV (Hartzell and others, 1996). Site MUE2
had the second lowest site amplification factor at 1.5 (Hartzell and
others, 1996) and is located on the Chico Formation (sometimes called
the Chatsworth Formation in this area), a massive brown sandstone at
the profile location and at the aftershock station. The 796 m/s ![]() at
this site is about 12% slower than at site ER1b and also classifies site
MUE2 as a soil profile type B. The 1515 m/s
at
this site is about 12% slower than at site ER1b and also classifies site
MUE2 as a soil profile type B. The 1515 m/s ![]() at
MUE2 is about 8% faster than at site ER1b. Although there is a correlation
between lower Vs and higher site amplification at MUE2 than
at ER1b, the velocity difference appears to be too small to explain the
factor of 2 difference in site amplification. The third ‘rock’ site,
JQ1b, is located on the lower member of the Saugus Formation and had
an average site amplification factor of 2.5 (Hartzell and others, 1996;
table 2). This level of site response is more like that of an unconsolidated
alluvial site. The higher site amplification here may be partially explained
by the relatively low
at
MUE2 is about 8% faster than at site ER1b. Although there is a correlation
between lower Vs and higher site amplification at MUE2 than
at ER1b, the velocity difference appears to be too small to explain the
factor of 2 difference in site amplification. The third ‘rock’ site,
JQ1b, is located on the lower member of the Saugus Formation and had
an average site amplification factor of 2.5 (Hartzell and others, 1996;
table 2). This level of site response is more like that of an unconsolidated
alluvial site. The higher site amplification here may be partially explained
by the relatively low ![]() of
479 m/s (table 2 and fig. 5). This Vs places JQ1b in soil
profile type C, a different classification than the other two rock sites
described above. The 860 m/s
of
479 m/s (table 2 and fig. 5). This Vs places JQ1b in soil
profile type C, a different classification than the other two rock sites
described above. The 860 m/s ![]() at
JQ1b is also slower than the other two rock sites and suggests that the
near-surface deposits at this site are much more loosely consolidated. This
inference is supported by observing that consolidated rock is exposed
in outcrops at the other two rock sites, while a roadcut, adjacent to
the seismic profile at JQ1b, exposed outcrops of friable sandstone of
the Saugus Formation. The variety of site amplifications and near-surface
seismic-velocity profiles at these ‘rock’ sites emphasizes that not all
rock sites will have the same seismic response, as noted by Boore and
Joyner (1997), or fit the same NEHRP site classification.
at
JQ1b is also slower than the other two rock sites and suggests that the
near-surface deposits at this site are much more loosely consolidated. This
inference is supported by observing that consolidated rock is exposed
in outcrops at the other two rock sites, while a roadcut, adjacent to
the seismic profile at JQ1b, exposed outcrops of friable sandstone of
the Saugus Formation. The variety of site amplifications and near-surface
seismic-velocity profiles at these ‘rock’ sites emphasizes that not all
rock sites will have the same seismic response, as noted by Boore and
Joyner (1997), or fit the same NEHRP site classification.
Conclusions
Using seismic-refraction methods on the ground surface we have interpreted the seismic velocity structure in the upper 30 m at 13 sites to complement 11 others previously acquired by Williams and others (1996). Twenty of these sites were previously used as aftershock recording stations for a site response study of the Northridge earthquake. The technique is non-invasive, relatively fast (the data from 2 to 3 sites can be acquired in one day), and can be used on the city streets of populated areas at the site of interest in most cases. To check the accuracy of these methods, we co-located two profiles at two different boreholes with known Vp and Vs velocity structures. We found that without knowledge of the borehole data, we can produce a velocity structure by our methods that is within about 5 to 15 percent different than the borehole data in the upper 40 to 50 m in terms of seismic velocities and layer thicknesses. Thus the seismic refraction method appears to be a valid substitute for downhole surveys if only seismic velocity information in the upper 30 to 40 m is needed.
Using the seismic refraction data we also categorized the sites, including those described in Williams and others (1996), according to the soil and rock classification scheme defined by the NEHRP. We found that of the 20 sites studied that also have site response data, twelve of the sites can be classified as soil profile type D, six sites as type C, and two sites as type B. These site classifications appear to be valid predictors of increased earthquake ground shaking as 92% of the sites in class D had site amplification factors above a factor of 2 and two of these sites had amplification factors above 7.0, which were the highest measured by Hartzell and others (1996); 67% of the sites in class C had ground motions that were amplified above a factor of 2, and none of the class B sites were amplified above a factor of 1.5. The weakness in these soil-type classifications and in attempts to correlate site response with Vs, is that there can be a wide range of site amplifications for a given soil type or Vs. This suggests that other factors, such as deep structures, that could tend to amplify or de-amplify seismic waves, can strongly influence earthquake ground motion at the surface. Thus, at this point, knowing a sites average Vs to 30-m depth will not permit precise prediction of the level of shaking, but it does appear to allow predictions that ground shaking will be amplified above a factor of 2 for moderate-sized earthquakes.
A few of the differences in NEHRP site types may possibly be explained by looking at geologic rock type, age, or grain size of the alluvial deposits. For example, of the nineteen sites we studied which are located on what is mapped as recent (Quaternary) alluvium (Tinsley and Fumal, 1985), we placed three in soil type C and 16 in soil type D (all type D sites were located on recent alluvium). Two type C sites stand out because they are located on Pleistocene deposits, while all of the other sites are located on Holocene deposits that span a range of grain sizes from coarse to fine (Tinsley and Fumal, 1985). We also studied two sites in North Hollywood that lacked site response data, but were quite different in terms of the amount of building damage. With our data, we classified the site with higher amounts of red-tagged building damage surrounding it as NEHRP soil type D and the site with lesser amounts of building damage also as a type D. These two sites are both located on mapped coarse-grained Holocene alluvium.
Compared to the sites on alluvium, the differences
in site type among the three rock sites can be easily seen in the differences
in mapped rock type, measured Vs, and nearby outcrop. The
three ‘rock’ sites were found to fall into site classes B and C with
the class C ‘rock’ site having a factor of about 2 to 3 greater average
site amplification than the two rock sites in class B. With a ![]() under
1000 m/s, all three ‘rock’ sites described in this study appear to fit
into Boore and Joyner’s (1997) ‘tectonically active region rock site’
class versus the ‘very hard rock site’ class with average Vs in excess
of 2 km/s.
under
1000 m/s, all three ‘rock’ sites described in this study appear to fit
into Boore and Joyner’s (1997) ‘tectonically active region rock site’
class versus the ‘very hard rock site’ class with average Vs in excess
of 2 km/s.
Three sites
in the Sherman Oaks area confirmed the difference in near-surface seismic
velocity structure north and south of the Los Angeles River that was
interpreted by Williams and others (1996). These two regions are also
clearly differentiated in their physical properties by grain size (Tinsley
and Fumal, 1985). Both regions are mapped as Holocene alluvium with
medium-sized grains generally north of the river and predominantly fine
grained south of the river. But two profiles outside the Sherman Oaks
area and in the vicinity of the Los Angeles River demonstrate that the
low ![]() and
high water table found in Sherman Oaks south of the Los Angeles River
are not entirely unique.
and
high water table found in Sherman Oaks south of the Los Angeles River
are not entirely unique.
Acknowledgments
We thank John Michael of the U.S. Geological Survey for digitally drafting figure 1. We are grateful to Dr. Mary Templeton (Calif. State Univ. Fullerton) for providing a weight-drop seismic source used in this study. The manuscript was improved by a review from Edward Cranswick. This study was supported by NEHRP funding.
References
Boore, D.M., and W.B. Joyner, 1997, Site amplifications for generic rock sites: Bull. Seis. Soc. Am., v. 87, no. 2, p. 327-341.
Borcherdt, R.D., 1970, Effects of local geology on ground motion near San Francisco Bay: Seism. Soc. Am. Bull., v. 60, no. 1, p. 29-61
Borcherdt, R.D., and J.F. Gibbs, 1976, Effects of local geological conditions in the San Francisco Bay region on ground motions and the intensities of the 1906 earthquake: Seism. Soc. Am. Bull., v. 66, no. 2, p. 467-500.
Building Seismic Safety Council, 1994, NEHRP recommended provisions for seismic regulations for new buildings, Part 1-Provisions, Federal Emergency Management Agency, 290 p.
Fumal, T.E., 1978, Correlations between seismic wave velocities and physical properties of near-surface geologic materials in the southern San Francisco Bay region, California: U.S. Geological Survey Open-File Report 78-1067, 114 p.
Gibbs, J.F., Tinsley, J.C., and W.B. Joyner, 1996, Seismic velocities and geological conditions at twelve sites subjected to strong ground motion in the 1994 Northridge, California, Earthquake: U.S. Geological Survey Open-File Report 96-740, 103 p.
Hartzell, S., Leeds, A., Frankel, A., and J. Michael, 1996, Site response for urban Los Angeles using aftershocks of the Northridge earthquake: Seism. Soc. Am. Bull., v. 86, no. 1B, p. S168-S192.
Hauksson, E., Hutton, K., Kanamori, H., Jones, L., and Mori, J., 1994, The Mw6.7 Northridge, California, earthquake of January 17, 1994, and its aftershocks: 89th Annual Meeting 1994, Seismological Society of America, in meeting program for Northridge abstracts.
Mooney, H.M., 1984, Handbook of geophysical exploration, volume 1, seismic: Bison Instruments, Inc.
Tinsley, J.C., and T.E. Fumal, 1985, Mapping Quaternary sedimentary deposits for areal variations in shaking response, in Evaluating earthquake hazards in the Los Angeles region-an earth-science perspective, U.S. Geological Survey, Professional Paper 1360, p. 101-125.
Scientists of the U.S. Geological Survey and Southern California Earthquake Center, 1994, The magnitude 6.7 Northridge, California, earthquake of 17 January 1994: Science, v. 266, p 389-397.
Williams, R.A., Stephenson, W.J., Odum, J.K., and Worley, D.W., 1996, Shallow P- and S-wave velocities from eleven aftershock recording stations of the Northridge Earthquake, San Fernando Valley, California: U.S. Geological Survey Open-File Report 96-261, 10 p.
 D D |
| AccessibilityFOIAPrivacyPolicies and Notices | |
| |
|