Survey Number 6--SIDESCAN SONAR IMAGE, SURFICIAL GEOLOGIC INTERPRETATION, AND BATHYMETRY OF THE LONG ISLAND SOUND SEA FLOOR AROUND FALKNER ISLAND, CONNECTICUT
Lawrence J. Poppe1, Ralph S. Lewis2, Jane F. Denny1, Mary L. DiGiacomo-Cohen2, and Kenneth F. Parolski1
1U.S. Geological Survey, Woods Hole, MA 02543
2Long Island Sound Resource Center, Connecticut Geological and Natural History
Survey,
Department of Environmental Protection, 1084 Shennecossett Road, Avery Point, Groton, CT
06340
Ongoing research by the U.S. Geological Survey in Long Island Sound, a major U.S. east-coast estuary surrounded by the most densely populated region of the United States, is building upon cooperative research with the State of Connecticut that was initiated in 1982. During the initial phase of this cooperative program, geologic framework studies in Long Island Sound were completed (Lewis and Needell, 1987; Needell and others, 1987; Lewis and Stone, 1991). The emphasis of the present program in the Sound is directed toward studies of the sediment distribution, processes that control this sediment distribution, nearshore environmental concerns, and the relationship of benthic community structures to the sea floor geology.
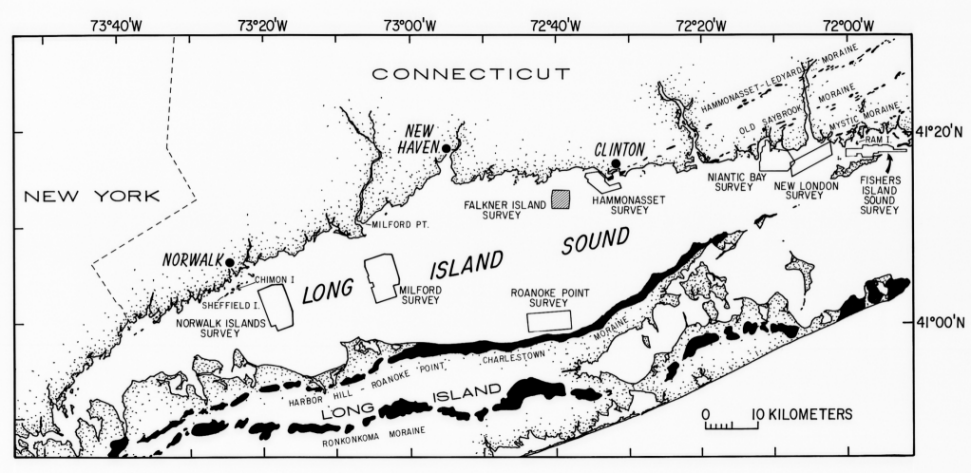
Because of the enormous surrounding population, large inputs of anthropogenic wastes and toxic chemicals have produced stresses on the environment of the Sound, causing degradation and potential loss of benthic habitats (Koppleman and others, 1976; Long Island Sound Study, 1994). Due to this environmental problem, we are constructing sidescan sonar mosaics (complete-coverage acoustic images) within specific areas of special interest (fig. 1) to define the geological variability of the sea floor, one of the primary controls of benthic habitat diversity; to provide a detailed framework for future research, monitoring, and management activities; and to improve our understanding of the processes that control the distribution of bottom sediments, benthic habitats, and associated infaunal community structures. Because precise information on environmental setting is important to the selection of sampling sites and to the accurate interpretation of point measurements, the sidescan mosaics also act as base maps for subsequent sedimentological, geochemical and biological observations. This particular study covers the sea floor around Falkner Island (fig. 1).
The Connecticut Coastal National Wildlife Refuge, which was established by an act of Congress on October 22, 1984 and later redesignated the Stewart B. McKinney National Wildlife Refuge, is part of the National Wildlife Refuge System. This system constitutes an array of federal lands overseen by the U.S. Fish and Wildlife Service that are set aside primarily for the benefit of wildlife, for managing biodiversity, and for the protection of unique ecosystems. The refuge is made up of Milford Point and four islands: Chimon and Sheffield Islands off Norwalk, Ram Island at the mouth of the Mystic River, and Falkner Island (Giampa, 1986a; fig. 1).
Falkner Island's inaccessibility has allowed it to remain relatively undeveloped and to become a refuge for rare and environmentally sensitive fauna and flora that have been unable to survive elsewhere along the mainland coast. For example, the island is Connecticut's only significant habitat for Roseate Terns and the nesting area for 80 percent of Connecticut's population of Common Terns (Giampa, 1986a,b).
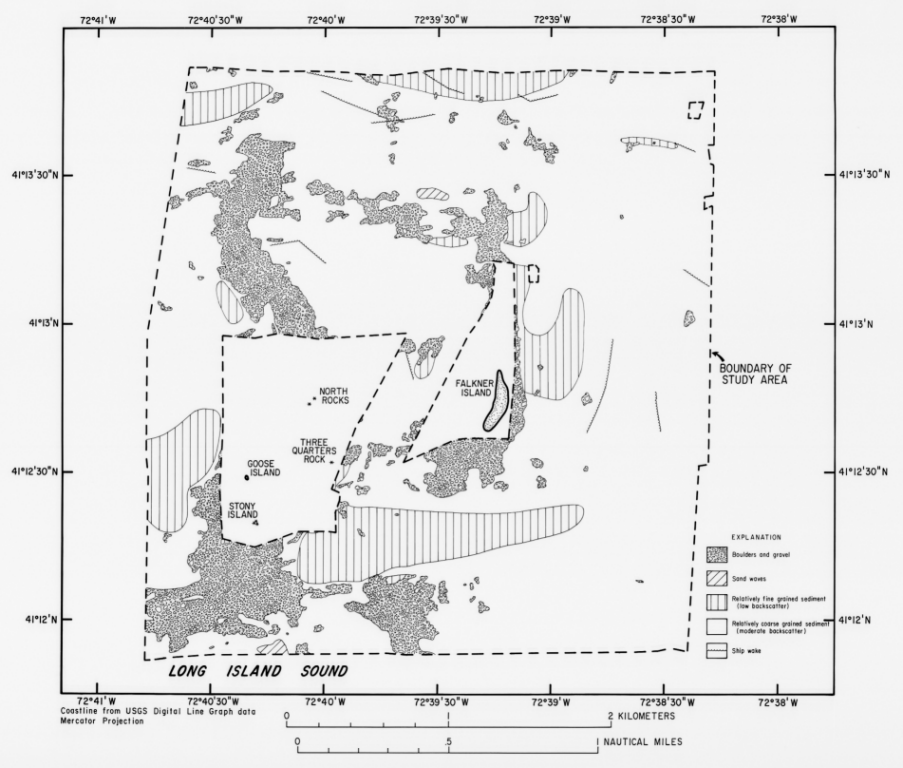
Long Island Sound, the water-filled part of a drainage basin that covers 39,120 km2, is about 182 km long by a maximum of 32 km wide (Koppleman and others, 1976). It is bordered on the north by the rocky shoreline of Connecticut and on the south by the eroding sandy bluffs of Long Island, New York. The study area (figs. 1, 2), which covers about 12.5 km2, lies in northeastern Long Island Sound about 4.4 km offshore from Guilford, Connecticut.
The bedrock beneath the study area dips southward and is probably composed of gneissic and schistose metamorphic rocks of pre-Silurian age (Grim and others, 1970; Flint, 1971; Rodgers, 1985). Onshore near Guilford, bedrock units are exposed or only thinly covered (Ginsberg, 1976) and include the pink, medium to coarse grained Stony Creek Granitic Gneiss and the thinly bedded quartzites, mica schists, and dark gray granitic gneisses of the Plainfield Formation (Proterozoic?; Rodgers, 1985).
The bedrock across much of southeastern Connecticut is unconformably overlain by two tills, one of early Wisconsinan-Illinoian age and one of late Wisconsinan age (Goldsmith, 1980; Stone and others, 1992). The till exposed on the eroding bluffs that surround the upland part of Falkner Island is unsorted, shear banded, fairly compact, and oxidized to a yellowish brown (Helander, 1988). The last two characteristics suggest that the glacial drift exposed on Falkner Island is composed of the older, Wisconsinan-Illinoian till (Schafer and Hartshorn, 1965; Gordon, 1980).
The northward retreat of the late Wisconsinan ice sheet is marked in southeastern Connecticut and beneath Long Island Sound by a northward succession of minor recessional moraines including the Hammonasset-Ledyard, Old Saybrook, and Mystic Moraines (Flint and Gebert, 1976; Goldsmith, 1980; Poppe and others, 1997). Although earlier workers have described Falkner Island as a continuation of the Old Saybrook Moraine (Flint and Gebert, 1976), several lines of evidence suggest that the island is a drumlin (J. Stone, USGS, personal communication, 1996). First, as stated above, the till on Falkner Island is interpreted to be of pre-Wisconsinan age, but the Old Saybrook Moraine is Late Wisconsinan (Schafer and Hartshorn, 1965). Second, the relief of the island itself is oriented approximately north-south, rather than the southwest-northeast trend that would be expected if Falkner Island were a continuation of the Old Saybrook Moraine (Flint, 1971). Finally, the compacted and shear-banded nature of the glacial drift on Falkner Island is more consistant with lodgement till rather than with ablation till (Reineck and Singh, 1980).
Deltaic and varved lacustrine deposits of glacial Lake Connecticut locally overlie the bedrock and glacial drift around Falkner Island (Lewis and Needell, 1987; Needell and others, 1987; Lewis and Stone, 1991; Stone and others, 1992). A marine mud facies, which occurs in lower-energy areas throughout the Long Island Sound basin, overlies these earlier deposits and records deposition during the postglacial Holocene eustatic rise of sea level.
Falkner Island covers about 5 acres at mean low water, but the upland area of the island, which is only about 2.8 acres (Helander, 1988), is being ravaged by erosion. Estimates by Helander (1988) indicate that the upland area of the island has decreased by approximately 2.8 acres or 50 percent since 1818, when observations on island size were first conducted. These estimates also show that the rate of erosion is much greater on the north and south bluffs than on the east and west bluffs. For example, the east and west bluffs are eroding at 2.5 to 5.0 cm/yr, but the island=s northern point has been abraded to a knife=s edge and is presently eroding at a rate of about 25 cm/yr (Helander, 1988).
Goose Island, located about 1.5 km west-southwest of Falkner Island, also falls within the present study area. This flat-lying island, which is about 0.5 acre in size and awash during storm and perigee tides, is armored with boulders and gravel (Helander, 1988). Three other gravel-crested bathymetric highs, that are exposed during spring tides, surround Goose Island and include Stony Island, North Rocks, and Three Quarters Rock.
Strong tidal currents have extensively eroded and reworked both the glacial and post-glacial deposits and continue to influence sedimentary processes and surficial sediment distributions in eastern Long Island Sound. The irregular bottom topography and extensive lag deposits of the eastern Sound reflect scour, transport, and reworking of the sediments (Lewis and Stone, 1991).
DATA COLLECTION AND PROCESSING
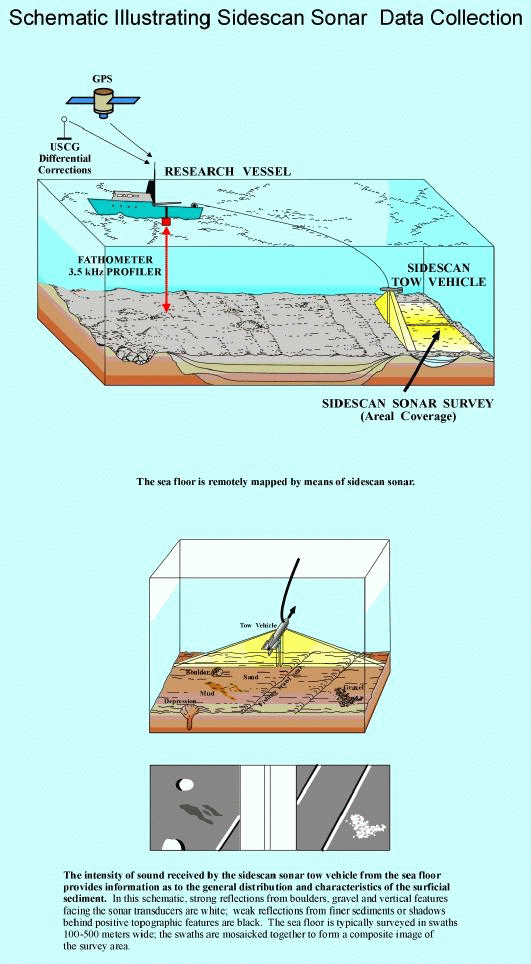
Sidescan sonar imagery, bathymetry, subbottom high-resolution seismic-reflection profiles and navigational data were collected along tracks spaced 150 m apart aboard the RV Asterias during June 15-16, 1996 (fig. 2). The sidescan sonar data were collected using an SIS-1000 Datasonics sidescan sonar system set to image 100-m to either side of the shiptrack. These data were logged digitally to 8-mm tape on a ISIS data acquisition system. The bathymetric data were collected using a 200-kHz echo sounder, and the data were logged digitally. After the cruise, the bathymetric data were corrected for the approximately 1.64-m tidal range in the study area and adjusted to the predicted mean sea-level for New London, Connecticut using commercially available computer software. The subbottom data (figs. 3, 4) were collected in digital form using a 2-7 kHz swept-frequency CHIRP system incorporated into the SIS-1000. Ship position was determined with a differential Global Positioning System (GPS) and was logged at 10-second intervals.
The sidescan sonar data were processed according to procedures summarized by Danforth and others (1991) and Paskevich (1992a,b). Briefly, the sonar data were demultiplexed and converted to a format usable by the processing routines. During this step the data were subsampled to reduce data volume and to remove speckle noise. The data were corrected for slant-range distortions and filtered to correct for signal attenuation and for dropped lines in the sonar data. The dynamic range of the data was used to apply a contrast enhancement to the image and ship navigation was merged with the sonar data.
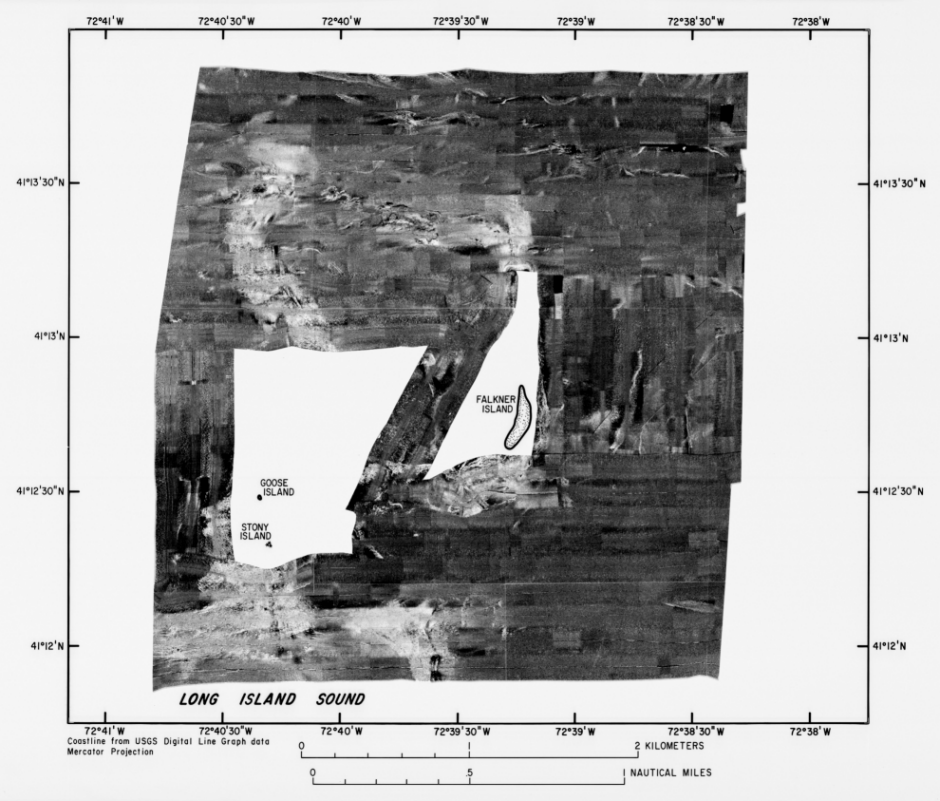
After this preliminary processing, the data were used to make the composite digital mosaics. Alternating strips of sonar data were placed in their proper geographic locations based on the navigation using a mercator projection and a 1-m pixel size (fig. 5; Paskevich (1992c). Adjacent sonar images were matched for tone, unwanted data where two images overlapped were digitally trimmed off, and the sonar images were progressively combined into the composite mosaic. Registration of features between the shiptrack navigation and the adjacent strips of sidescan sonar data are generally good throughout the study area. The final image was output to film, photographically enlarged to a scale of 1:10,000, and interpreted (fig. 6).
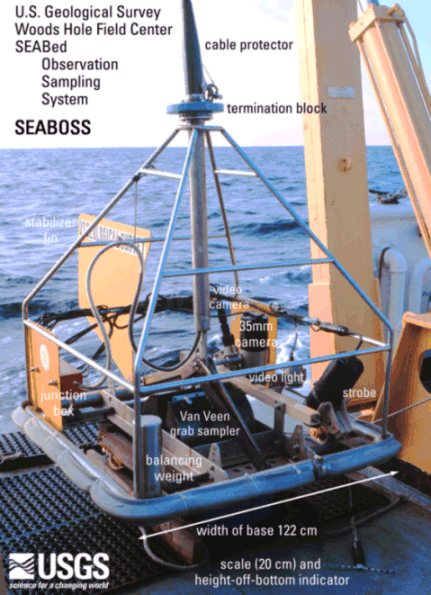
Surficial sediments were sampled and bottom photography was attempted at 50 locations during March 1996 aboard the RV John Dempsey by means of a Van Veen grab sampler equipped with video and still camera systems (fig. 7). The photographic systems were also used to appraise intra-station bottom variability and to observe boulder fields and outcrops where sediment samples could not be collected. Surficial sediments (sediments from the sediment-water interface down to 2 cm below the interface) were collected from the grab sampler; subsamples were frozen and stored for later analysis.
In the laboratory, the sediment samples were corrected for salt content, disaggregated, and wet sieved through a 62 micron (4 phi) sieve to separate the coarse and fine fractions. The fine fraction (silt and clay) was analyzed by Coulter Counter (Shideler, 1976); the coarse fraction was analyzed by sieving (gravel) and by rapid sediment analyzer (sand; Schlee, 1966). Because biogenic carbonates commonly form in situ, they usually are not considered to be representative of the depositional environment from a textural standpoint. Therefore, bivalve shells and other biogenic carbonate debris were manually removed from the gravel fraction. Size classifications are based on the method proposed by Wentworth (1929). The verbal equivalents were calculated using the inclusive graphics statistical method (Folk, 1974) and are based on the nomenclature proposed by Shepard (1954). A detailed discussion of the laboratory methods employed are given in Poppe and others (1985); the raw grain-size data, associated statistics, and detailed descriptions of the bottom photography are reported in Poppe and others (1996).
The map of surficial sediment distribution shown in figure 7 is based on data from the sediment sampling and bottom photography stations, on tonal changes in backscatter on the sidescan sonar image, and on the subbottom and bathymetric data.
The complex bathymetry around Falkner Island, which was contoured at 2-m intervals to facilitate an understanding of the geology and general benthic character of the sea floor, clearly affects bottom-water circulation and the transport of sediments (fig. 2). Maximum water depths exceed 28 m and occur south of Goose Island and in an east-west trending depression north of Falkner Island. The bottom topography shallows shoreward around the islands, over shoals extending northward from the islands, and in a broad band extending toward the east and west from the islands. The steepest bathymetric gradients are associated with the depression north of Falkner Island and a similar depression south of the island. Isolated bathymetric highs occur in the south-central and north-central parts of the study area. Elsewhere in the study area the bathymetric gradients are much gentler and the sea floor is relatively smooth.
Near-surface Seismic Facies and Stratigraphy
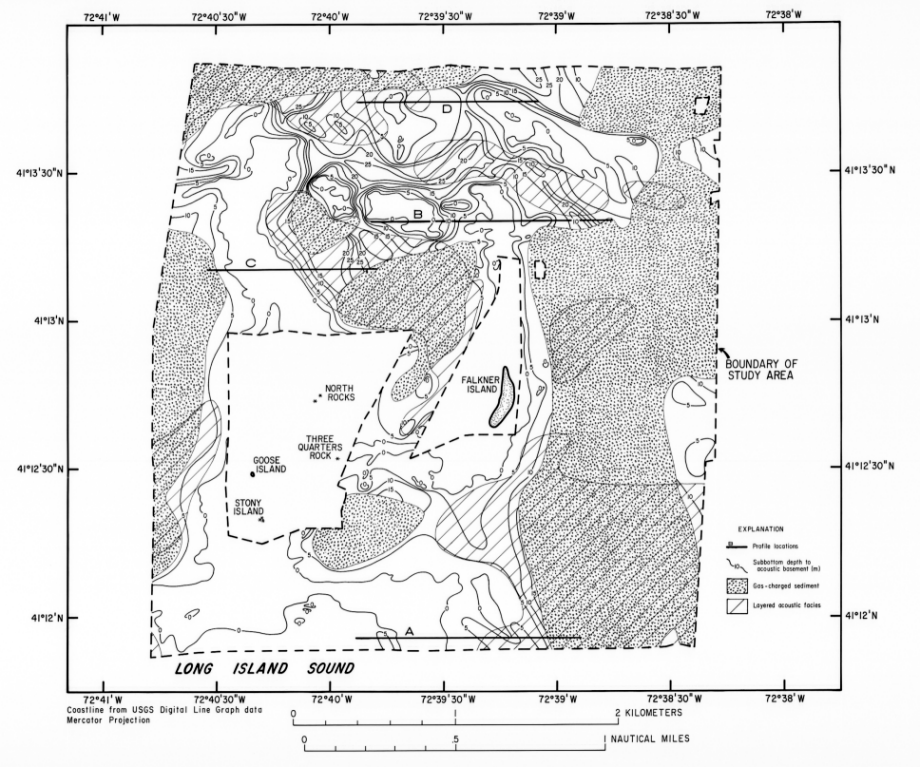
The CHIRP seismic-reflection profiles provide information on the subsurface geology and its relationship to surficial processes and sediment distribution. Four distinct acoustic facies were identified on these subbottom profiles: (1) an acoustically prolonged facies, (2) an acoustically opaque facies, (3) an acoustically transparent facies, and (4) an acoustically layered facies. More than one of these facies may occur together; the layered and transparent facies commonly grade into each other. Outcropping subbottom units of the prolonged facies were also recorded on the subbottom profiles.
The acoustically prolonged facies, which represents acoustic basement, is the oldest unit and has a highly reflective upper surface (figs. 3, 4). This facies is exposed or only thinly covered across much of the southwestern part of the study area, on isolated bathymetric highs, and immediately around and over shoals extending northward and southward from the islands where strong tidal currents have presumably prevented the deposition of younger sediments (fig. 3A). Boulders, commonly present on the upper surface of the prolonged acoustic facies, indicate that this unit is primarily composed of Pleistocene glacial drift. A smoother upper surface characterizes a few of the occurrences of the prolonged facies in the northern part of the study area suggesting that some of these reflections may originate from bedrock.
The subbottom profiles in the northern part of the study area show that the acoustically prolonged facies delineates a somewhat more irregular topography than in the southern part. This surface slopes upward toward the islands and other bathymetric highs apparently forming their substrates and, at least in part, controling the distribution of surficial sediments (figs. 3B, C).
Channels and basins in the drift surface are commonlyly filled with more recent sediments. These more recent sediments are separated by an unconformity and include a lower glaciolacustrine unit and an upper Holocene marine unit (fig. 3). The glaciolacustrine unit was deposited in glacial Lake Connecticut, and is composed of fan, varved lake-clay, and deltaic deposits (Lewis and Stone, 1991). The lake, which occupied almost all of the Long Island Sound Basin, was formed by 19 ka when the last ice front began to recede from the Harbor Hill-Charlestown Moraine position and meltwater was impounded in the expanding, long, narrow basin between the moraine and the retreating ice to the north (Stone and Borns, 1986). Erosion of a spillway at the eastern end of the Sound drained glacial Lake Connecticut by 15.5 ka and the lakebed was subaerially exposed. The unconformity that separates these lacustrine deposits from the overlying Holocene marine sediments is a product of the subaerial exposure and the marine transgression that occurred between 15 ka and 12.4 ka (Lewis and Stone, 1991). Thinning of the Holocene section in the depressions around Falkner Island suggests that these depressions are probably the result of scour or nondeposition related to the deflection of strong tidal currents around Falkner Island (>56 cm/sec; Quarrier, 1993; Eldridge, 1996).
The transparent and layered facies occur in the sediments that overlie and are younger than the prolonged acoustic facies. The transparent facies dominates in shallow and other higher-energy environments where the Holocene marine sediments are actively reworked. The layered facies is more prevalent in areas of slightly lower energy, such as in deeper waters or the area between the shoals extending northward from Falkner and Goose Islands. The layers in this facies probably represent coarser-grained storm deposits in relatively unreworked Holocene marine sediments (fig 3). Occurrences of the layered facies are also present in the late Pleistocene glaciolacustrine deposits adjacent to the glacial drift (fig. 3C, D).
The acoustically opaque facies is interpreted to result from gas-charged sediment (figs. 3A, 4). The gas is probably biogenic methane produced in fine-grained Holocene sediment by the decay of organic matter (Needell and others, 1987). The distribution of this facies is primarily limited to areas where the Holocene marine unit is thickest and the subbottom depth to acoustic basement is relatively great, such as east of Falkner Island and west of Goose Island, or where the depositional environment is one of lower energy, such as the area between the islands. The top of this facies, which produces a characteristic pattern of strong reflection and scattering of seismic energy, occurs between 4 to 6 m beneath the sediment-water interface. Gas-charged sediment can be associated with both the transparent and layered acoustic facies, but, where detected, the gas obscures most of the underlying units and the acoustic basement in these areas. Earlier studies of the Quaternary history of Long Island Sound near Falkner Island also encountered similarly gas-charged sediment that complicated stratigraphic interpretation (Lewis and Needell, 1987; Needell and others, 1987).
The 100-kHz sidescan-sonar mosaic creates an acoustic image of the sea floor that, when used in combination with the seismic profile, bathymetric data, and sediment samples, provides an overall perspective of the benthic character (figs. 5, 6). Distinctive acoustic patterns revealed by this mosaic include: the complex patches of high and low backscatter that coincide with areas where the glacial drift crops out (boulders and bedrock), elongate patches of alternating high and low backscatter (sand waves), areas of lower backscatter (dark, finer grained sediment), and areas of high backscatter (light, coarser grained sediment). The numerous ship wakes present on the image attest to the popularity of sport fishing in the vicinity of Falkner Island.
Complex patches of high and low backscatter that coincide with outcrops of subbottom reflectors occur adjacent to the islands, over the shoals extending northward and southward from the islands, and in isolated patches across the northern part of the study area. The individual high-backscatter targets with shadows behind them are boulders; the intervening more continuous areas of high backscatter appear to be gravel. This acoustic pattern delineates the surficial distribution of glacial drift. However, some of the outcrops that produce this acoustic pattern in the north-central part of the study area may be bedrock.
The strong, oscillatory nature of the tidal currents in the study area is demonstrated by the linear accumulations of sediment extending both eastward and westward from isolated boulders. These accumulations, which form in the lee of the boulders, are best developed southwest of Stony Island. The accumulations on the westward side of the boulders are longer across the southernmost part of the study area and around Falkner Island. The accumulations on the eastern side of boulders are longer adjacent to the southern tip of Stony Island. This asymmetrical distribution around the boulders is evidence for a predominantly westward net transport direction throughout most of the study area, but also indicates that ebb tides are stronger just south of Stony Island. The near absence of these features north of the islands suggests that the currents there are not as strong.
Two small areas covered by elongate patches of alternating high and low backscatter occur in the southwestern and north-central portions of the study area (figs. 5, 6). This pattern is produced by sand waves with average wavelengths of less than 20 m and average crest to trough heights of less than 0.5 m. These sand waves are another result of the strong tidal currents present in this part of the Sound (Eldridge Tide and Pilot Book, 1996). The alternation in backscatter that creates this pattern is due to a combination of topographic changes (because the angle of incidence of the sonar changes) and the differences in sediment texture between crests and troughs.
Areas of relatively lower backscatter, such as those that occur just southeast and west of Goose Island (figs. 5, 6), are caused by finer-grained sediment. These low-backscatter areas are more protected sites characterized by generally lower-energy depositional environments. Areas of moderate backscatter, such as around the shoal extending northward from Goose Island, are caused by coarser-grained sediment. The high backscatter areas, such as at the northern end of the shoal extending from Goose Island, are less protected sites characterized by higher-energy conditions and erosion or nondeposition.
Surficial Sediment Distribution
Boulders and gravel occur in high-energy environments of erosion or nondeposition, such as in the shallows adjacent to Falkner and Goose Islands, over the shoals extending northward and southward from the islands, and on isolated bathymetric highs (fig. 7). These coarse deposits are associated with outcrops of glacial drift and, in the case of the occurrences adjacent to the islands, are probably lag deposits of the till still exposed on Falkner Island (Helander, 1988). Bottom photography shows that scattered patches of current-rippled sand and silty sand are occasionally present between the boulders. Barnacles, sponges, mussels, hydrozoans, anemones, and seaweed commonly grow on the boulders. Starfish and rock crabs are also present.
Aprons of gravelly sand, which commonly armor finer-grained underlying sediments, occasionally surround the areas of boulders and gravel. These gravelly sands are very to extremely poorly sorted, coarse-skewed, and leptokurtic. Hydrozoans grow on the gravel; shells and shell debris are common. Scour features are typically present around isolated pieces of gravel.
Sand is the dominant sediment textural class within the study area (fig. 7). The sand is typically very fine grained, nearly symmetrical to extremely fine-skewed, and very to extremely leptokurtic. The sand in the shallow areas between the islands and east of Falkner Island is well to moderately well sorted, but sorting decreases, and silt content increases, toward both the southern and northern parts of the study area where the sands are poorly to moderately sorted and poorly sorted, respectively. Current ripples were ubiquitously observed in the bottom video within the sandy areas. Rust-brown organic debris collects in the troughs of the ripples in lower-energy environments; very fine gravel- and coarse sand-sized shell hash concentrates in the troughs of ripples in the higher-energy environments. Contacts between the bouldery areas and the sand is usually abrupt, rather than gradational. Scattered worm tubes, shrimp burrows, patchy amphipod communities, crab tracks, and snails increase in abundance with increasing silt content of the sand. Hermit crabs and starfish increase in abundance with decreasing silt content. Razor clam debris is occasionally common.
Finer-grained sediments are generally restricted to lower-energy, more-protected environments, such as enclosed bathymetric depressions and the areas just west and southeast of Goose Island. These silty sands are poorly sorted, strongly fine-skewed, and very leptokurtic. Although these finer-grained sediments are faintly rippled, amphipods, polychete tubes, shrimp burrows, and snail and rock crab tracks are commonly present.
The detailed bathymetric, CHIRP subbottom, sidescan-sonar, and sediment data presented here show that the surficial geology of the sea floor around Falkner Island is extremely variable over short distances. This variability is controlled by a combination of the shallow subsurface stratigraphy, that is a product of an uneven bedrock surface and late Quaternary glaciation, and the modern hydraulic regime, which has affected sediment transport, reworking, and deposition since the Holocene marine incursion. Areas of high backscatter on the mosaic coincide with outcrops of glacial drift and coarser-grained sediments; areas of moderate and low backscatter coincide with finer-grained Holocene deposits. Although the surficial geology within the study area is clearly too complex to be mapped by measurements made solely at discrete sample locations, the integrated acoustic and sediment data sets presented here provide a detailed base map for future studies of sedimentary environments, biological communities, and geochemical processes.
This survey was conducted in cooperation with the State of Connecticut, Department of Environmental Protection, Geological and Natural History Survey. We thank Dave Olmsted who was captain of the RV Asterias, Kathy Scanlon and Dave Twichell who critically reviewed this map, Peter Simpson and Miles Peterle of the RV John Dempsey, and the Connecticut Department of Environmental Protection for providing logistical support. Any use of trade, product, or firm names is for descriptive purposes only and does not imply endorsement by the U.S. Government.
Danforth, W.W., O'Brien, T.F., and Schwab, W.C., 1991, USGS image processing system: near real-time mosaicking of high resolution side scan SONAR data: Sea Technology, v. 32, p. 54-60.
Eldridge Tide and Pilot Book, 1996, Marion Jewett White, Boston, 272 p.
Flint, R.F., 1971, The surficial geology of the Guilford and Clinton Quadrangles with map: State Geological and Natural History Survey of Connecticut, Quadrangle Report No. 28, 33 p., 2 sheets.
Flint, R.F., and Gebert, J.A., 1976, Latest Laurentide Ice Sheet - New Evidence fron southern New England: Geological Society of America Bulletin, v. 87, p. 182-188.
Folk, R.L., 1974, The petrology of sedimentary rocks: Austin, Tex., Hemphill Publishing Co., 182 p.
Giampa, D.E., 1986a, Milford Point completes state=s Coastal National Wildlife Refuge: Land=s End - news from the Connecticut Coastal Area Management Program, Spring/Summer issue, p. 4-6.
Giampa, D.E., 1986b, An update on Connecticut=s Coastal Wildlife Refuge: Land=s End - news from the Connecticut Coastal Area Management Program, Fall issue, p. 4-5.
Ginsberg, M.H., 1976, Map showing the depth to bedrock, Guilford Quadrangle, Connecticut: U.S. Geological Survey Miscellaneous Field Studies Map MF-583C, 1 sheet.
Goldsmith, Richard, 1980, Recessional moraines and ice retreat in southeastern Connecticut: In G.J. Larson and B.D. Stone (editors), Late Wisconsinan Glaciation of New England, Kendall/Hunt Publishing, Dubuque, p. 61-76.
Gordon, R.B., 1980, The sedimentary system of Long Island Sound: Advances in Geophysics, v. 22, p. 1-36.
Grim, M.S., Drake, C.L., and Heirtzler, J.R., 1970, Subbottom study of Long Island Sound: Geological Society of America Bulletin, v. 81, p. 649-666.
Helander, J.E., 1988, The island called Faulkner=s: Published by J.E. Huelander, Guilford, Connecticut, 190 p.
Koppleman, L.E., Weyl, P.K., Gross, M.G., and Davies, D.S., 1976, The Urban Sea: Long Island Sound: Praeger Special Studies - Design /Environmental Planning series, Praeger, New York, 223 p.
Lewis, R.S., and Needell, S.W., 1987, Maps showing the stratigraphic framework and Quaternary geologic history of eastern Long Island Sound: U.S. Geological Survey Miscellaneous Field Studies Map MF-1939-A, 7 p., 3 sheets.
Lewis, R.S., and Stone, J.R., 1991, Late Quaternary stratigraphy and depositional history of the Long Island Sound basin: Connecticut and New York: Journal of Coastal Research, Special Issue 11, p. 1-23.
Long Island Sound Study, 1994, Comprehensive conservation and management plan: U.S. Environmental Protection Agency Report, 168 p.
Needell, S.W., Lewis, R.S., and Colman, S.M., 1987, Maps showing the Quaternary geology of east-central Long Island Sound: U.S. Geological Survey Miscellaneous Field Studies Map MF-1939-B, 3 sheets.
Paskevich, Valerie, 1992a, Woods Hole Image Processing System software implementation: using NetCDF as a software interface for image processing: U.S. Geological Survey Open-File Report 92-25, 66 p.
Paskevich, Valerie, 1992b, Digital processing of side-scan sonar data with the Woods Hole Image Processing System software: U.S. Geological Survey Open-File Report 92-204, 9 p.
Paskevich, Valerie, 1992c, Digital mapping of side-scan sonar data with the Woods Hole Image Processing System software: U.S. Geological Survey Open-File Report 92-536, 87 p.
Poppe, L.J., Eliason, A.H., and Fredericks, J.J., 1985, APSAS - An automated particle size analysis system: U.S. Geological Survey Circular 963, 77 p.
Poppe, L.J., Lewis, R.S., and Moffett, A.M., 1992, The texture of surficial sediments in northeastern Long Island Sound: U.S. Geological Survey Open-File Report 92-550, 13 p.
Poppe, L.J., Lewis, R.S., Quarrier, Sidney, Zajac, Roman, and Moffett, A.M., 1994, Map showing the distribution of surficial sediments in Fishers Island sound, New York, Connecticut, and Rhode Island: U.S. Geological Survey Miscellaneous Field Studies Map I-2456, 1 sheet.
Poppe, L.J., Taylor, B.B., Blackwood, Dann, Lewis, R.S., and DiGiacomo-Cohen, M.L., 1996, The texture of surficial sediments in eastern Long Island Sound near Niantic Bay, Connecticut: U.S. Geological Survey Open-File Report 96-271, 16 p.
Poppe, L.J., Lewis, R.S., Zajac, Roman, Twichell, D.C., Schmuck, E.A., Parolski, K.F., and DiGiacomo-Cohen, M.L., 1997, Sidescan sonar image, surficial geologic interpretation, and bathymetry of the Long Island Sound sea floor off Hammonasset Beach State Park, Connecticut: U.S. Geological Survey Geologic Investigations Map I-2588, 2 sheets.
Quarrier, Ian (ed.), 1993, Embassy=s Complete Boating Guide to Long Island Sound: Embassy Marine Publishing, Old Saybrook, Connecticut, 460 p.
Reineck, H.E., and Singh, I.B., 1980, Depositional Sedimentary Environments: Springer-Verlag, New York, 549 p.
Rodgers, John, 1985, Bedrock Geologic Map of Connecticut, Connecticut Natural Resources Atlas Series, Connecticut Geological and Natural History Survey, Department of Environmemtal Protection, Hartford, Connecticut, scale 1:125,000, 2 sheets.
Schafer, J.P., and Hartshorn, J.H., 1965, The Quaternary of New England, In: Wright, H.E., and Frey, D.G., (eds.), The Quaternary of the United States: Princeton, N.J., Princeton University Press, p. 113-127.
Schlee, J., 1966, A modified Woods Hole rapid sediment analyzer: Journal of Sedimentary Petrology, v. 30, p. 403-413.
Shepard, F.P., 1954, Nomenclature based on sand-silt-clay ratios: Journal of Sedimentary Petrology, v. 24, p. 151-158.
Shideler, G.L., 1976, A comparison of electronic particle counting and pipette techniques in routine mud analysis: Journal of Sedimentary Petrology, v. 42, p. 122-134.
Stone, B.D., and Borns, H.W, 1986, Pleistocene glacial and interglacial stratigraphy of New England, Long Island, and adjacent Georges bank and Gulf of Maine. In: Sibrava, V., Bowen, D.Q., and Richmond, G.M. (Eds.), Quaternary Glaciations in the Northern Hemisphere, Oxford, Pergammon Press, pp. 39-52.
Stone, J.R., Schafer, J.P., London, E.H., and Thompson, W.B., 1992, Surficial materials map of Connecticut: U.S. Geological Survey Surficial Materials Map, scale 1:125,000, 2 sheets.
Twichell, D.C., Poppe, L.J., Zajac, Roman, and Lewis, R.S., 1995, Sidescan sonar survey of the Long Island Sound sea floor off Milford, Connecticut: Geological Society America Abstracts with Programs, v. 27, p. 88.
Twichell, D.C., Zajac, Roman, Poppe, L.J., Lewis, R.S., Cross, VeeAnn, and Nichols, David, 1997, Bathymetry, sidescan sonar image, and surficial geological interpretation of Long Island Sound off Norwalk, Connecticut: U.S. Geological Survey Geologic Investigations Map I-2589, 2 sheets.
Wentworth, C.K., 1929, Method of computing mechanical composition of sediments: Geological Society of America Bulletin, v. 40, p. 771-790.
Figure 1. Map showing the location of the study area (stripped polygon) around Falkner Island, Connecticut. Map also shows the locations (open polygons) of the Norwalk Islands, Milford, Hammonasset, Roanoke Point, Niantic Bay, New London, and Fishers Island Sound sidescan sonar surveys which are part of this series (Poppe and others, 1992; Poppe and others 1994, Twichell and others, 1995; Poppe and others, 1997; Twichell and others, 1997), the other components of the Stewart B. McKinney National Wildlife Refuge, and the major onshore moraines.
Figure 2. Bathymetric map of the study area. Depths are contoured in 2-m intervals, have been corrected for tides, and are adjusted to mean sea level. Small dashed lines are the tracklines along which the geophysical data were collected. Figure also shows the locations of profiles shown in figure 3.
Figure 3. CHIRP subbottom profiles showing the stratigraphy and different echo character types. (A) Profile from south of Falkner Island showing an example of the prolonged acoustic facies interpreted to be glacial drift and the opaque acoustic facies interpreted to result from gas-charged sediments. (B) Profile across the shoal north of Falkner Island showing the infilling of topographic lows in the irregular surface of the prolonged acoustic facies by glaciolacustrine sediments. (C) Profile across the shoal north of Goose Island. Boulders are clearly present on the surface of the prolonged acoustic facies. (D) Profile across the north-central part of the study area showing the infilling of topographic lows in the irregular surface of the prolonged acoustic facies by glaciolacustrine sediments. Examples of the transparent and layered facies are also labeled on these profiles. Locations of the profiles are shown in figures 2 and 4.
Figure 4. Near-surface echo character map showing the distribution of the prolonged seismic facies (depth to acoustic basement, m) and the acoustically-opaque seismic facies interpreted to be the result of gas-charged sediments. The map also shows the areas within which the seismic facies of the Holocene sediments are predominantly layered or transparent. The prolonged facies outcrops on the sea floor within the 0-m contour. Figure also shows the location of profiles shown in figure 3.
Figure 5. Sidescan sonar mosaic of the Falkner Island study area. Light tones on the image represent areas of high backscatter (usually coarser-grained sediments); dark tones represent areas of low backscatter (usually finer-grained sediments).
Figure 6. Interpretation of the Falkner Island sidescan sonar mosaic. This map shows the distribution of bedrock, gravel and boulders, areas characterized by low backscatter, sand waves, and, net transport direction. Heavy dashed line marks the extent of the sidescan sonar coverage; the coastline is stippled. Different patterns are defined in the Explanation and discussed in the text.
Figure 7. Map showing the distribution of surficial sediments and the locations of the sampling and bottom photography stations. Interpretation of the sediment distribution is based on data from these stations, on tonal changes in backscatter on the sidescan sonar image (fig. 6), and on the correlation of the textural and backscatter data with the bathymetric and seismic profile data (fig. 2).
The sidescan-sonar mosaic is a digital image with a 1-m pixel size ( a pixel represents one meter on the sea floor). The 19Mbyte digital image is available for viewing as a graphic in "tif" format with its associated Arcview geo-reference world file.
[an error occurred while processing this directive]