|
|
|
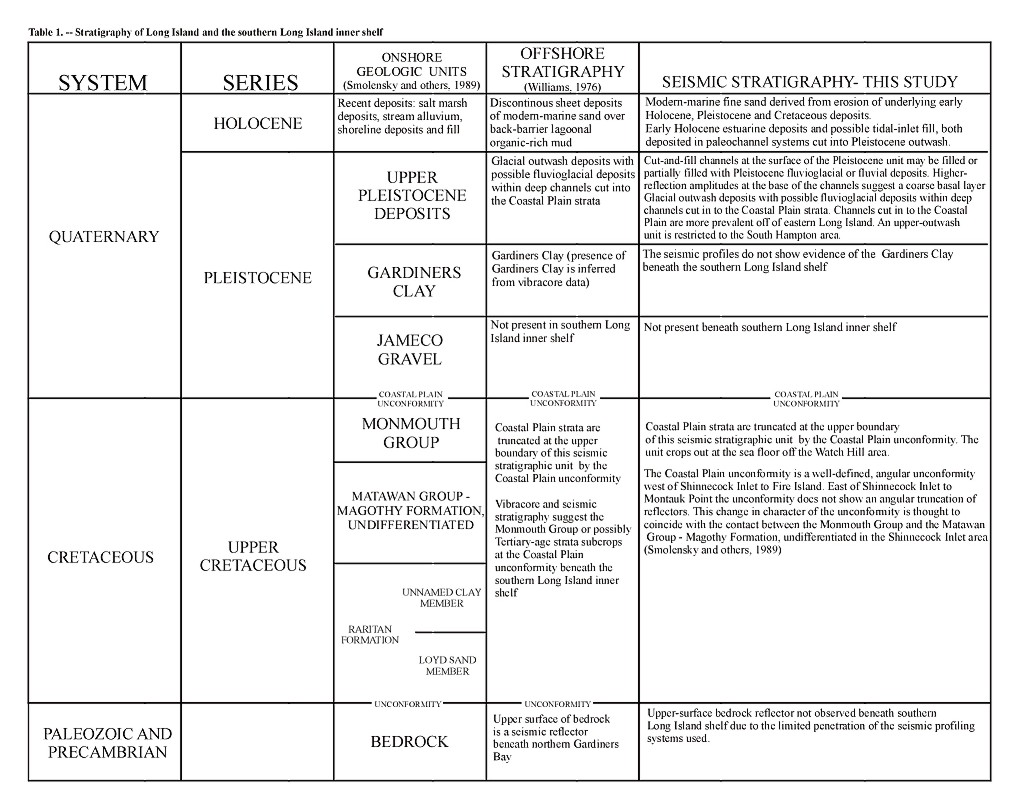
Table 1. -- Stratigraphy of
Long Island and the southern Long Island inner shelf
|
|
|
|
|
|
|
|
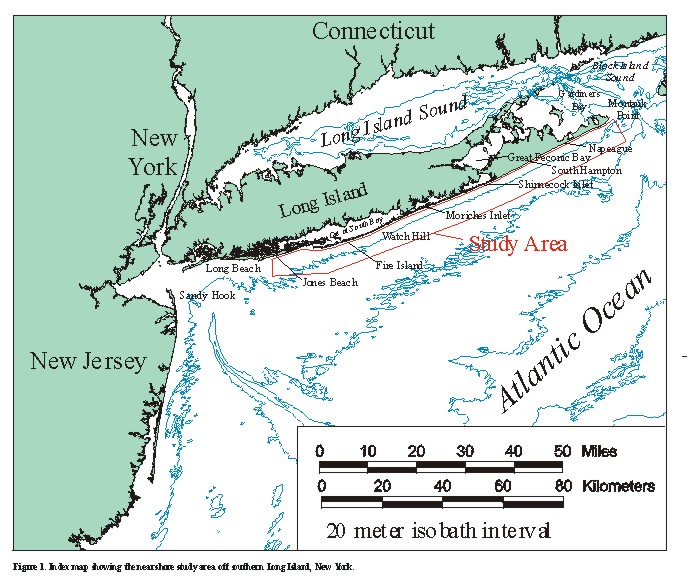
Figure 1. Index map showing
the nearshore study area off southern Long Island, New York. |
|
|
|
|
|
|
|
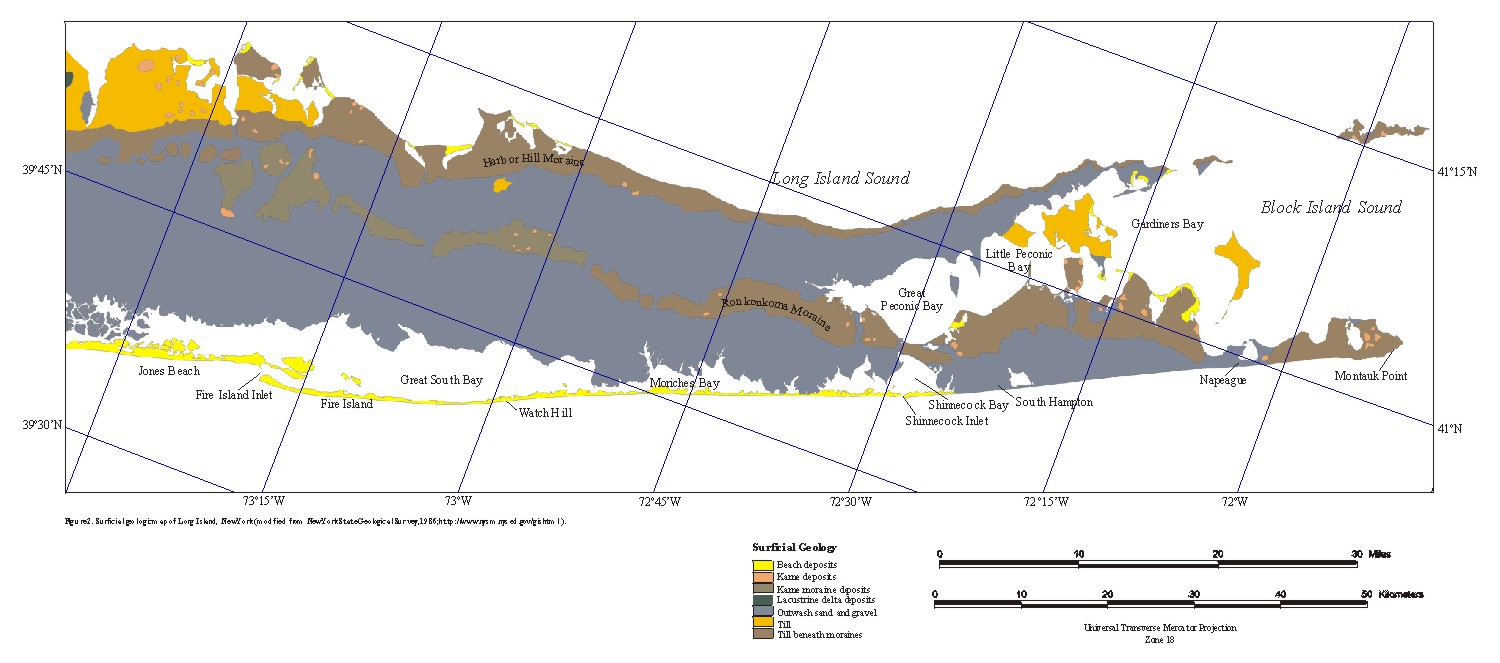
Figure 2. Surficial geologic
map of Long Island, New York (modified from New York State Geological Survey,
1986; http://www.nysm.nysed.gov/gis.html ). |
|
|
|
|
|
|
|
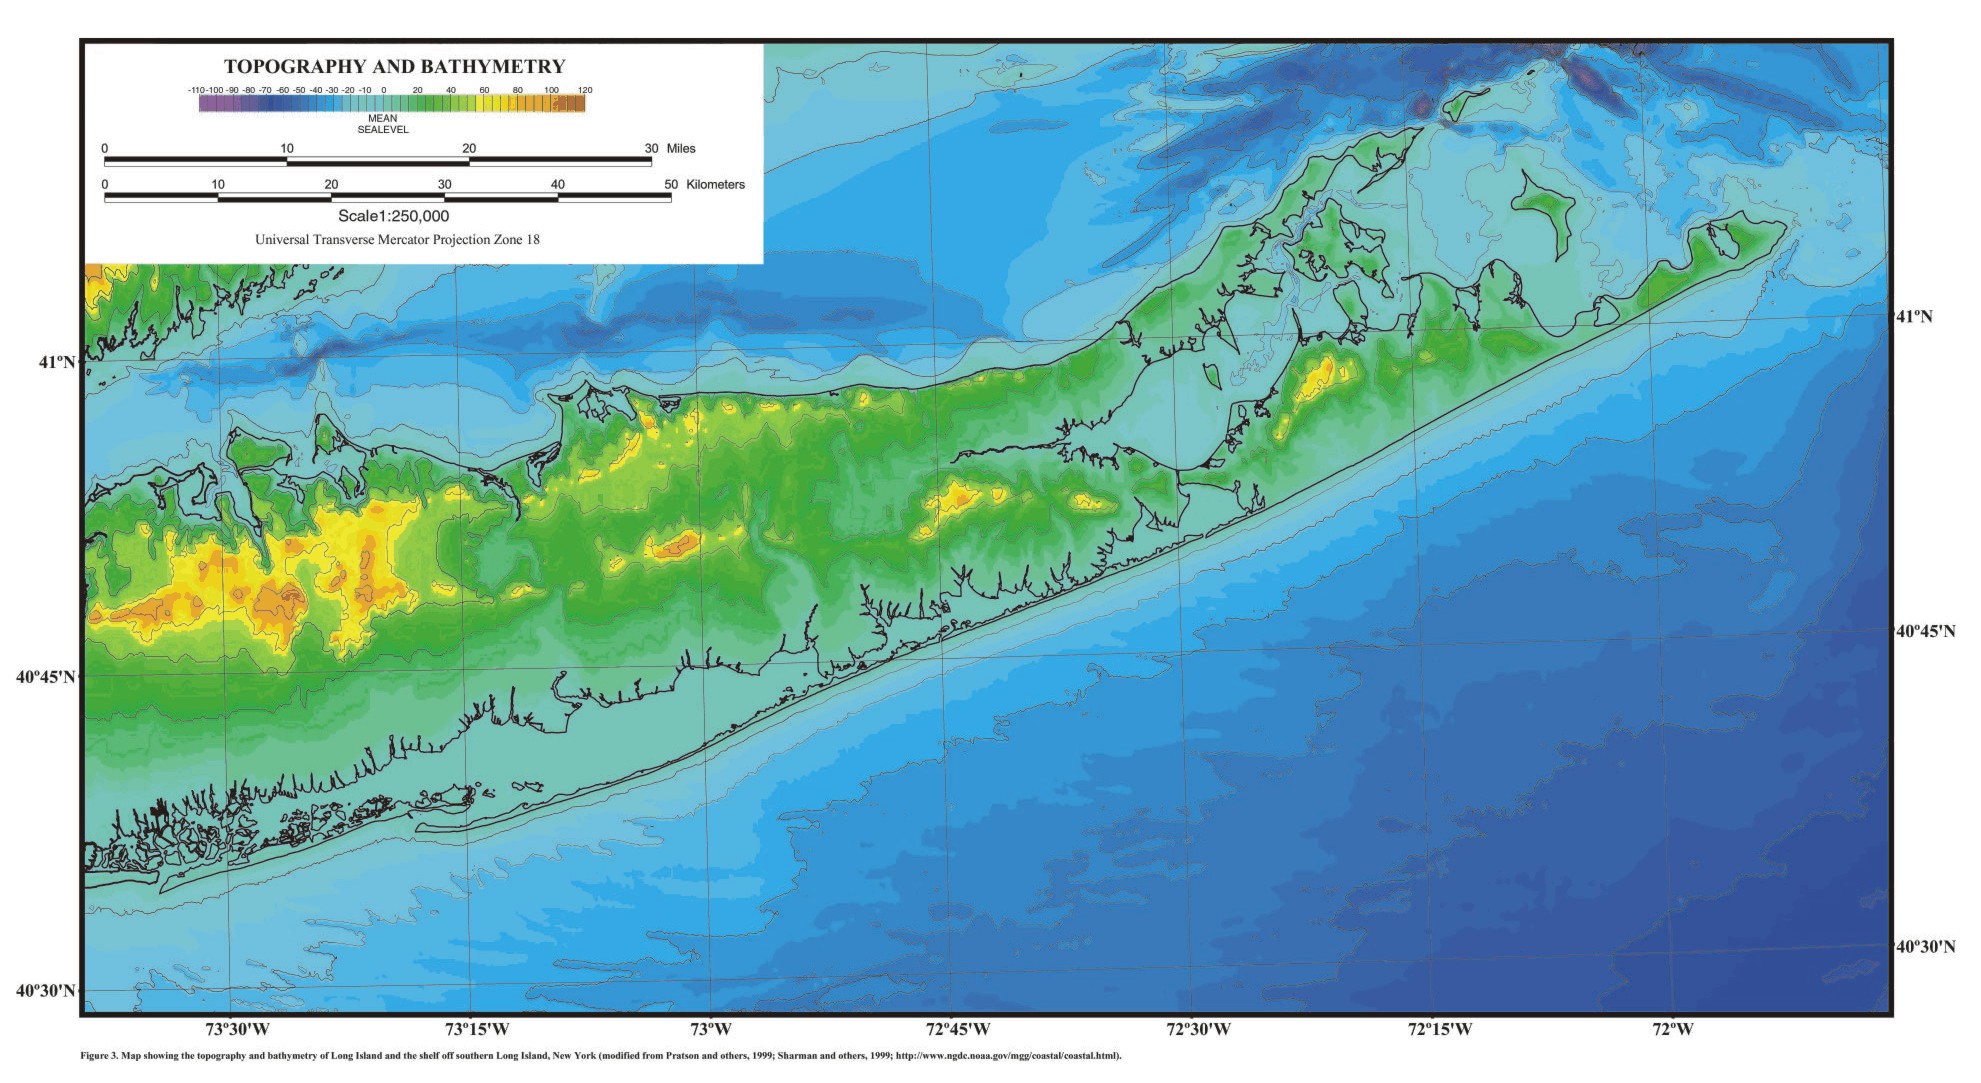
Figure 3. Map showing the
topography and bathymetry of Long Island and the shelf off of southern Long
Island, New York (modified from Pratson and others, 1999; Sharman and others,
1999; http://www.ngdc.noaa.gov/mgg/coastal/coastal.html). |
|
|
|
|
|
|
|
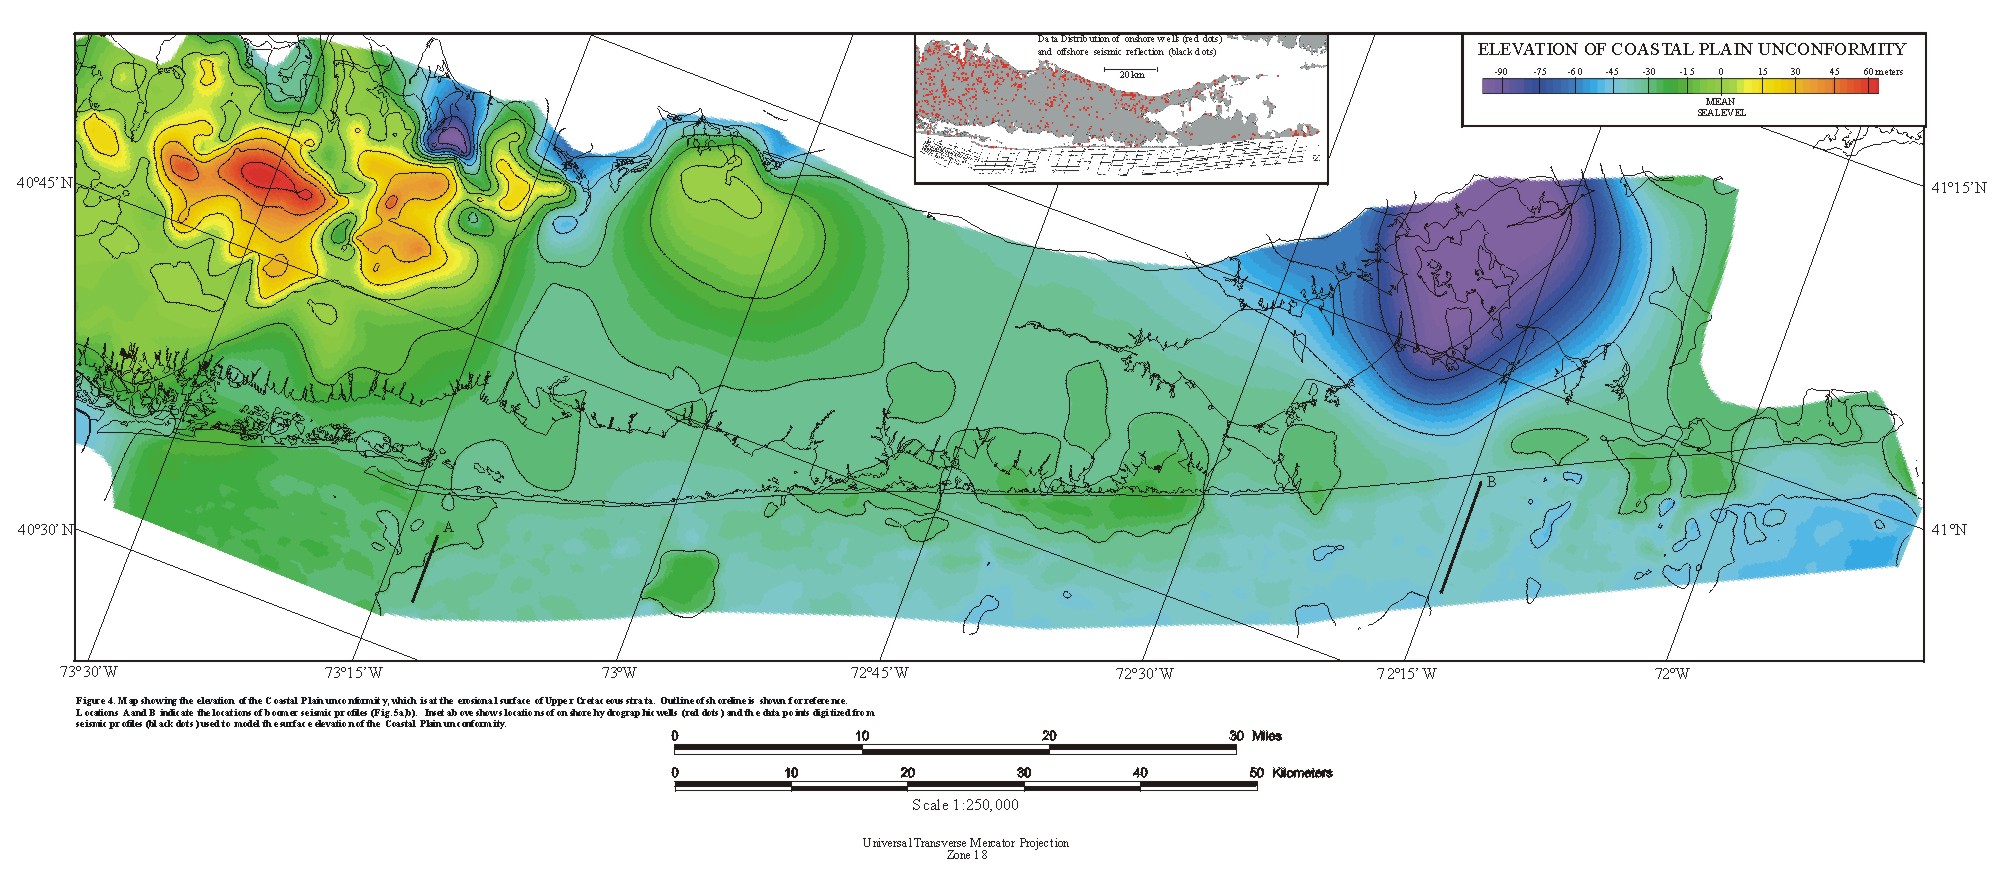
Figure 4. Map showing the elevation of the Coastal Plain unconformity,
which is at the erosional surface of Upper Cretaceous strata. Outline of
shoreline is shown for reference. Locations A and B indicate the locations
of boomer seismic profiles (Fig. 5a,b). Inset above shows locations of onshore
hydrographic wells (red dots) and the data points digitized from seismic
profiles (black dots) used to model the surface elevation of the Coastal
Plain unconformity. |
|
|
|
|
|
|
|
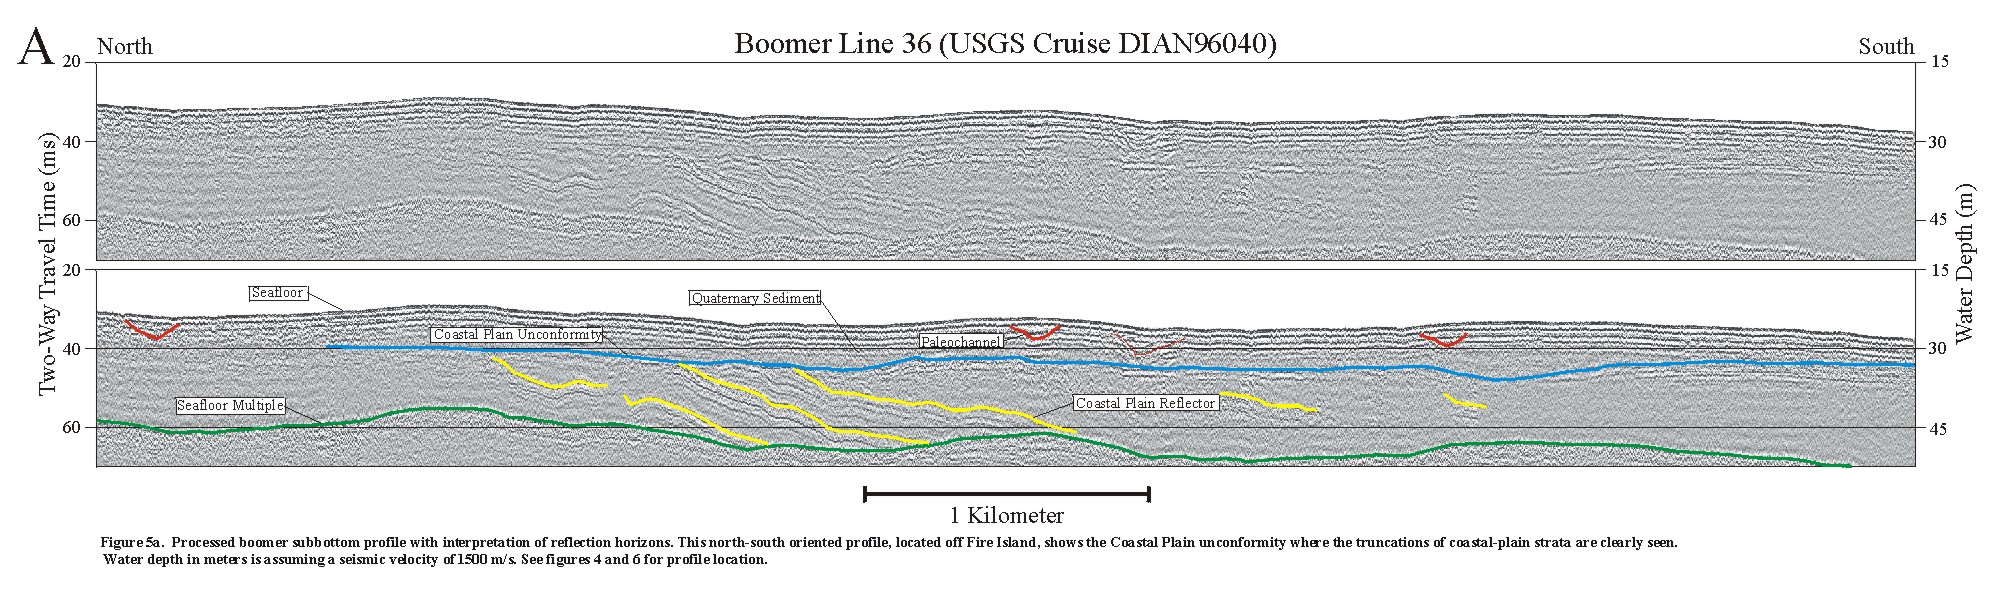
Figure 5a. Processed boomer
subbottom profile with interpretation of reflection horizons. This north-south
oriented profile, located off Fire Island, shows the Coastal Plain unconformity
where the truncations of coastal-plain strata are clearly seen. Water depth
in meters is assuming a seismic velocity of 1500 m/s. See figures 4 and
6 for profile location. |
|
|
|
|
|
|
|
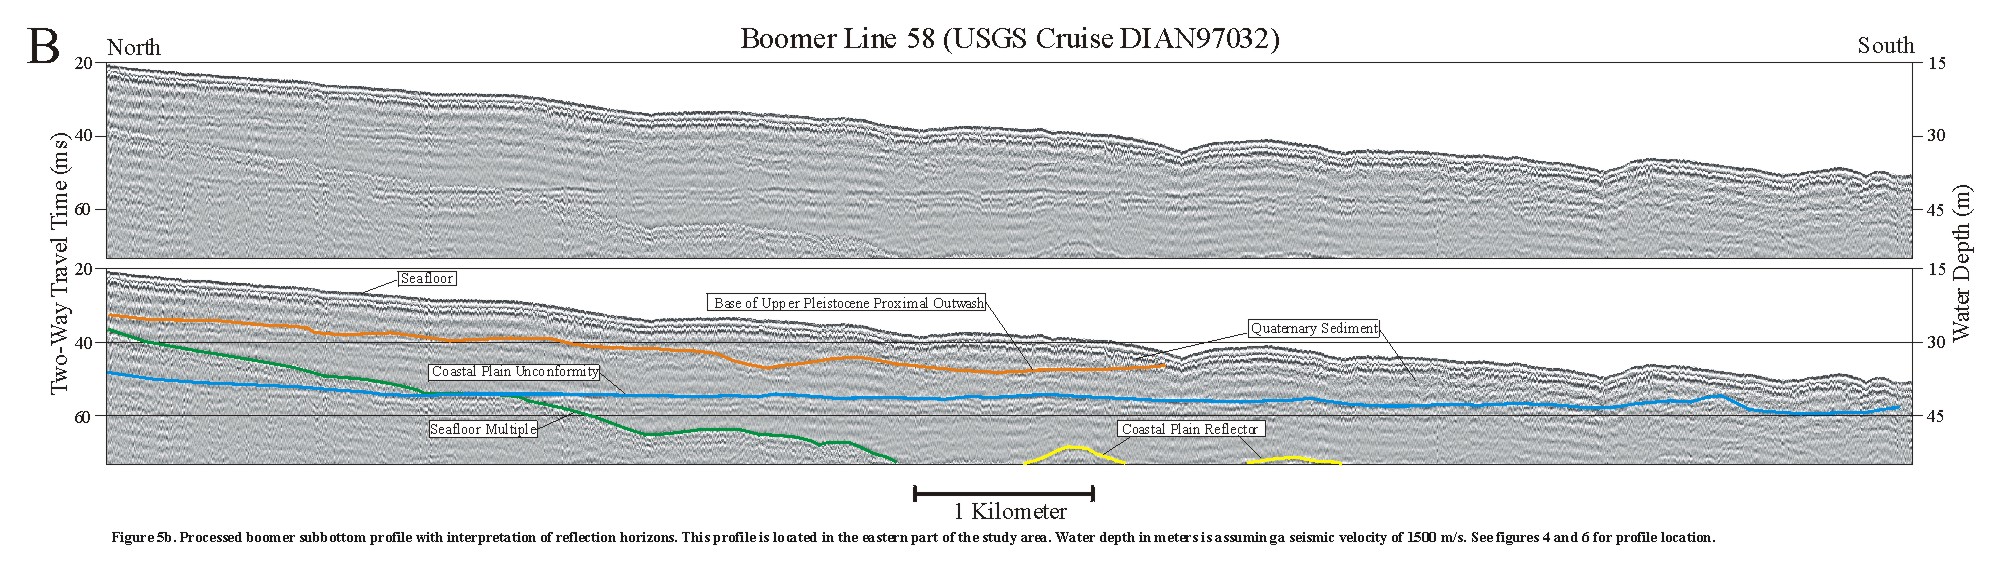
Figure 5b. Processed boomer
subbottom profile with interpretation of reflection horizons. This profile
is located in the eastern part of the study area. Water depth in meters
is assuming a seismic velocity of 1500 m/s. See figures 4 and 6 for profile
location. |
|
|
|
|
|
|
|
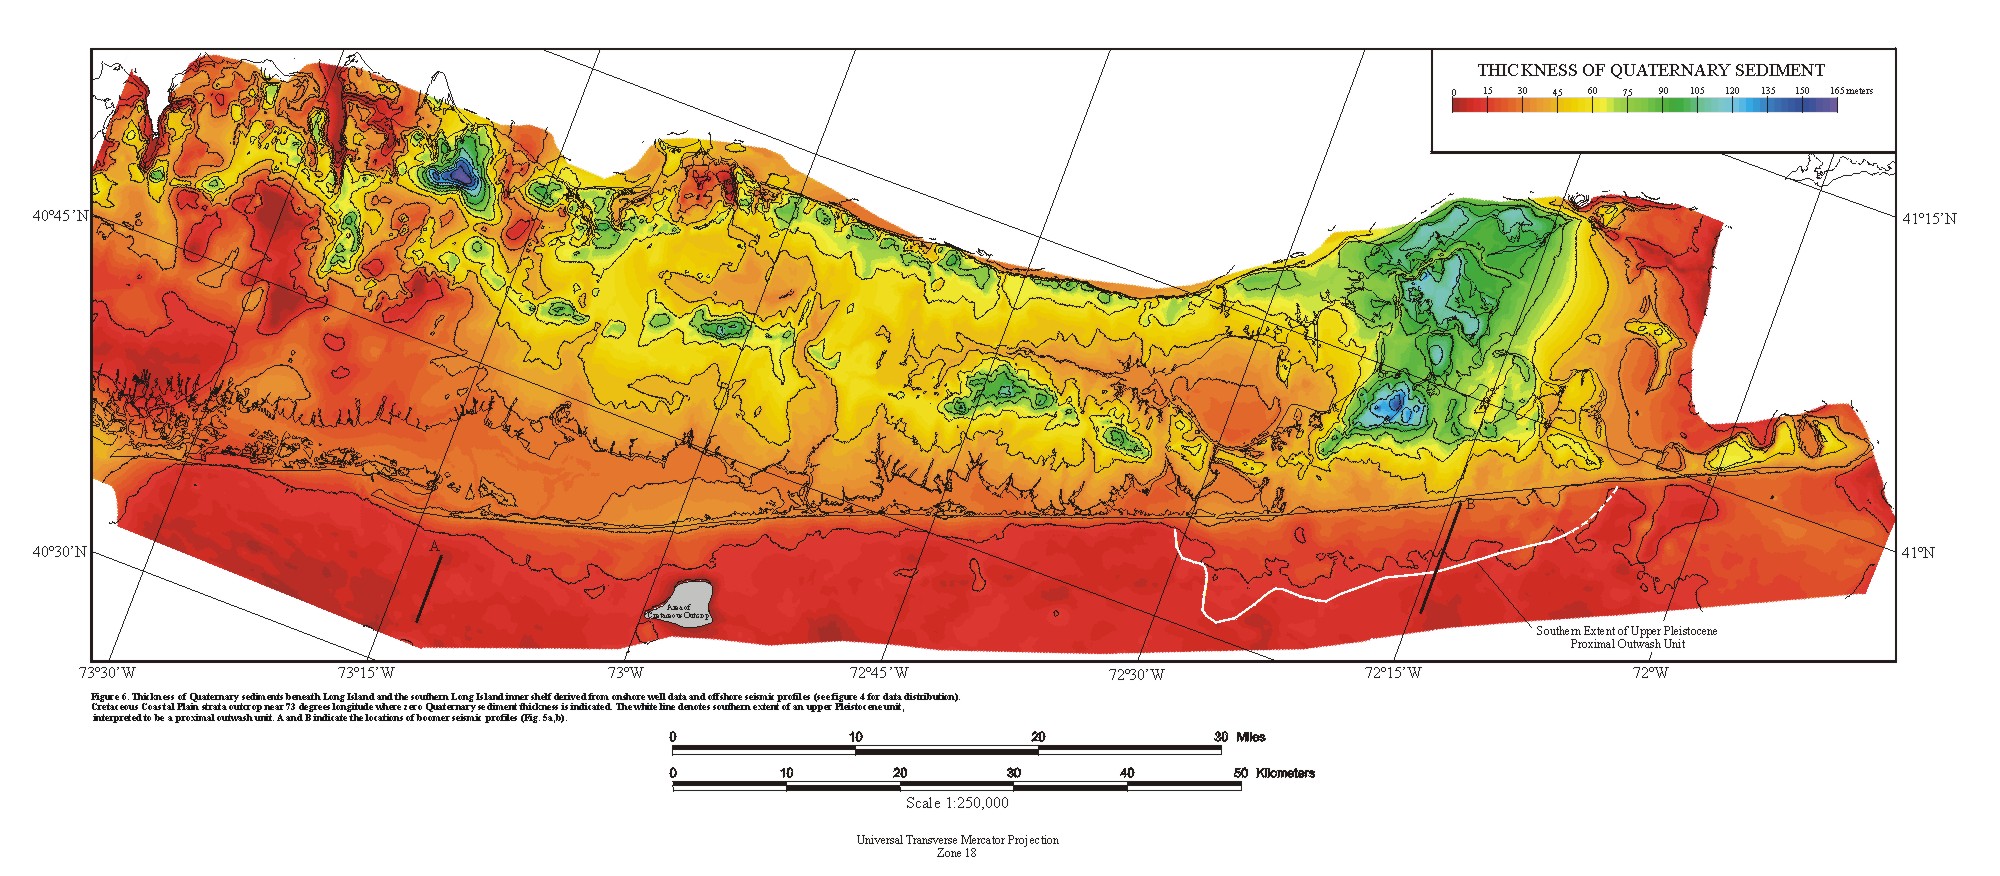
Figure 6. Thickness of Quaternary
sediments beneath Long Island and the southern Long Island inner shelf derived
from onshore well data and offshore seismic profiles (see figure 4 for data
distribution). Cretaceous Coastal Plain strata outcrop near 73 degrees longitude
where zero Quaternary sediment thickness is indicated. The white line denotes
southern extent of an upper Pleistocene unit, interpreted to be a proximal
outwash unit. A and B indicate the locations of boomer seismic profiles
(Fig. 5a,b). |
|
|
|
|
|
|
|
Figure 7. Map showing the
thickness of channel fill with approximate borders of each system marked.
Locations of the two CHIRP profiles in figure 8 are marked.
|
|
|
|
|
|
|
|
Figure 8a. Processed CHIRP
subbottom profiles with interpretation of reflection horizons. This profile
shows a series of cut-and-fill structures. The channel is cut into the Pleistocene
unit. Water depth in meters is assuming a seismic velocity of 1500 m/s.
See figures 7 and 9 for profile location. |
|
|
|
|
|
|
|
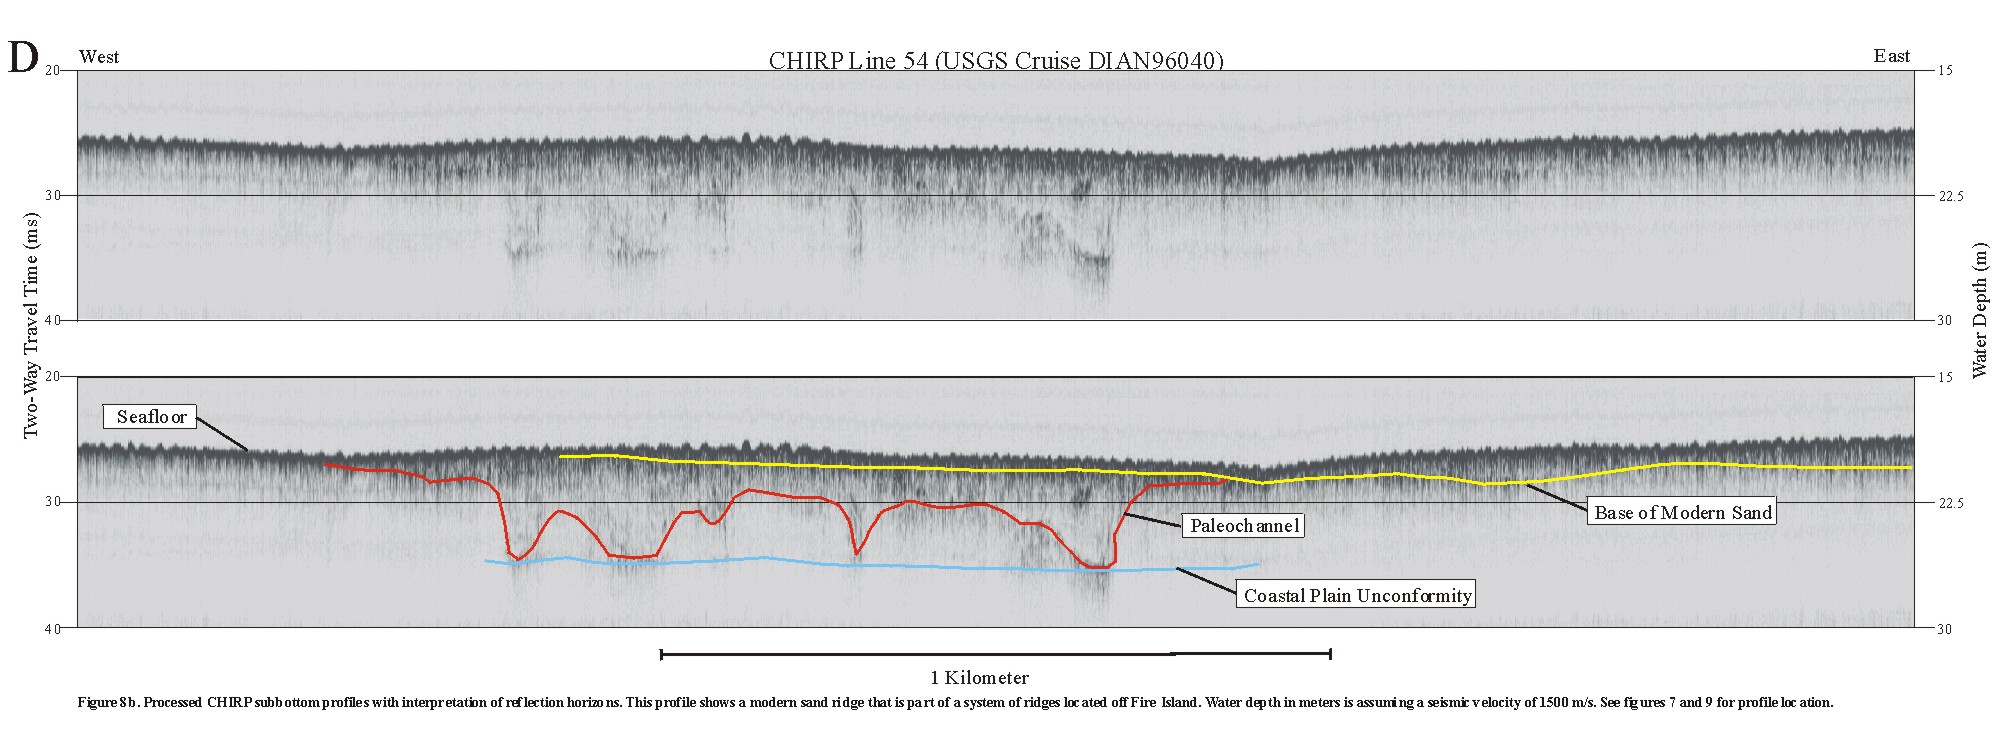
Figure 8b. Processed CHIRP
subbottom profiles with interpretation of reflection horizons. This profile
shows a modern sand ridge that is part of a system of ridges located off
Fire Island. Water depth in meters is assuming a seismic velocity of 1500
m/s. See figures 7 and 9 for profile location. |
|
|
|
|
|
|
|
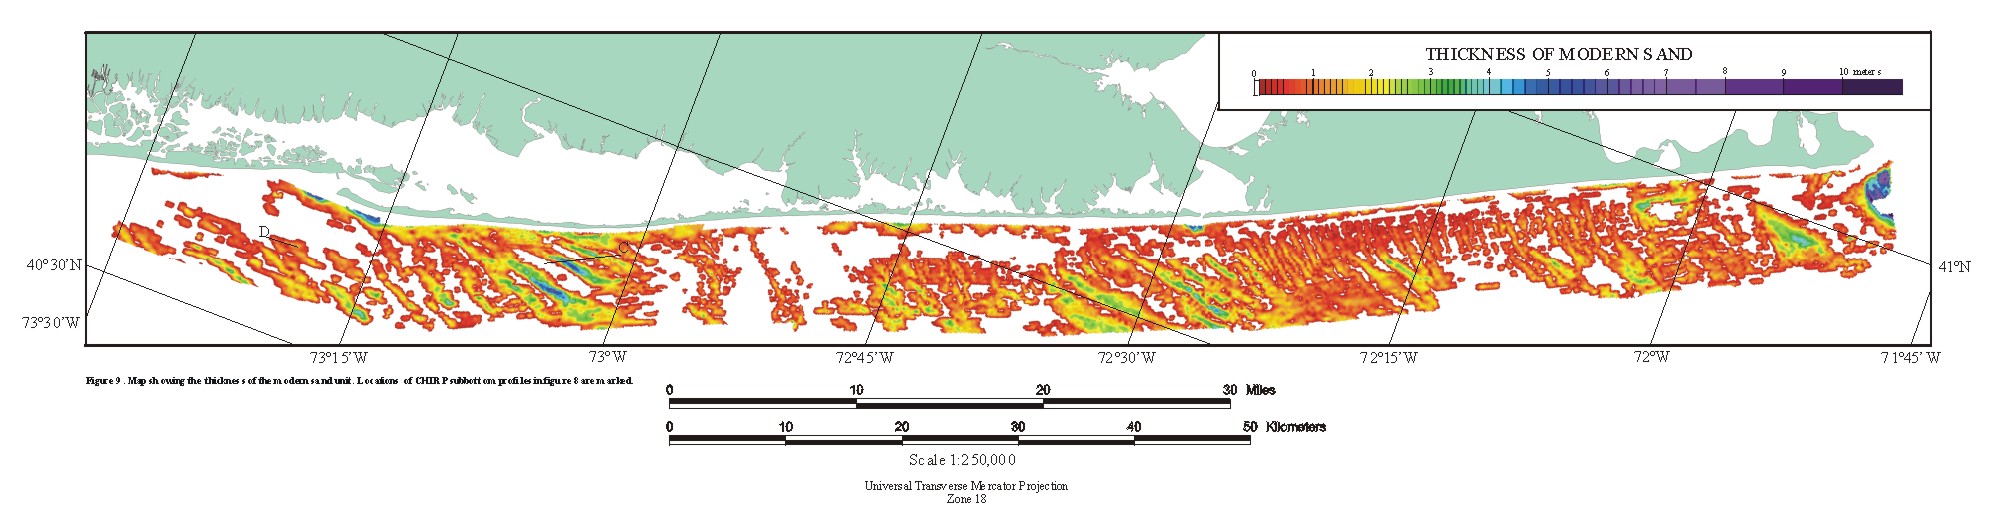
Figure 9. Map showing the
thickness of the modern sand unit. Locations of CHIRP subbottom profiles
in figure 8 are marked. |
|
|
|
|