
|
||||||||||||||||||||||||||||||
|
derived
from Schwab, W.C., Denny, J.F., Butman, B., Danforth, W.W., Foster,
D.S., Swift, B.A., Lotto, L.L., Allison, M.A., and Thieler, E.R.. 2000.
Seafloor Characterization Offshore of the NewYork-New Jersey Metropolitan
Area using Sidescan-Sonar: U.S. Geological Survey Open-File Report 00-295
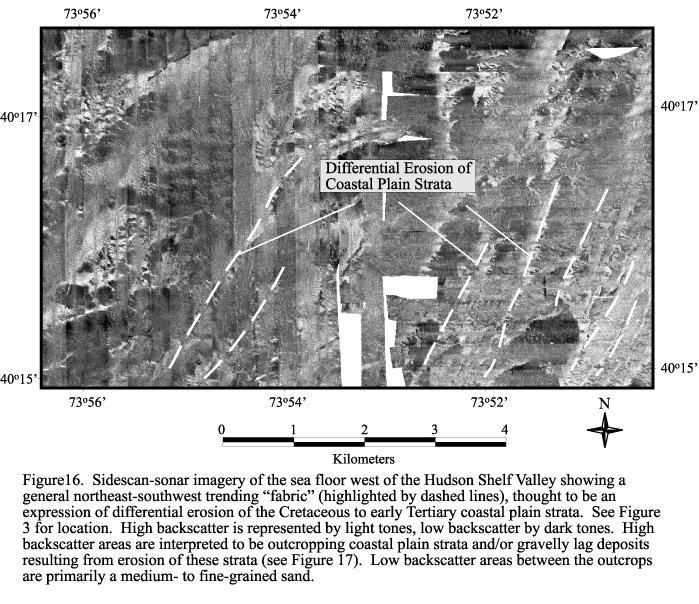
|
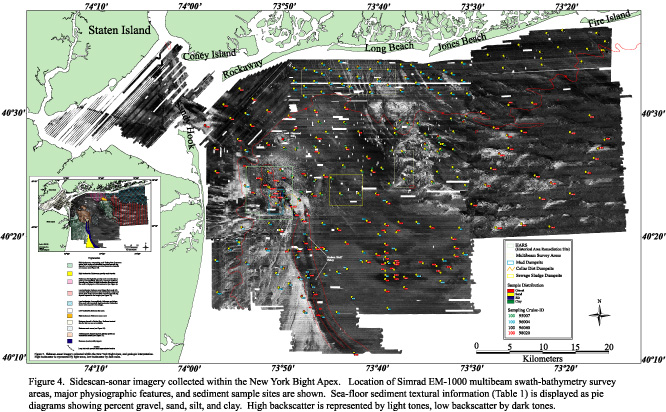
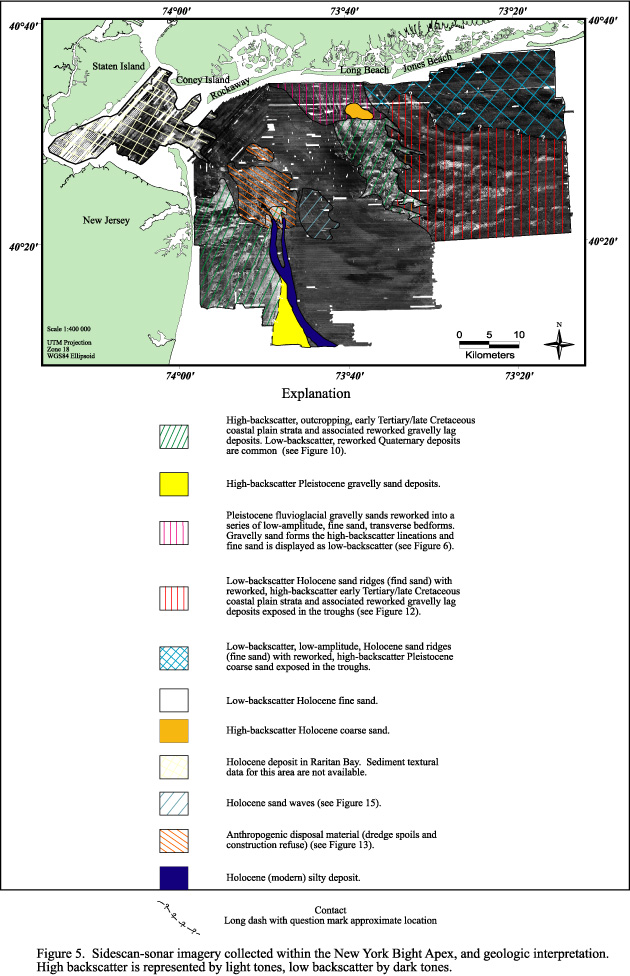
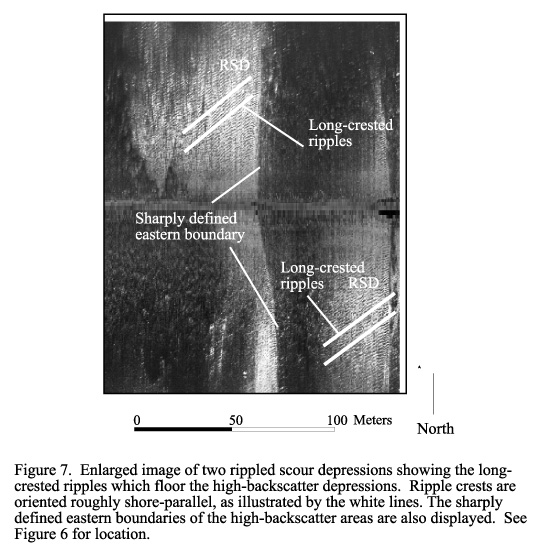
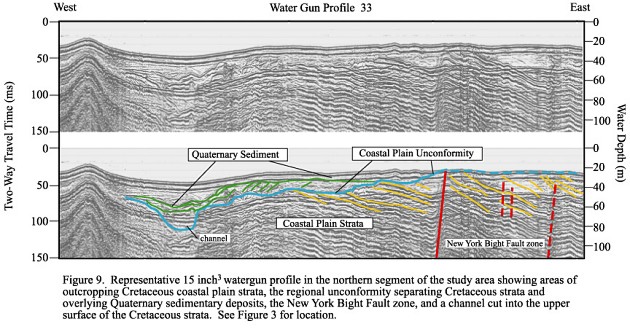
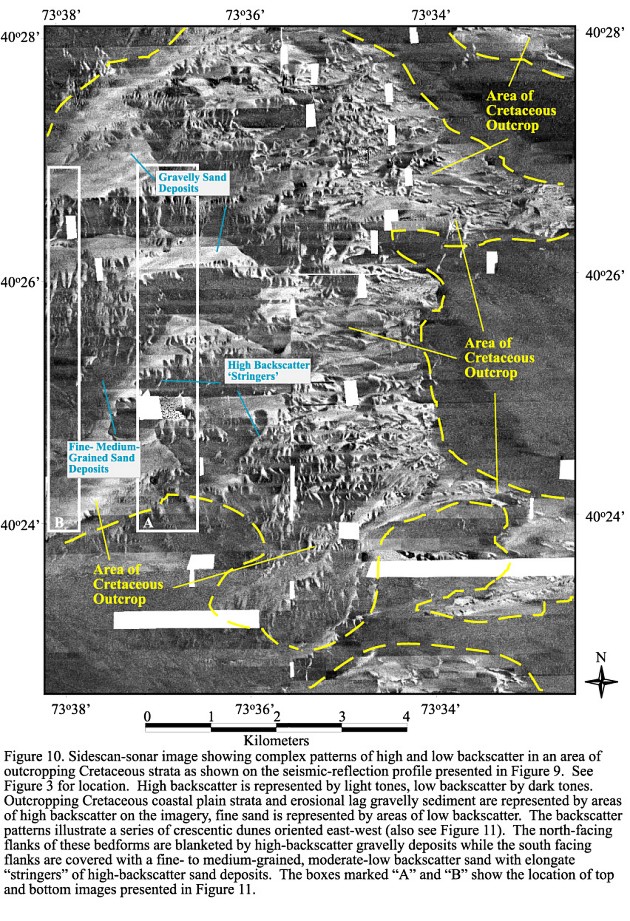
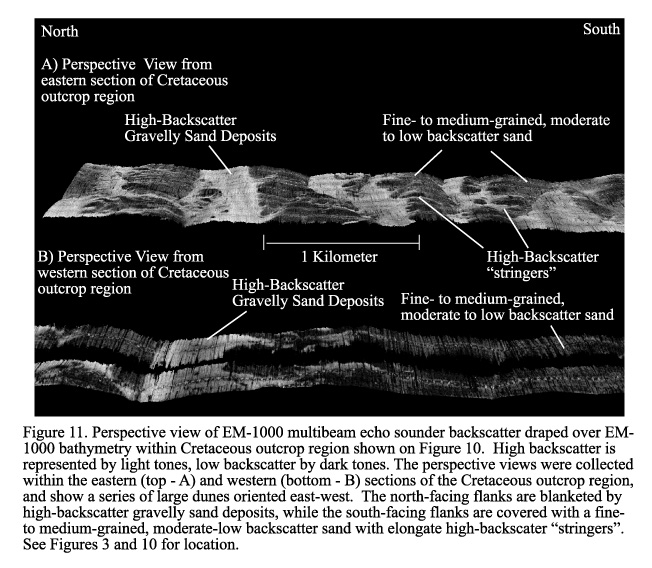
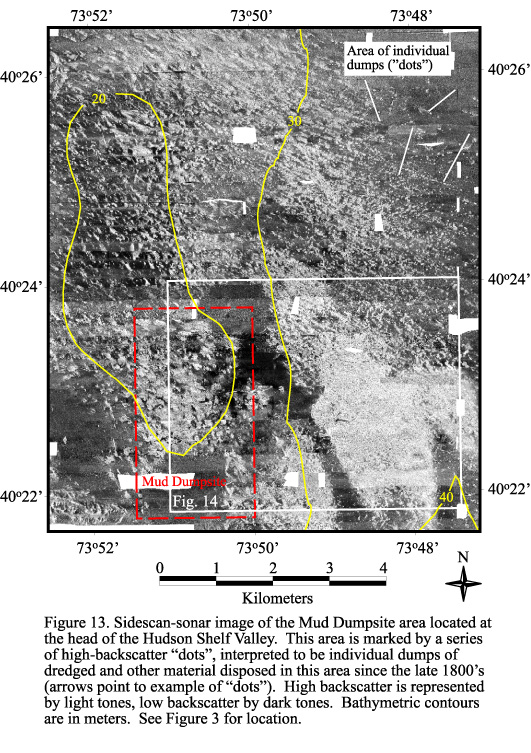
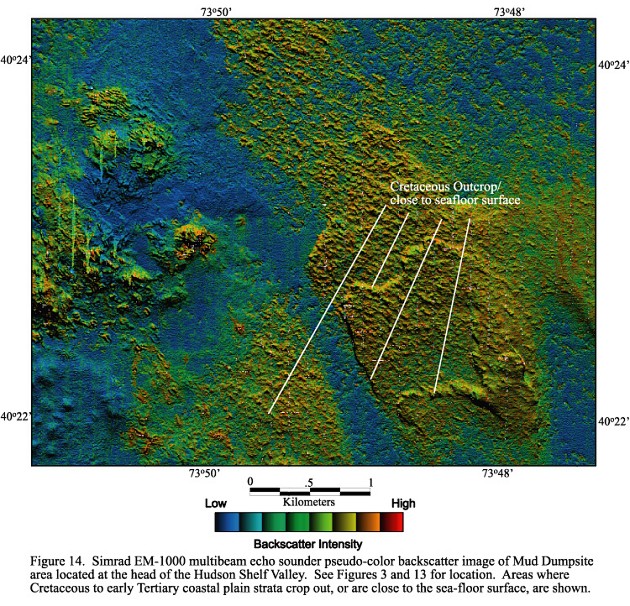
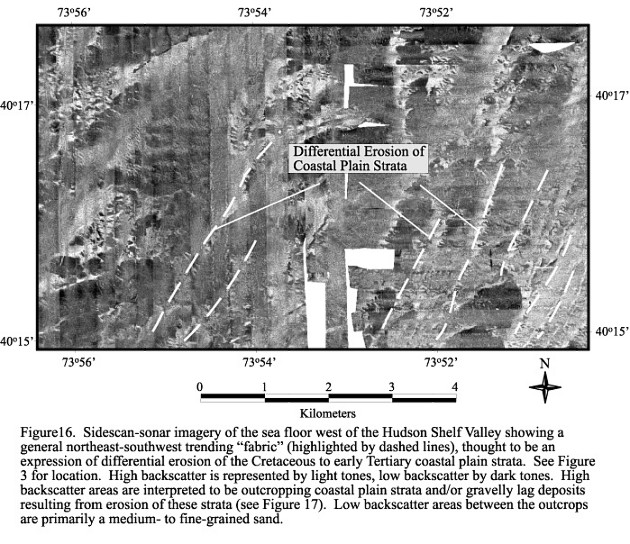
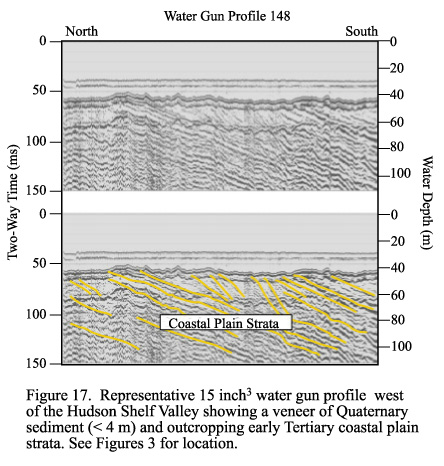
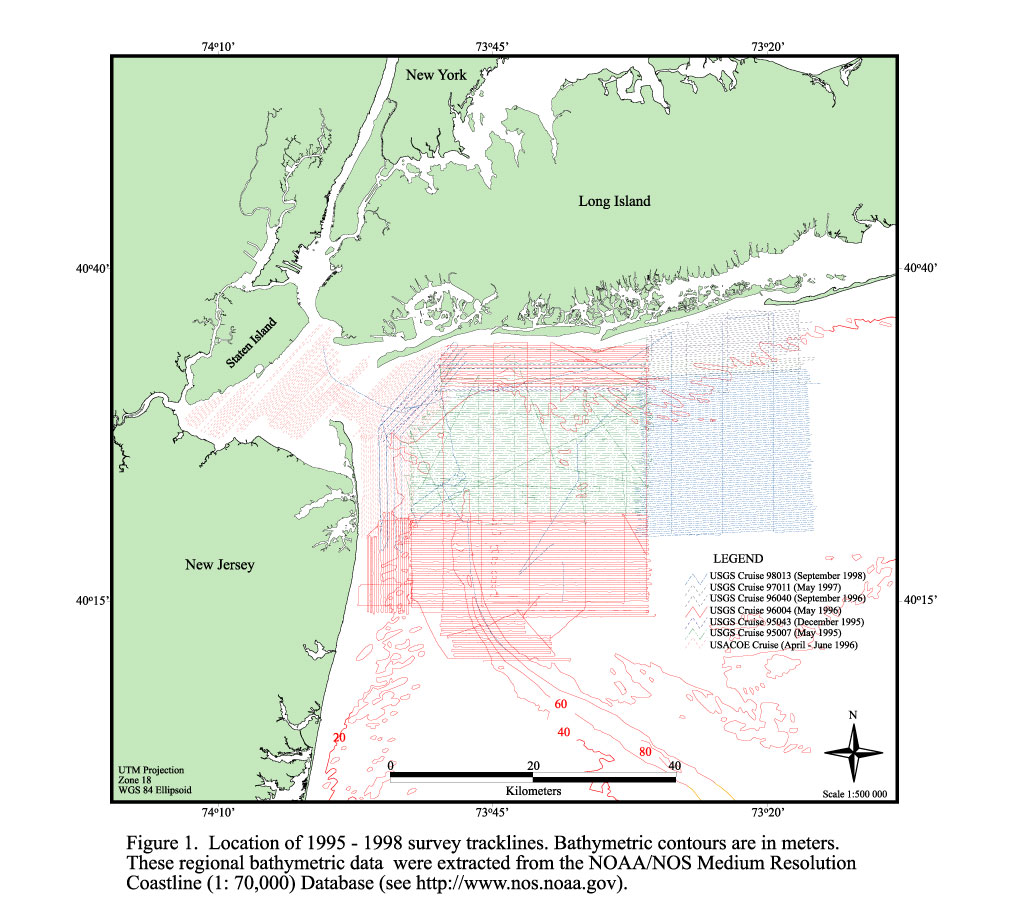
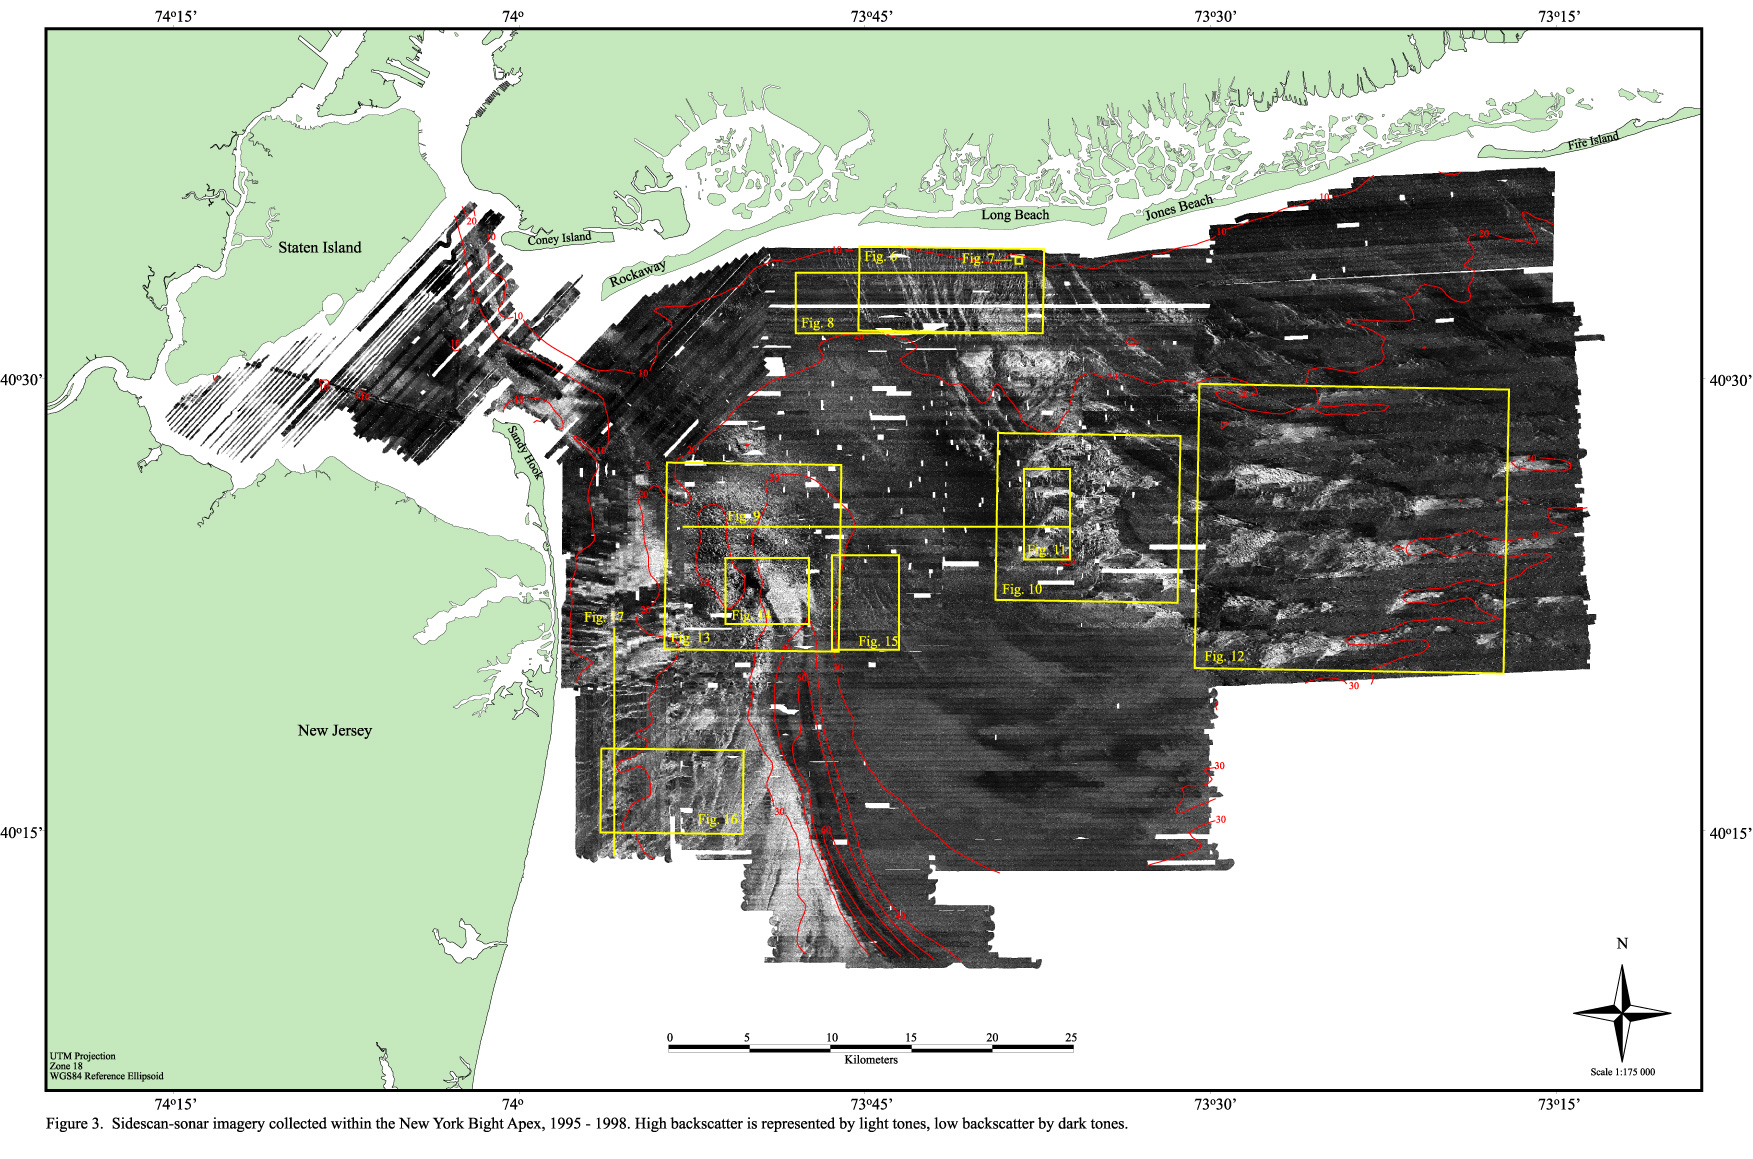
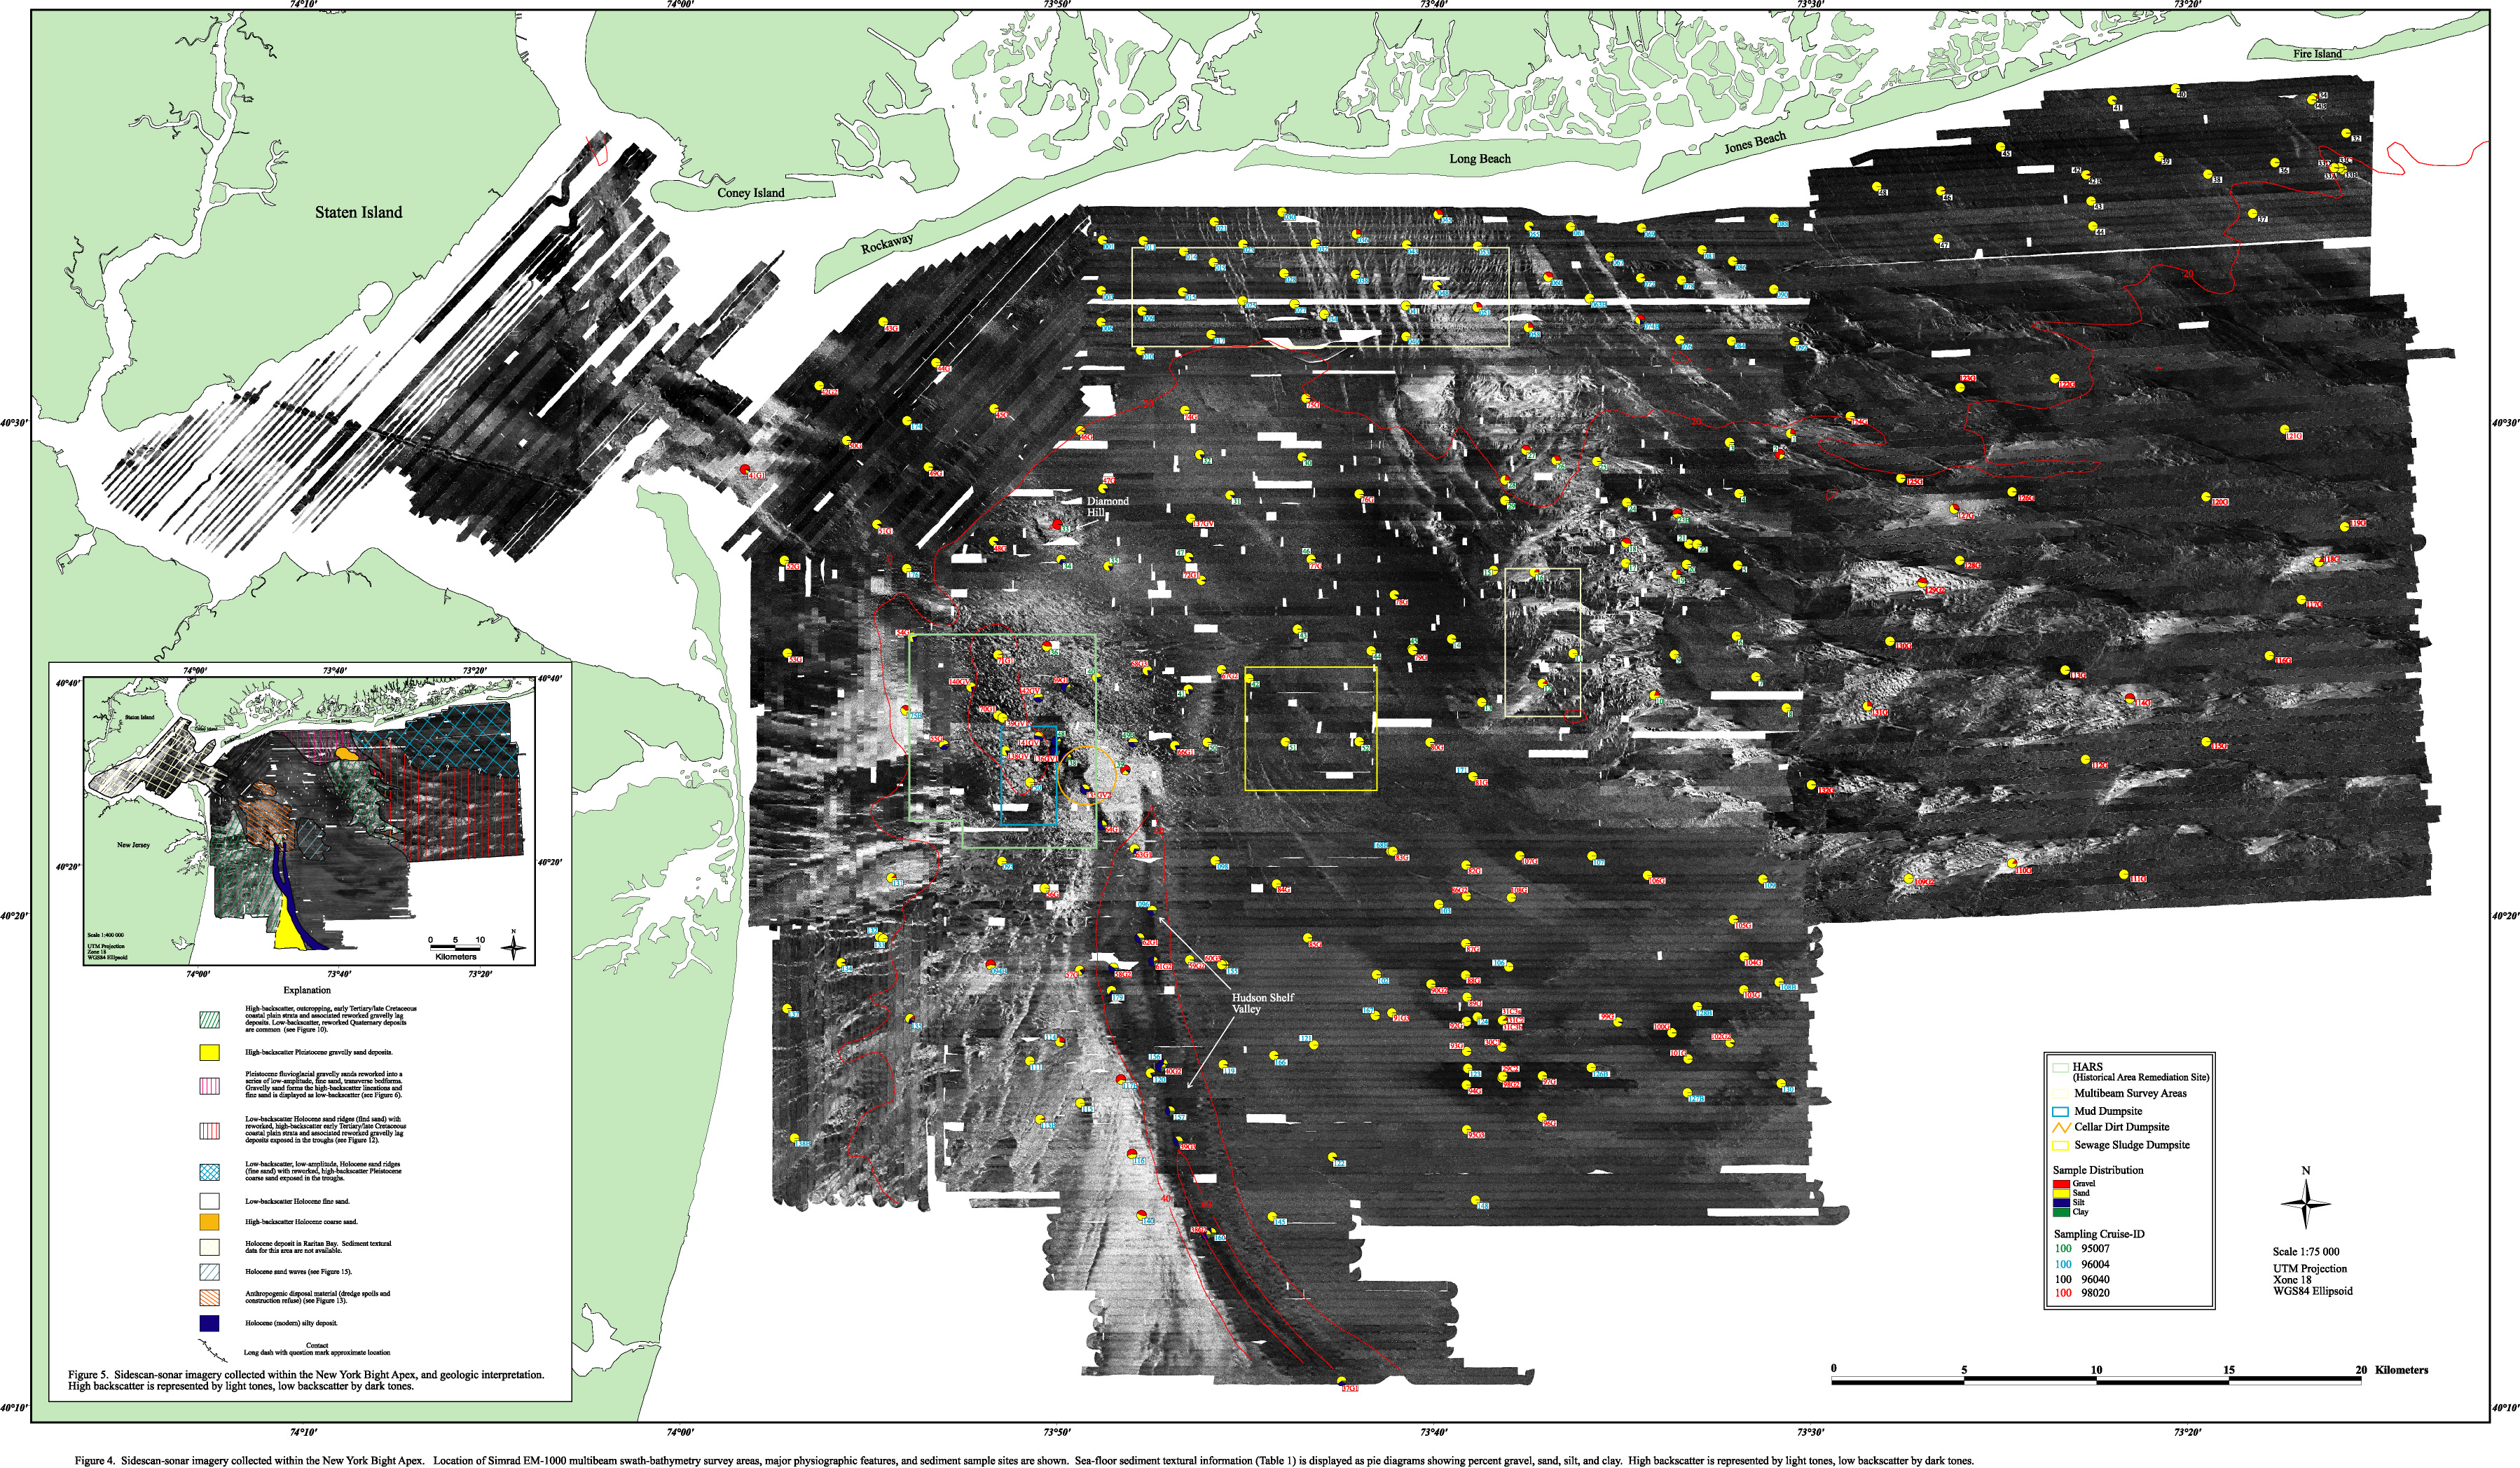
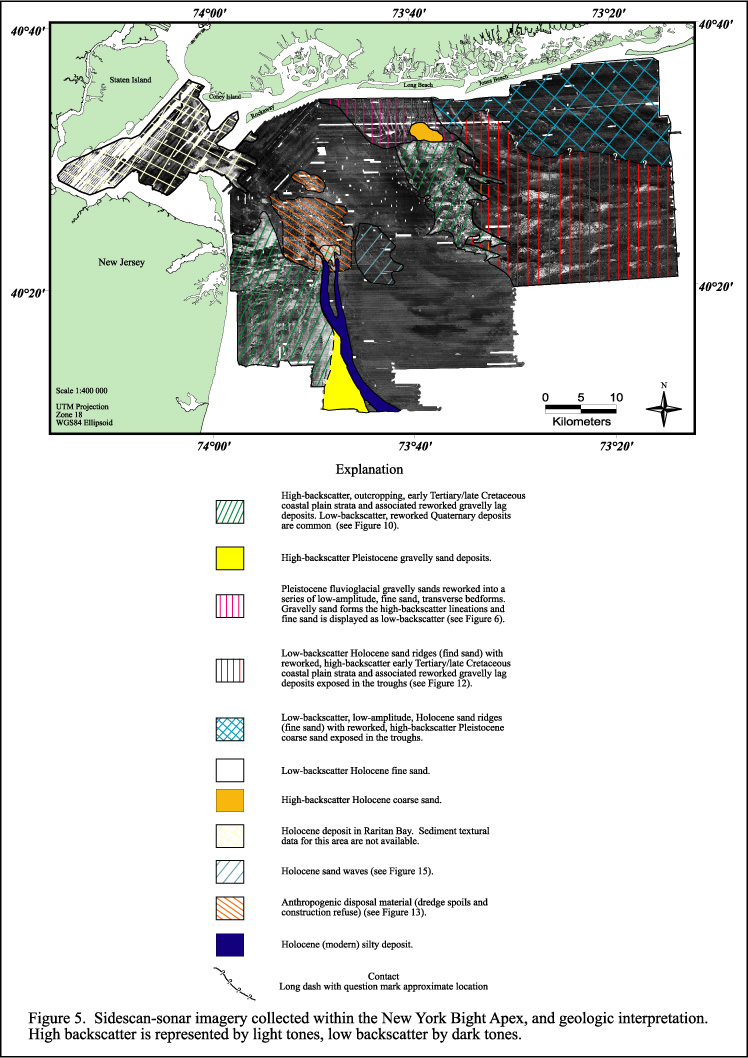
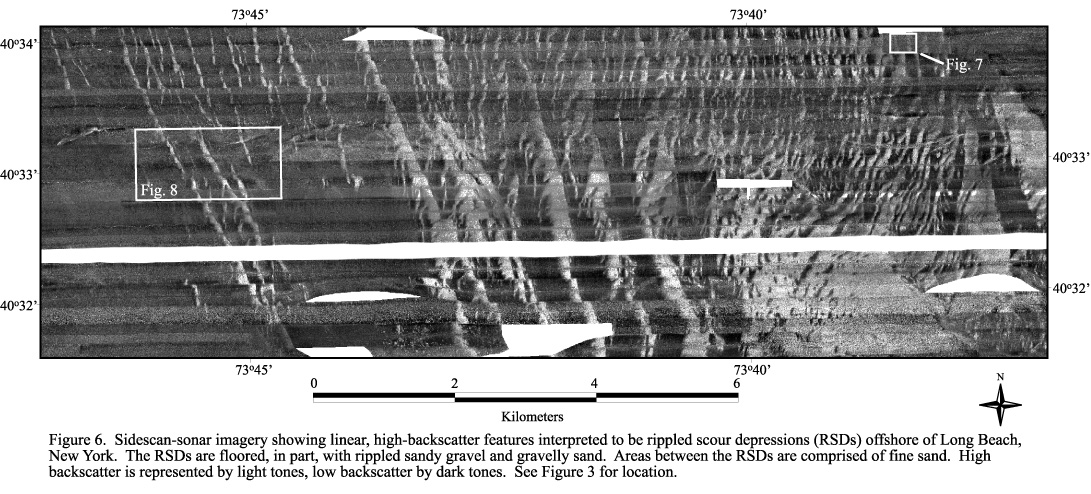
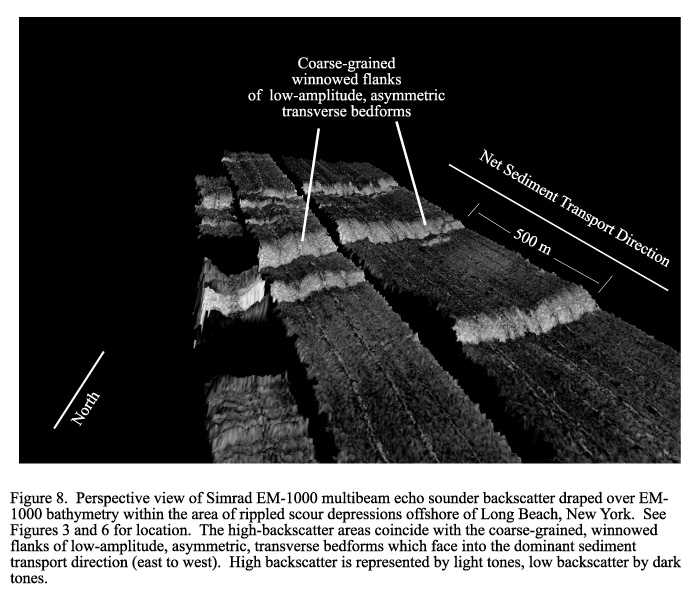
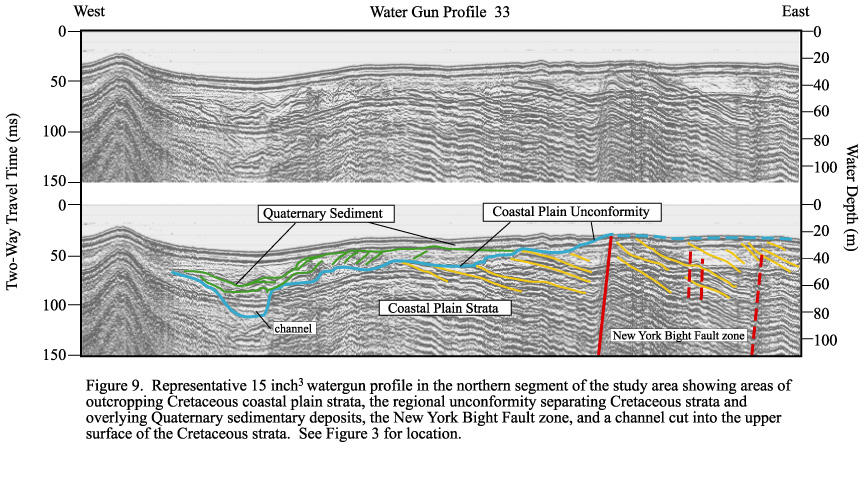
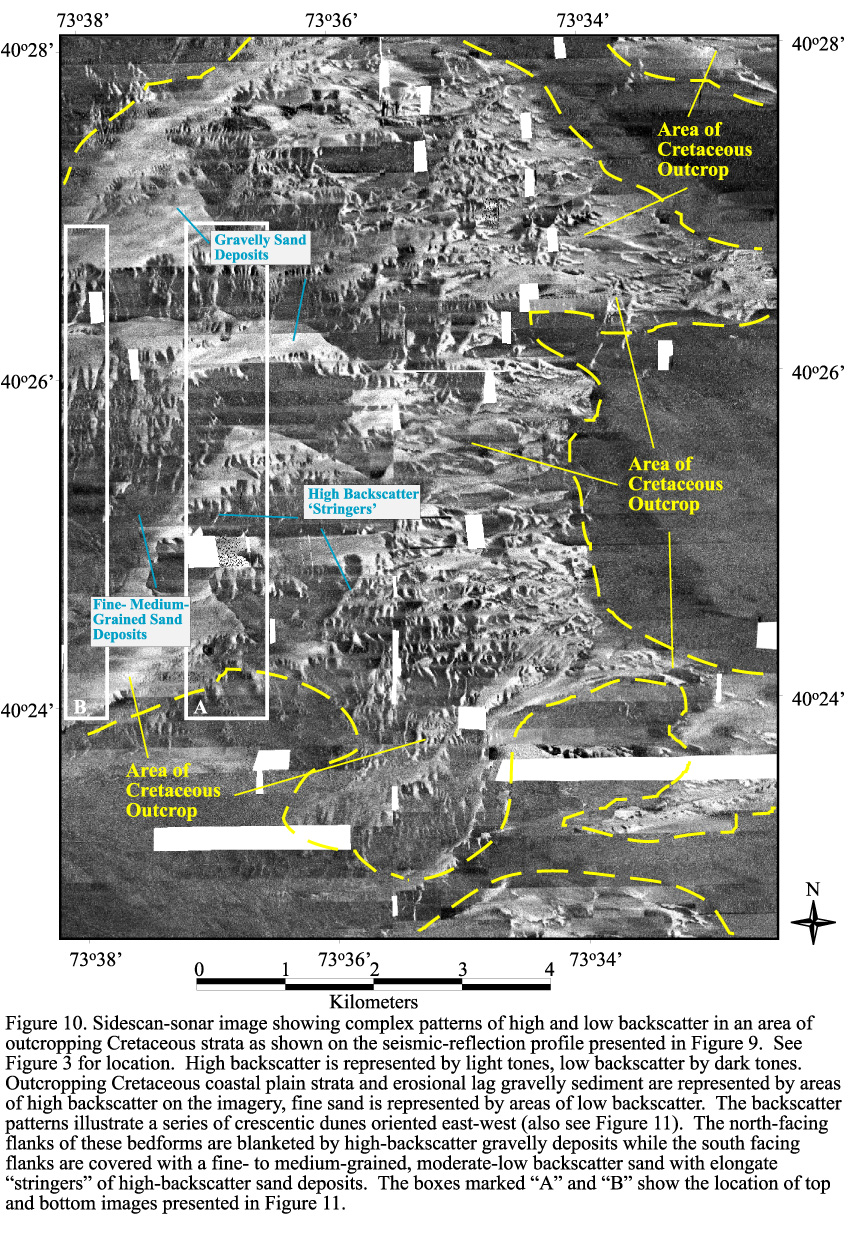
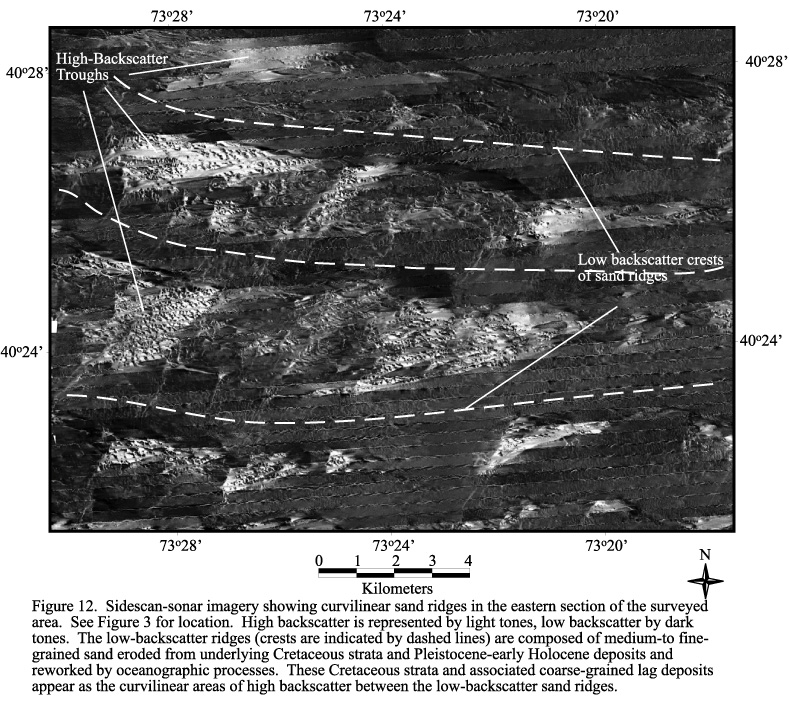
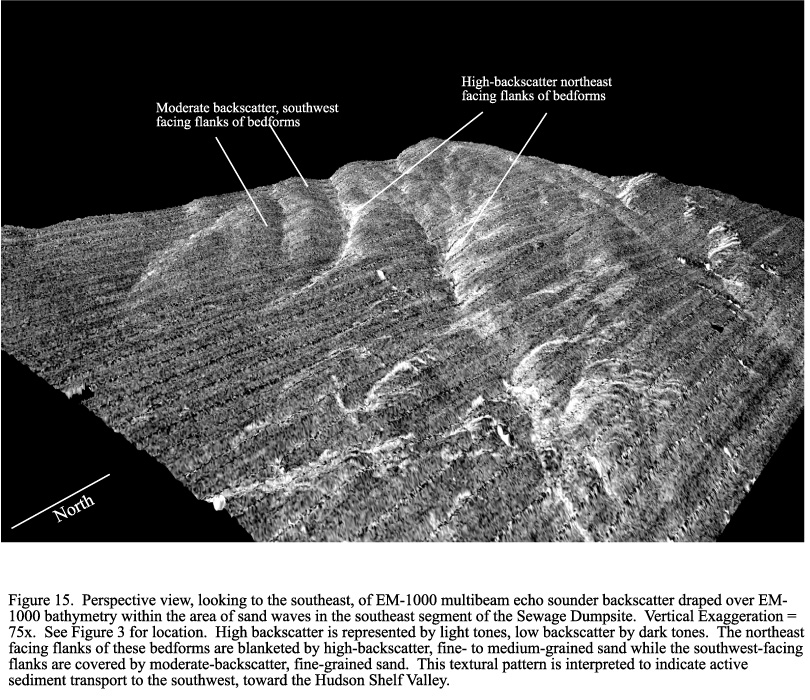
A focus for the U.S. Geological Survey (USGS) Coastal and Marine Geology Program is reconnaissance mapping of the shallow Exclusive Economic Zone (EEZ), with initial emphasis on the heavily utilized areas of the sea floor offshore of major metropolitan centers. The objective is to develop a detailed understanding of the sea-floor geology that will provide information for a wide range of management decisions and form a basis for further process-oriented investigations. In 1995, the USGS, in cooperation with the U.S. Army Corps of Engineers (USACOE), New York District, began a program designed to generate reconnaissance maps of the sea floor offshore of the New York - New Jersey metropolitan area (Schwab and others, 1997b), one of the most populated coastal regions within the United States (Fig. 1). This mapping effort differs from previous studies of this area (e.g.,Williams, 1976; Freeland and Swift, 1978) by obtaining digital, sidescan-sonar images that cover nearly 100 percent of the sea floor (Figs. 2 and 3). The sidescan-sonar data were digitally mosaicked and incorporated into a geographic information system (GIS) of the New York Bight region. Preliminary interpretations of data collected in 1995 and 1996 were presented in Schwab and others (1997a, 1997b) and Lotto (1999). Preliminary interpretations of multibeam swath bathymetry data collected over the Hudson Shelf Valley area were presented in Butman and others (1998). In this report, we expand on these earlier reports and present a composite sidescan-sonar image of the sea floor collected during surveys conducted between 1995 to 1998, along with further interpretations. Back to the top of the page This high-resolution sea-floor mapping investigation of the New York Bight Apex was motivated by the need: 1) to develop an environmentally acceptable solution for the disposal of dredged material from the New York and New Jersey ports; 2) to identify potential sources of sand for nourishment of the southern shore of Long Island; and 3) to develop a better understanding of the transport and long-term fate of contaminants by investigating the present distribution of materials discharged into the New York Bight over the last 100+ years. Long-Term Fate of Contaminants - Approximately 125 x 106 m3 of sewage sludge from the New York - New Jersey metropolitan region was disposed at a site 20 km offshore (Fig. 4) between 1923-1987 (O'Reilly and others, 1992). The Hudson Shelf Valley (Fig. 4), which lies south of the disposal site, cuts across the continental shelf and provides either a potential long-term sink for, or a conduit for, cross-shelf transport of this material. Recent studies have shown that some sewage sludge material has been transported south from the disposal site into the Hudson Shelf Valley where it is deposited in a series of bathymetric lows, reworked by biologic organisms, and occasionally resuspended during storm events (Buchholtz ten Brink and others, 1994, 1996). In addition, sewage sludge remaining in the original disposal site has been reworked and, in places, partially buried by fine-grained sand (Buchholtz ten Brink and others, 1996). Disposal of Dredge Spoils - Over the past 80 yr, the study area has received about 250 x 106 m3 of dredge spoils and construction refuse (Feeland and Swift, 1978; USACOE, 1996) (Fig. 4). Approximately 5 x 10⁶ m3 of material needs to be disposed of each year to maintain the ports of New York and New Jersey; ports that serves a regional market of about 15 million people (Fawsett and Marcus, 1991; Port Authority of New York and New Jersey, 1996). The USACOE is developing a management plan for disposal of both uncontaminated and contaminated dredged materials (US Army Corps of Engineers, 1996). Erosion of the South Shore of Long Island - Long-term erosion of the barrier islands along the south shore of Long Island, New York, has led the USACOE to begin long-term planning for potential renourishment of selected regions of the shoreline (U.S. Army Corps of Engineers, New York District, 1993). Such activities require an understanding of sources and the transport of sand in the inner shelf region (Schwab and others, 1999, 2000). These activities, as well as others, will benefit from this regional mapping of the surficial geology and the near-surface stratigraphy of the New York Bight Apex. The sea-floor mapping program being overseen by the USGS provides a detailed regional framework for developing this understanding. Back to the top of the page The study area was surveyed using high-resolution sidescan-sonar and seismic reflection techniques (Fig. 1). Surface sediment samples were collected to provide ground-truth information for the interpretation of these data (Fig. 4 and Table 1). The area was surveyed in May 1995 and May 1996 using the RV SEAWARD EXPLORER (cruises 95007 and 96004), in December 1995 using the RV ARGO MAINE (cruise 95043), in September 1996 and May 1997 using the RV DIANE G (cruises 96040 and 97011), and in September 1998 using the FV ALPHA & OMEGA (cruise 98013) (Fig. 1). In addition, the USACOE Waterways Experiment Station (WES) surveyed Raritan Bay and the nearshore areas in the vicinity of New York Harbor (Fig. 1) in April-June 1996. Specific sites within the study area were surveyed using a Simrad EM-1000 multibeam echo sounder (in addition to the surveys reported by Butman and others, 1998) in order to acquire high-resolution bathymetric data coincident with sidescan-sonar backscatter data. These areas (Fig. 4) were surveyed in November 1996 and November 1998, using the Canadian Hydrographic Service (CHS) RV FREDERICK G. CREED. This report focuses on the sidescan-sonar data collected by the USGS. The WES data (Fig. 1) were corrupted during acquisition, thus are not useful for high-resolution analyses but are included to complete the overview. Preliminary interpretation of the subbottom data was presented in Schwab and others (1997a, 1997b) and Lotto (1999). The geophysical data were acquired using a 100-105 kHz swept-frequency sidescan-sonar system, a 2-7 kHz swept FM (CHIRP) subbottom profiler, a 500-2000 Hz Geopulse boomer subbottom profiler, a two-channel 15 in3 (~250 Hz) watergun seismic-reflection system, a broad band (50 Hz - 4 kHz) sparker seismic-reflection system, a 3.5 kHz subbottom profiler, and a 200 kHz fathometer. Sidescan-sonar, CHIRP subbottom, and fathometer data were collected on all USGS cruises. Watergun subbottom data were collected on cruises 95007, 96004, and 98013. Geopulse subbottom data were collected on cruises 95007, 95043, 96004, 96040, and 97011. Sparker subbottom data were collected on cruise 98013. The watergun data were acquired digitally at a 5 s fire interval, 512 ms sweep, and 0.48 ms sample interval. The CHIRP subbottom data were acquired digitally at a 125 ms fire interval, 125 ms sweep, and 0.122 ms sample interval. In 1995, the Geopulse data were collected at a 0.5 s. fire and 500 ms sweep in analog form only. In 1996, the Geopulse data were acquired digitally at a 0.5 s. fire, 500 ms sweep, and a 0.062 ms sample interval. In 1998, the sparker data were acquired digitally at a rate of 0.5 s. Ship tracklines were selected to provide continuous sidescan-sonar coverage of the sea floor. Sediment samples were collected using a Van Veen grab sampler modified to include camera and video systems. The multibeam data were acquired with a Simrad EM-1000 multibeam echo sounder. This system utilizes 60 electronically aimed beams spaced at intervals of 2.5� that can ensonify a swath of sea floor up to 7.5 times the water depth. Horizontal resolution, or the footprint of an individual beam on the sea floor, is approximately 10 percent of the water depth. Vertical resolution is approximately 1 percent of the water depth or better. Thus, for water depths of 20-50 m in the survey area the horizontal resolution is 1.3-5.0 m. and the vertical resolution is better than 0.5 m. Ship navigation was conducted using a Differential Global Positioning System (DGPS). The sidescan-sonar tow-fish (which includes the CHIRP subbottom profiler) was navigated using an acoustic-ranging system to provide distance from the ship to the tow-fish. The position of the tow-fish was calculated assuming the tow-fish was directly behind the research vessel; i.e., that it followed the ship trackline. This assumption is relatively accurate while the research vessel is traveling in a straight line with a small amount of tow cable deployed. However, the tow-fish position error increases in ship turns by 10's of meters. Therefore, the geophysical data collected during turns were not included in the composite imagery or final interpretations. Based on the ship navigation data, the position of bathymetric data, seismic-reflection data, and sample locations are accurate to within � 3 m. The ship navigation in conjunction with the ranging information provides accuracy of the sidescan-sonar imagery of approximately � 20 m. Back to the top of the page The sidescan-sonar data were logged digitally at a sample rate resulting in a 0.18-m pixel size in the across-track direction and approximately 0.14-m in the along-track direction following the methodology outlined in Danforth and others (1991). A median filtering routine (Malinverno and others, 1990) was applied to the sidescan-sonar data to remove speckle noise, resulting in a 0.73-m pixel size. The data were further processed and digitally mosaicked using procedures described in Danforth and others (1991), Danforth (1997), and Paskevich (1992) resulting in an enhanced, geographically correct, sidescan-sonar mosaic with 4 meters/pixel resolution (Fig. 2). The CHIRP, Geopulse, and watergun subbottom data collected prior to 1998 were logged digitally and processed using the PROMAX (Landmark Graphics Corporation) software package. The watergun data collected in 1995 were processed using an Ormsby minimum-phase band-pass filter (100-580 Hz), and applying a time-varying gain from 0-50 ms (> 50 ms constant gain). A minimum-phase spiking deconvolution was applied to the watergun data collected in 1996 to remove reverberation. The CHIRP subbottom data were processed by decimating the traces by 4 (keeping every fourth trace), combining and averaging 2 traces, and applying a time-varied gain from 0-100 ms. A static correction for tow-fish depth was added to the CHIRP data collected in 1996 (this information was not available for the data collected in 1995). The Geopulse data were processed by combining and averaging 4 traces and using a minimum-phase spiking deconvolution (operator length = 10 ms) to remove reverberation, applying an Ormsby minimum-phase band-pass (325-3000 Hz), and applying a time-varying gain from 0-25 ms (>25 ms, constant gain). All of the subbottom data collected in 1998 were processed onboard ship using the SEISMIC UNIX processing software. The CHIRP data were decimated by two (keeping every other trace) and a static shift to correct for tow-fish depth was applied before archiving the data in SEG-Y format. A time-varying gain was applied before plotting the CHIRP profiles. The sparker and watergun data were band-pass filtered with a zero-phase, sine-squared tapered filter between 100-2000 Hz (sparker) and 150-1700 Hz (watergun) before applying a time-varied gain. Bathymetric data were collected digitally at 0.17 samples per minute using a 200-kHz fathometer (Fig. 2). These data were processed to remove water-depth variations due to vessel heave, transducer draft, and tidal fluctuations. The vertical resolution of the bathymetric data is approximately 10 cm. The data were reduced by a factor of 2 in the along-track direction in order to reduce trackline bias within the data. These data were then gridded, using a 300-m grid cell size, and contoured using the EarthVision software package (Dynamic Graphics, Inc). A suite of Van Veen grab samples was collected in order to groundtruth the acoustic facies identified on the sidescan-sonar imagery (Figs. 4 and 5). Grain-size analyses of the sediment samples (Table 1) were conducted using a combination of wet sieve and Coulter Counter techniques following the methodology of Poppe and others (1985). The multibeam data were acquired digitally and processed using software developed by the Ocean Mapping Group, University of New Brunswick (see World Wide Web URL http//www.omg.unb.ca/~jhc/SwathEd.html). Tidal elevations measured at the NOAA Sandy Hook station were used to adjust the data for the tidal fluctuations and reference the data to mean lower low water. Back to the top of the page The sidescan-sonar imagery (Figs. 2 and 3) identifies a range of features and sea floor environments in the study area (Fig. 5), and provides insight into the processes controlling the distribution of sediments and associated contaminants on the sea floor. One of the most striking characteristics of the sidescan-sonar imagery is the variability in acoustic backscatter over short spatial scales. The sea floor appears very inhomogeneous on scales of 100's of meters when mapped with 100-percent sidescan-sonar coverage, compared to descriptions based on seismic-reflection profiles or widely spaced sediment samples, which suggest that the seafloor lithology is much more uniform (e.g., Williams, 1976; Williams and Meisburger, 1987; Freeland and Smith, 1978). From north to south (not including the area mapped by WES (Fig. 1), some principal features observed on the sidescan-sonar imagery include: (1) In the nearshore area off Long Beach, there are sharply defined, linear, shore-perpendicular to slightly shore-oblique, high-backscatter features on the sidescan-sonar imagery (Figs. 3, 4, 5, 6). These features have been interpreted to be rippled scour depressions (Schwab and others 1997a, 1997b). Rippled scour depression (RSD) is a term used by Cacchione and others (1984) to describe similar morphologic features in other inner-continental shelf environments. The RSDs off Long Beach extend from the nearshore limit of the area surveyed (~8 m water depth) to approximately 9 km offshore (~19 m water depth). These RSDs are <1 m deep and are 40 to 250 m wide and can be continuously traced up to 6km. These depressions are, in part, floored with straight-crested, rippled, sandy gravel and gravelly sand, which are represented as areas of high backscatter on the sidescan-sonar imagery (Fig. 6); ripple crests are oriented roughly parallel to the shoreline (Fig. 7). The continuous long-crested shape of individual ripples suggests that they are primarily wave generated. Seismic-reflection profiles (Schwab and others, 1997a. 1997b; Lotto, 1999), grab samples, (Fig 4; Table 1), and unpublished USGS and USACOE core data indicate that the sandy gravel and gravelly sand are Pleistocene glaciofluvial sediment exposed and reworked at the sea floor. Between the RSDs, surface sediments are fine sand and are represented as areas of relatively low backscatter on the sidescan-sonar imagery. Multibeam bathymetry data (Fig.8) are interpreted to indicate that the RSDs off Long Beach are the coarse-grained winnowed flanks of low-amplitude, asymmetric, transverse bedforms. These winnowed, high-backscatter flanks face into the dominant sediment transport direction (west to east). Thus, we suggest that these RSDs are formed due to ongoing erosion of the inner-continental shelf and, in turn, the general morphology of the nearshore segment of the inner-continental shelf (Fig. 6) is a result of the active formation and modification of a ravinement surface. (2) South of the RSDs off Long Beach, in the central part of the study area, seismic profiles (Fig. 9) show that Cretaceous-age coastal plain strata crop out on the sea floor and are covered in places with a thin veneer of sediment. The particularly complex pattern of high and low backscatter expressed on the sidescan-sonar imagery from this area (Fig. 10) and the presence of gravel (in part, an erosional lag deposit from the outcropping Coastal Plain Strata), fine sand, and rock outcrops (Fig. 4; Table 1) are consistent with this interpretation. The entire high-backscatter area is interpreted to be an area dominated by erosional processes. The regional bathymetry (Fig. 2) suggests that in early Holocene, this area was an emergent headland cored by Cretaceous coastal plain strata. Backscatter patterns over this area illustrate a series of large dunes oriented east-west (Figs. 10 and 11). These bedforms are approximately 2 m high, have a wavelength of approximately 1.5 km, and occur in an area with <4 m of Quaternary sediment cover. The north-facing flanks of these bedforms are blanketed by high-backscatter gravelly sand deposits while the south facing flanks are covered with a fine- to medium-grained, moderate-low backscatter sand with elongate "stringers" of high-backscatter sand deposits (Fig. 11). We interpret these bedforms as crescentic dunes composed of reworked Cretaceous coastal-plain material and Quaternary sediment deposits. The curvilinear shape of the dunes is thought to indicate a dominant southerly bedload transport direction; with the finer grained, lower backscatter sediment deposited on the leeward side of the bedforms. This bedload transport to the south is consistent with the dominant transport direction during northeast storms (Butman and others, 1979). Where not exposed on the sea floor, contact between these coastal plain strata and overlying Quaternary deposits is expressed as a major regional unconformity in subbottom profiles. Seismic-reflection profiles (Fig. 9) reveal that a complex series of fluvial channels were cut into the coastal plain strata off the south shore of Long Island and have been filled with up to 50 m of Quaternary sediment (Williams, 1976; Schwab and others, 1997a, 1997b; Lotto, 1999) (3) In the eastern segment of the study area, a series of curvilinear sand ridges is the dominant feature on the sea floor (Fig. 12). The sand ridges, initially recognized by Duane and others (1972), appear as areas of relatively low backscatter on the sidescan-sonar imagery, separated by relatively higher backscatter troughs. The ridges appear to be formed of medium- to fine-grained sand (Fig. 4 and Table 1) that was eroded from underlying Cretaceous strata and Pleistocene-early Holocene deposits and reworked by oceanographic processes. These Cretaceous strata and associated coarse-grained lag deposits appear as the curvilinear areas of high backscatter between the low-backscatter sand ridges in the southwest segment of the study area (Fig. 5). Landward of this segment, in the nearshore areas off Jones Island, moderate-to low backscatter Pleistocene glaciofluvial sediment are exposed in the troughs of the low-backscatter sand ridges (Fig. 5; Foster and others, 2000). The ridges are interpreted to have initially formed as shoreface-attached sand ridges (angles of 30�- 40� to the shoreline) following mechanisms described in Swift and others (1981), Swift and Field (1984), Trowbridge (1995), and Calvette and others (1999). These sand ridges were subsequently stranded during Holocene transgression over the Cretaceous-cored headland in the central part of the study area described above. (4) Diamond Hill mound (Fig. 4), the location of Ambrose Light, was formed by dumping sometime between 1845 and 1888 (Williams,1976). This dumpsite is expressed as a bathymetric high approximately 8 m higher than the surrounding sea floor and on the sidescan-sonar imagery (Fig. 2) as an area of numerous, overlapping high backscatter "dots" which are interpreted to represent individual dumps. (5) The Mud Dumpsite (Figs. 4 and 13), presently used for disposal of dredge spoils from the New York Harbor estuary, is roughly defined by the 20-m isobath, about 10 m shallower than the adjacent sea floor. Subbottom profiles and multibeam data (Fig. 14) suggest that this is an area where the coastal plain strata crop out close to the seafloor surface (Schwab and others, 1997a, 1997b; Butman and others, 1998). Thus, disposal of dredge spoil is probably not the entire cause of the bathymetric high. The site, similar to those found in the area of Diamond Hill (Fig. 4), is marked by numerous small high-backscatter "dots" on the sidescan-sonar imagery (Fig. 13). These dots are interpreted as individual dumps of dredged and other material disposed in this region since the late 1800's (Freeland and Smith, 1978; US Army Corps of Engineers, 1996; Butman and others, 1998). The imagery reveals that historical dumping was not contained within any designated disposal site. Note that the surficial sediment characteristics in this region may vary considerably depending on whether the sample was collected over an individual dump, or adjacent to the dump in a low-backscatter area (Fig. 4; Table 1). (6) The relatively featureless low-backscatter area in the center of the study area ( centered at approximately 40�20'N latitude, 73�40'W longitude including the Sewage Disposal Site) coincides with an area in which approximately 25 m (<35 ms of subbottom penetration) of Quaternary sediment was deposited over the coastal plain unconformity, as indicated on subbottom profiles (Fig. 9). Surface sediment samples suggest that this is mostly a medium- to fine-grained sand deposit (Fig. 4; Table 1). The sidescan-sonar imagery suggests that there is active sediment transport in this area (Schwab and others, 1997a, 1997b). Here, sidescan-sonar and multibeam swath-bathymetry data (Fig. 16) identify a series of large sand waves with a wavelength of about 0.5 km and average height of 1 m. The northeast-facing flanks of these sand waves are covered by relatively higher backscatter fine- to medium-grained sand than their crests. Similar to the interpretation of the low-amplitude, transverse bedforms south of Long Beach presented above (Fig. 6), these sand waves are interpreted to indicate active sediment transport to the southwest toward the Hudson Shelf Valley, where the higher backscatter, northeast-facing flanks represent the winnowed areas that face into the dominant sediment transport direction (northwest to southeast). Additional support for active sediment transport in this area was reported by Buchholtz ten Brink and others (1994, 1996). These authors reported the burial and reworking of sewage sludge material visible in cores collect in the sewage disposal area. (7) The Hudson Shelf Valley cuts northward into the study area (Fig. 4), with the floor about 25 m deeper than the surrounding shelf near the valley head. The sediments on the shelf adjacent to the Hudson Shelf Valley are moderate- to low-backscatter fine sand to the east (Fig. 4; Table 1) and high-backscatter coarse sand, gravel, and boulders to the west (along with outcropping coastal plain strata; see below). The Hudson Shelf Valley is floored by low-backscatter fine-grained muddy sediment (Fig. 4; Table 1), which presumably has been winnowed from the surrounding shelf, including the disposal areas (Fig. 14). (8) Subbottom profiles over the area west of the Hudson Shelf Valley indicate that this is an area of relatively thin sediment cover (< 4 m) and outcropping coastal plain strata (Fig. 17). The complex patterns of high and low backscatter expressed on the sidescan-sonar imagery from this area (Fig. 3) due to the presence of gravel, fine sand, and rock outcrops (Fig.4; Table 1) are consistent with this interpretation. A general northeast-southwest trending "fabric" on the sidescan-sonar imagery (Fig. 16) is thought to be an expression of differential erosion of the Coastal Plain strata (bedding planes that strike northeast-southwest) which are covered, in places, by a thin veneer of fine-grained sediment. Thus, the high-backscatter areas on the imagery are interpreted to be either outcropping coastal plain strata or gravelly lag deposits resulting from the erosion of these strata. The low-backscatter areas between these outcrops are primarily a medium- to fine-grained sand. Back to the top of the page This report presents a preliminary synthesis of results of systematic high-resolution mapping of the sea floor of the New York Bight Apex, principally by means of 100%-coverage sidescan-sonar and seismic-reflection methods. The survey provides a new and detailed view of the sea floor, and a new framework for understanding the regional sediment transport system of the New York Bight. Preliminary interpretation of the imagery: (1) provides a framework for assessment of anthropogenic impact of historic and ongoing waste disposal operations; (2) shows changes in sediment properties over short spatial scales that are controlled by both modern processes and the subsurface stratigraphic and structural framework; (3) suggests active sediment transport toward the southwest which is consistent with the dominant transport direction during nor'easter storms (Butman and others, 1979). Back to the top of the page |
|||||||||||||||||||||||||||||


