|
|
|
| Introduction | |
| Methods | |
| Marine Transgressive Surface | |
| Thickness of Postglacial Sediments | |
| References | |
| Figure Captions | |
| Digital Data and Metadata | |
| Back to Table of Contents | |
|
|
|

Chapter 1
|
|
|
| Introduction | |
| Methods | |
| Marine Transgressive Surface | |
| Thickness of Postglacial Sediments | |
| References | |
| Figure Captions | |
| Digital Data and Metadata | |
| Back to Table of Contents | |
|
|
|
 analog
records were hand plotted and contoured at 1:80,000 scale in sections.
These contours were digitized using Arc/Info software and modified where
necessary along section boundaries to create maps of the marine transgressive
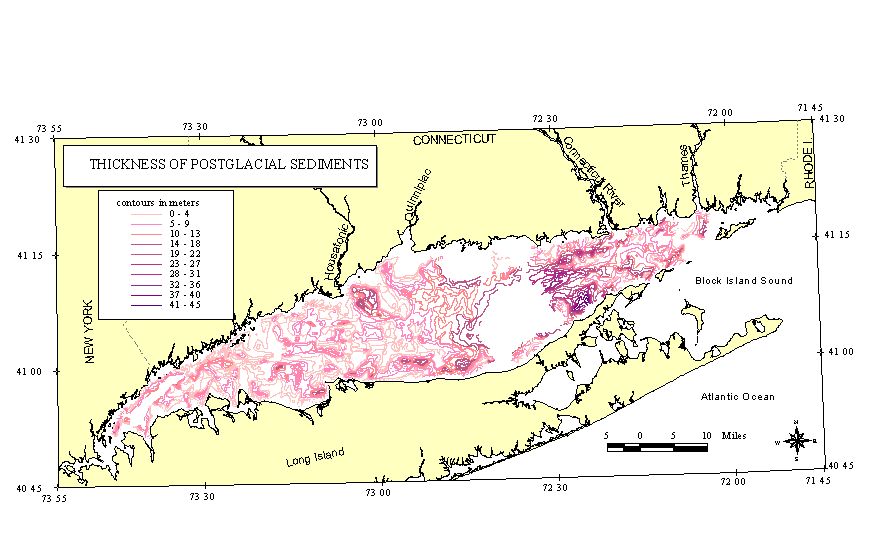
surface and the thickness of postglacial sediments (Figs.
2 and 3).
In order to generate a total volume from the thickness contours Arc/Info
TIN software was used to create a triangulated irregular network data model
representing a continuous surface. This method provided a volume estimate
that accounted for the sediment believed to exist where we had gaps in
the data matrix due to the presence of gas in the sediment. In areas
where the transgressive surface was not detected, obscured by gas, or eroded,
such as in the eastern sound (Fig. 2),
the distinctive seismic character of the marine section was sufficient
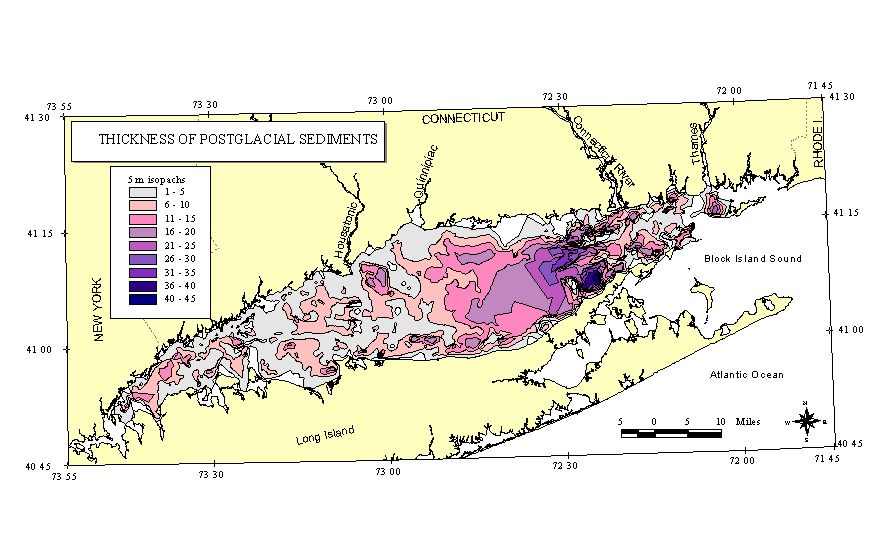
to map its thickness. New contours were then created from the TIN
(with minor edits where necessary); these are shown in Lewis and DiGiacomo-Cohen
(in press) and are also shown shaded in color in Figure
4. The new contours eliminated the problem that different contour
intervals were used the eastern verses the western portions of LIS in the
original mapping efforts.
analog
records were hand plotted and contoured at 1:80,000 scale in sections.
These contours were digitized using Arc/Info software and modified where
necessary along section boundaries to create maps of the marine transgressive
surface and the thickness of postglacial sediments (Figs.
2 and 3).
In order to generate a total volume from the thickness contours Arc/Info
TIN software was used to create a triangulated irregular network data model
representing a continuous surface. This method provided a volume estimate
that accounted for the sediment believed to exist where we had gaps in
the data matrix due to the presence of gas in the sediment. In areas
where the transgressive surface was not detected, obscured by gas, or eroded,
such as in the eastern sound (Fig. 2),
the distinctive seismic character of the marine section was sufficient
to map its thickness. New contours were then created from the TIN
(with minor edits where necessary); these are shown in Lewis and DiGiacomo-Cohen
(in press) and are also shown shaded in color in Figure
4. The new contours eliminated the problem that different contour
intervals were used the eastern verses the western portions of LIS in the
original mapping efforts.
To open a georeferenced display of the marine transgressive surface
and thickness of postglacial sediment themes in ESRI's ArcView program
make sure the application is loaded on your computer. Users should
go to the lisound directory located on the top level of this
CD-ROM and double click on the lisound.apr project file.
The individual ArcView shapefiles may also be opened directly with any
Arc application (e.g. ArcInfo, ArcExplorer) and can also be found on the
data
page. Further detailed information can be found on the ArcView
Project Filepage.
 The
depth of the marine transgressive surface (Fig.
2) ranges from 72 m in the east-central Sound to 6 m along the
shore. This is a time-transgressive erosional surface erosion that formed as
the sea transgressed westward across the sub-aerially exposed bed of Glacial
Lake Connecticut (Lewis and Stone, 1991; Stone and others., 1998). Along
the north and south shores of the underlying bedrock (north shore), coastal-plain
and moraine (south shore). In the vicinity of the Housatonic River the
expression of a large delta built into Glacial Lake Connecticut can be
seen. In several places along the LIS shoreline valleys associated
with streams and rivers also influence the shape of the unconformity (e.g.
Quinnipiac, Housatonic rivers). Beaches and/or spits associated with structural
highs appear to have formed on the marine transgressive surface in numerous
places (Mills, 1995). South and slightly west of the Connecticut River
the unconformity is truncated by modern erosion and is not present in eastern
LIS.
The
depth of the marine transgressive surface (Fig.
2) ranges from 72 m in the east-central Sound to 6 m along the
shore. This is a time-transgressive erosional surface erosion that formed as
the sea transgressed westward across the sub-aerially exposed bed of Glacial
Lake Connecticut (Lewis and Stone, 1991; Stone and others., 1998). Along
the north and south shores of the underlying bedrock (north shore), coastal-plain
and moraine (south shore). In the vicinity of the Housatonic River the
expression of a large delta built into Glacial Lake Connecticut can be
seen. In several places along the LIS shoreline valleys associated
with streams and rivers also influence the shape of the unconformity (e.g.
Quinnipiac, Housatonic rivers). Beaches and/or spits associated with structural
highs appear to have formed on the marine transgressive surface in numerous
places (Mills, 1995). South and slightly west of the Connecticut River
the unconformity is truncated by modern erosion and is not present in eastern
LIS.
 The
postglacial sediments (Figs.
3, 4) of LIS rest on the marine transgressive (Fig.
2) . These marine sediments
range in thickness from 0 to 45 m and represent a total volume of
The
postglacial sediments (Figs.
3, 4) of LIS rest on the marine transgressive (Fig.
2) . These marine sediments
range in thickness from 0 to 45 m and represent a total volume of
West of the Lake Hitchcock delta remnant, the marine deposits rarely exceed 16 m in thickness. Along the north and south shores of the Sound, the distribution of these sediments is influenced by the shape of the underlying bedrock, moraine, and perhaps coastal plain (Lewis and DiGiacomo-Cohen, in press). Large glacial-lake deltas and underlying river valleys also influence the sediment distributions in the nearshore (Lewis and DiGiacomo-Cohen, in press).
The abrupt thinning of the marine section east of the mouth of the Connecticut
River is inferred to be the result of extensive tidal scour in the eastern
Sound (Fenster, 1995; Knebel and Poppe, in press). The marine delta of
the Thames River lies just south of the River mouth.
Knebel, H.J. and Poppe, L.J., Sea-floor environments within Long Island Sound: A regional overview: Journal of Coastal Research, Thematic Section, in press.
Lewis, R.S. and DiGiacomo-Cohen, M.L., A Review of the Geologic Framework of the Long Island Sound Basin, With Some Observations Relating To Postglacial Sedimentation: Journal of Coastal Research, Thematic Section, in press.
Lewis, R.S. and Needell, S.W., 1987, Maps showing stratigraphic framework and Quaternary geologic history of eastern Long Island Sound: U.S. Geological Survey Miscellaneous Field Studies Map MF-1939-A, scale 1:125,000, 3 sheets.
Lewis, R.S. and Stone, J.R., 1991, Late Quaternary stratigraphy and depositional history of the Long Island Sound Basin: Connecticut and New York. Journal of Coastal Research, Special Issue No. 11, p. 1-23.
Mills, S., 1995, The Classification of Marine Transgressive Holocene Sand Bodies Found in Seismic Profiles of Long Island Sound: Williamstown, Mass., unpublished honors thesis, Williams College, 105 p.
Needell, S.W., Lewis, R.S., and Colman, S.M., 1987, Maps showing the
Quaternary geology of east-central Long Island Sound. U.S. Geological Survey
Miscellaneous Field Studies Map MF-1939-B, scale 1:125,000, 3 sheets.
Figure 2. Map showing the depth below present sea level to the marine transgressive surface. Contour interval 2 m; contours dashed where uncertain or inferred.
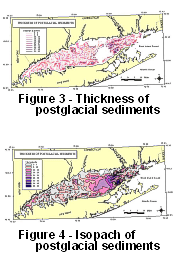
Figure 3. Map showing the thickness of postglacial sediments. Original contour interval varies; contours dashed where uncertain or inferred.
Figure 4. Isopach map showing
the thickness of postglacial sediments. Isopachs derived from TIN model;
5 m interval.