
Chapter 2
A Free-Air Gravity Anomaly Map of Long Island and
Block Island Sounds
By
Peter Dehlinger1, Lanbo
Liu2 and Ralph S. Lewis3
ABSTRACT
The late Dr. Peter Dehlinger, a Professor in the Department of Geology
and Geophysics of the University of Connecticut (Appendix
I), conducted marine gravity surveys in the Long Island and Block
Island Sounds in early 1970s. Two free-air
gravity anomaly maps: one for the Long Island Sound and the other
for the Block Island Sound have appeared only as separate figures (in a
textbook) at a very small scale. These data are valuable in many ways.
The most important role of these data is that they provide a geological
framework for further investigations of the marine environment. Based on
Dr. Dehlinger's original files and written communications, as well as updated
global gravity knowledge, a new free-air gravity anomaly map is provided
here as a single map containing both the Long Island Sound and Block Island
Sound. This paper provides documentation for this map, which was digitized
from original blue prints. The contour interval of the map is 2 mgal since
the estimated error is also at the 2-mgal level. Data reduction procedures
and accuracy are discussed. The geological implications of interesting
anomalies are also briefly discussed.
INTRODUCTION
The Long Island Sound (LIS) is an estuary located between Long Island,
in the state of New York, and the state of Connecticut. It opens to Block
Island Sound (BIS) to the east, which, in turn, opens to the Atlantic Ocean.
The two Sounds are interconnected and are underlain by continental crust.
The region has been tectonically inactive since the Triassic Basin of Connecticut's
Central Valley was formed along a zone of local weakness in the crust,
between two semi-parallel chains of older gneiss domes (Bell, 1985). In
recent years new geological and geophysical surveys have been conducted
in LIS (Poppe and Polloni, 1998). Nevertheless, no new gravity surveys
have been made since the 1975 surveys (Dehlinger, unpublished data available
at Department of Geology and Geophysics, University of Connecticut). The
gravity data are unique and can be used to complement other subsurface
investigations. The present paper is a summary of information based on
old manuscripts, correspondences among authors and reviewers, as well as
communication with professionals who had been involved in the marine gravity
survey in the Long Island and Block Island Sounds. The purpose is to disseminate
existing gravity information to a broader research community, and to facilitate
modern geological and environmental studies of the Sounds.
MARINE GRAVITY DATA ACQUISITION PROCEDURES
The University of Connecticut made marine gravity measurements in LIS and
BIS in 1975. Free-air gravity anomalies
were initially calculated relative to the 1930 International Gravity Formula
and the original Potsdam value of absolute gravity. In a later study, the
free-air anomalies were recalculated by Dr. Dehlinger relative to the 1967
International Gravity Formula (Moritz, 1968) and the revised Potsdam base
value, resulting in revised free-air anomaly maps (1:80,000 scale) for
both LIS and BIS. The resultant free-air anomaly maps were included in
his textbook 'Marine Gravity', but only on paper and at a very small scale
(Dehlinger, 1978). Although these maps were not published at a usable scale
during Dr. Dehlinger's life, it was his wish that these maps be published
to reach a broader research community.
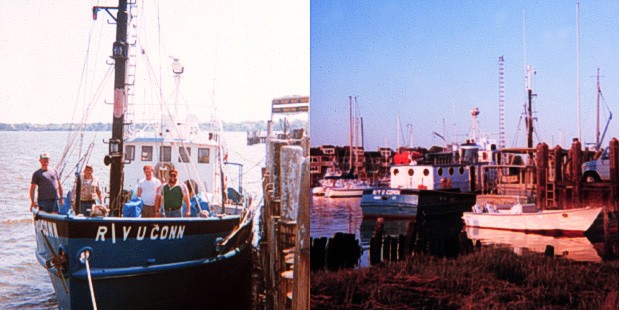
The gravity surveys were conducted aboard the University of Connecticut
65-foot T-Boat (since named R/V UCONN).
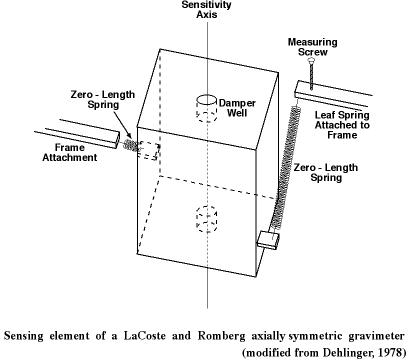
Gravity was continuously measured by a platform-mounted LaCoste
& Romberg gravimeter (No. S-71). The sensing element on this
gravimeter is dampened and constrained to the vertical direction making
it  possible
to achieve high sensitivities without concern for possible motion related
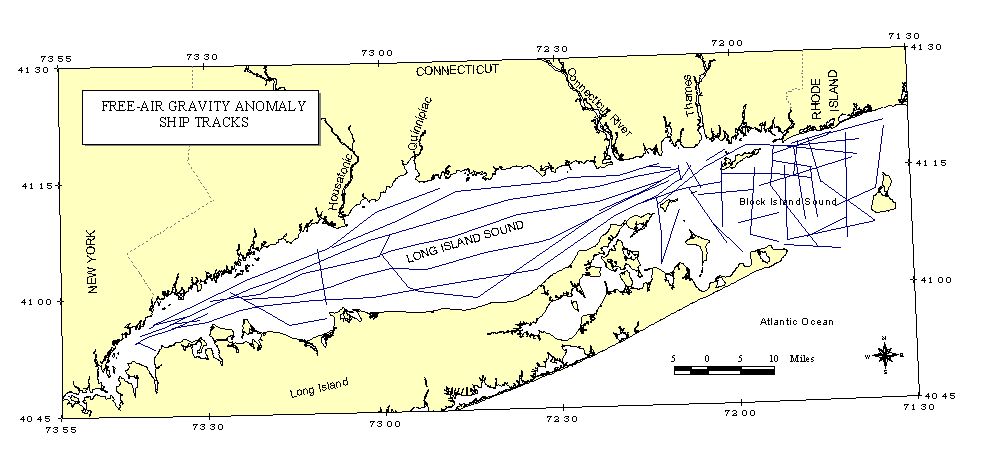
to sea state. Gravity measurements were obtained at 1.5- to 2.5-km intervals
(approximately 15-minute time intervals) along the constant-speed ship-track
lines shown in Figure 1. Measurements
were made in calm seas only, where ship accelerations did not significantly
influence attempts to measure gravity accelerations.
possible
to achieve high sensitivities without concern for possible motion related
to sea state. Gravity measurements were obtained at 1.5- to 2.5-km intervals
(approximately 15-minute time intervals) along the constant-speed ship-track
lines shown in Figure 1. Measurements
were made in calm seas only, where ship accelerations did not significantly
influence attempts to measure gravity accelerations.
Ship positions were obtained by visual sight and radar fixes to nearby
shore features that were clearly identifiable on navigation charts of the
Sounds (LORAN C had not been installed at the time of the surveys). Fixes
were obtained as frequently as they could be established, usually at distances
of l to 15 km along track lines. Final track lines shown on the map (Fig.
1) are smoothed lines through the plotted fixes, and actual ship
positions were obtained from interpolations along these lines. The resultant
ship positions and corresponding gravity measurements produced mean gravity
uncertainties of ± 2.1 mgal at track line intersections. These uncertainties
indicate a mean error in gravity measurement of ± 1.5 mgal. Nevertheless,
based on the error analysis we conducted (see Error Analysis section) the
realistic estimate of the uncertainty should be around 2 mgal.
DATA REDUCTION PROCEDURES
A gravity base station was established at the ship's homeport, the Marine
Laboratory of the University of Connecticut at Noank, Connecticut (Table
1). The value of gravity at this station is 980273.9 mgal, relative
to the revised Potsdam base value of 981260 mgal. The Noank base station
value was determined by a geodetic land gravity meter relative to known
gravity at the following four base stations in Connecticut. (1) the Hartford-Springfield
Bradley Airport Station; (2) the Tweed-New Haven Airport Station; (3) the
Yale University Station; and (4) the U. S. Submarine Base Station. Gravity
Base Stations for locations are given in Table
1.
Eotvos corrections (Dehlinger 1978, Equation 6.43) were calculated for
each gravity measurement using the formula
C = 7.5 vE cos ø (mgal)
in which vE is the easterly component of ship speed, in knots,
and ø the geographic latitude. The final adjusted track lines provided
data used to obtain ship speed and latitude.
The final contours were merged with contours of land data in Connecticut
and Rhode Island (Bothner et al, 1978; Urban et al, 1972; Hildreth, 1979),
and with anomalies on Long Island.
ERROR ANALYSIS
One major source of error in the free-air gravity anomaly contour map comes
from the positioning error of the survey vessel. The navigation is poorly
constrained (only using radar and visual fixes). During the surveys made
in LIS, usually four visual or radar sights along prominent coastal features
were obtained for one navigation fix while the ship was underway. At least
in LIS, this means the ship was near the middle of the intersecting lines
of sight. In BIS, the fixes were constrained at an even lower level compared
to that in LIS. The navigation fixes were generally within a quarter of
a mile of the adjusted positions. However, since the gravity gradients
for most of LIS are small, with a few exceptional areas, it is reasonably
easy to draw contour lines at the 2-mgal contour interval.
The original 1:80,000-scale maps depict one-mgal contour intervals in
the context of the argument that ± 1.5 mgal mean accuracy had been
achieved. After careful examination of the error propagation path, we suggest
that a level of 2-mgal accuracy might be a more realistic estimation. The
mean line-crossing error is about 2.1 mgal. Thus, using the 2-mgal interval
instead of the original 1-mgal interval is probably more appropriate. Though
the digital data are not accessible, digitizing the gravity anomaly contours
from the original 1:80,000-scale blue prints proved feasible and this process
was used to produce the map presented here.
GRAVITY ANOMALY DISCUSSIONS
 The
regional free-air gravity map of LIS and BIS is presented in Figure
2. To open a georeferenced display of this theme in ESRI's
ArcView program make sure the application is loaded on your computer.
Users should go to the lisound directory located on the top
level of this CD-ROM and double click on the lisound.apr
project file. The individual ArcView shapefiles may also be opened
directly with any Arc application (e.g. ArcInfo, ArcExplorer) and can also
be found on the data page. Further
detailed information can be found on the ArcView
Project File page.
The
regional free-air gravity map of LIS and BIS is presented in Figure
2. To open a georeferenced display of this theme in ESRI's
ArcView program make sure the application is loaded on your computer.
Users should go to the lisound directory located on the top
level of this CD-ROM and double click on the lisound.apr
project file. The individual ArcView shapefiles may also be opened
directly with any Arc application (e.g. ArcInfo, ArcExplorer) and can also
be found on the data page. Further
detailed information can be found on the ArcView
Project File page.
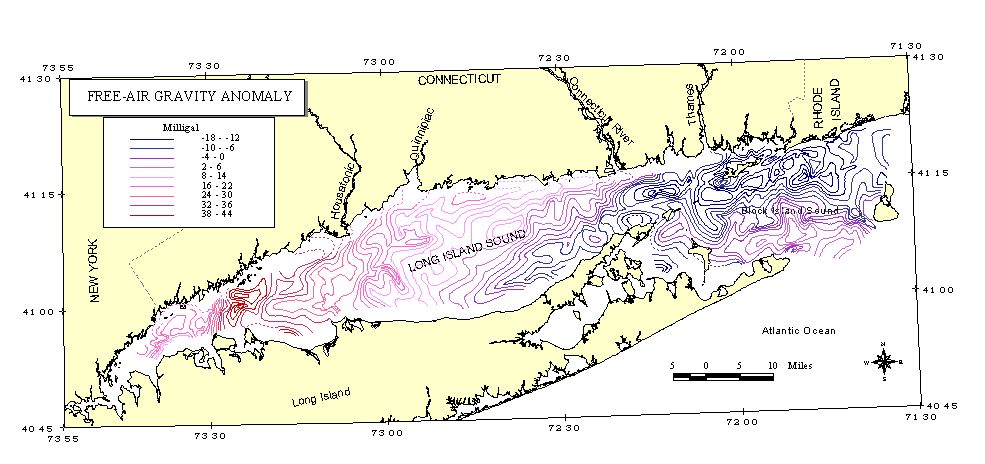
The general trend of the free-air anomaly map shows positive values
in the western end of the LIS, with a background value about +20 mgal (Fig.
2). The anomaly gradually decreases to negative values toward the
east, with a background value of -10 mgal in the BIS. This is the anomaly
variation that would be expected across a continental margin, where changes
in crustal thickness and density occur approaching the oceanic crusts (Dehlinger
and Jones, 1965). In the western part of LIS, a prominent feature on the
anomaly maps is the N-S trending gravity high extending from Greenwich,
CT to Lloyd Neck on Long Island, NY. This is the Appalachian Gravity High
that extends continuously across New Jersey, Long Island, and western Connecticut
(Woollard, 1943; Longwell, 1943). The maximum free-air value of this
high is +45 mgal in LIS (long. 73d 24' W). The gradients on each side of
the high are -2.5 mgal/km for about 10 km on the west side, and -1 mgal/km
for about 35 km on the east side. The gravity field in the eastern half
of the LIS map consists of long wavelength, low amplitude anomalies, superimposed
on a regional westerly gradient. The typical values range from about -10
mgal on the east side (longitude 72d 20' W) to about +10 mgal on the west
side (longitude 72d 55' W).
Anomalies in BIS have generally shorter wavelengths than those in eastern
LIS. In the northern half of BIS, the gravity field has values near -10
to -15 mgal; southward the gravity field increases at about 2 mgal/km,
to values of about +5 mgal in the southern part of the Sound. Several NW-SE
trending anomalies are superimposed on the regional BIS gravity field.
The anomaly maps provide a reasonable estimate of the free-air field
in the water- covered area between land-based Bouguer anomaly maps across
New England and Long Island (Bothner and others, 1978; Urban and others,
1972; Hildreth, 1979).
ACKNOWLEDGMENTS
In the data acquisition phase, Dr. E. F. Chiburis and several of the graduate
students in geophysics at the University of Connecticut assisted with the
data reduction and established the Noank gravity base station. Captain
John Blume obtained the navigation fixes aboard ship. Karen Kastening drafted
the original anomaly maps. We are in debt to Dr. Thomas Hildenbrand of
USGS for his careful reviews and constructive comments to the early drafts
of this paper. Mary DiGiacomo-Cohen digitized the map. Digital copies of
the data and maps presented here are available at University of Connecticut.
REFERENCES
Bell, M., 1985, The face of Connecticut: people, geology, and the land:
Connecticut Geological and Natural History Survey, 196 p.
Bothner, W. A., Bromery, R. W., Davis, M., and Ahmad, F., 1978, Preliminary
complete Bouguer gravity anomaly map of Connecticut: U. S. Geological Survey
Open-File Report 78-816, scale 1:250,000.
Dehlinger, P., and Jones, B. R., 1965, Free-air gravity anomaly map
of the Gulf of Mexico and its tectonic implications: Geophysics, v. 30,
no. 1, p. 102-110.
Dehlinger, P., 1978, Marine gravity: New York, Amsterdam, Elsevier,
322 p.
Dobrin, M.B., 1960, Introduction to Geophysical Prospecting: New York,
McGraw-Hill Book Company, 446 p.
Fowler, C.M.R., 1990, The Solid Earth: New York, Cambridge University
Press, 472 p.
Hildreth, C. T. (Compiler), 1979, Bouguer gravity map of northeastern
United States and southeastern Canada, offshore and onshore: New York State
Museum Map and Chart Series no. 32, scale 1:1,000,000.
Longwell, C. R., 1943, Geologic interpretation of gravity anomalies
in the southern New England-Hudson Valley region: Geological Society of
America Bulletin, v. 54, p. 555-590.
Moritz, H., 1968, The geodetic reference system 1967: Allgemeine Vermessungs
Nachrichten, v. 75, p. 2-7.
Poppe, L. J., and Polloni, C., 1998, Long Island Sound environmental
studies: US Geological Survey Open-File Report 98-502.
Press, F. and Siever, R., 1974, Earth: New York, W.H. Freeman and Company,
656 p.
Urban, T. C., Bromery, R. W., Revetta, F. A., and Diment, W. H., 1972,
Simple Bouguer gravity anomaly map of southeastern New York and contiguous
states: New York Museum and Science Service, Geological Survey Map and
Chart Series no. 17C, scale 1:250,000.
Woollard, G. P., 1943, Geologic correlation of areal gravitational and
magnetic studies of New Jersey and vicinity: Geological Society of America
Bulletin, v. 54, p. 791-818.
Woollard, G. P., and Rose, J. C., 1963, International Gravity Measurements:
Society of Exploration Geophysicists, Tulsa, Oklahoma, 518 p.
FIGURE CAPTIONS
Figure 1. The ship track lines for
gravity surveys in Long Island and Block Island Sounds. The positions were
determined by a combination of visual sight and radar fixes to nearby shore
features.
Figure 2. Small-scale map
of the free-air gravity anomalies in the Long Island and Block Island sounds.
The original maps for the Long Island Sound and the Block Island sound
were separate at the N-S edge through Groton, Connecticut.
TABLE CAPTIONS
Table 1. List of gravity base stations in located Connecticut
and used during this study. Gravity values are relative to the revised
Potsdam base value of 981260 mgal.
-
HARTFORD - WA 216 (Woollard and Rose, 1963, p. 95). Bradley International
Airport, inside terminal to left of stairs to dining room. g = 980334.8
mgal
-
NEW HAVEN - WU 8 (Woollard and Rose, 1963, p. 122). Yale University, Sloan
Physics Laboratory, westernmost of two entrances on north side, on walk
at edge of drive. g = 980302.3 mgal
-
NEW HAVEN - WA 92 (Woollard and Rose, 1963, p. 95). Tweed-New Haven Airport,
exit to field at barrier. g = 980298.5 mgal
-
GROTON - WH 13Submarine Base, Pier No. 7, north end of base of light post
on east side. g = 980282.4 mgal
-
NOANK - (Established by the University of Connecticut, 1975). Marine Laboratory
of the University of Connecticut, SE corner of concrete pier behind building,
1 m in from each side of pier. g = 980275.9 mgal
1 deceased,
Department of Geology and Geophysics,
University of Connecticut, Storrs, CT 06269
2
Department
of Geology and Geophysics,
University of Connecticut, Storrs, CT 06269
3 Geological and Natural
History Survey Connecticut Department
of Environmental Protection, Hartford, CT 06106
[an error occurred while processing this directive]
 possible
to achieve high sensitivities without concern for possible motion related
to sea state. Gravity measurements were obtained at 1.5- to 2.5-km intervals
(approximately 15-minute time intervals) along the constant-speed ship-track
lines shown in Figure 1. Measurements
were made in calm seas only, where ship accelerations did not significantly
influence attempts to measure gravity accelerations.
possible
to achieve high sensitivities without concern for possible motion related
to sea state. Gravity measurements were obtained at 1.5- to 2.5-km intervals
(approximately 15-minute time intervals) along the constant-speed ship-track
lines shown in Figure 1. Measurements
were made in calm seas only, where ship accelerations did not significantly
influence attempts to measure gravity accelerations.
 The
regional free-air gravity map of LIS and BIS is presented in Figure
2. To open a georeferenced display of this theme in ESRI's
ArcView program make sure the application is loaded on your computer.
Users should go to the lisound directory located on the top
level of this CD-ROM and double click on the lisound.apr
project file. The individual ArcView shapefiles may also be opened
directly with any Arc application (e.g. ArcInfo, ArcExplorer) and can also
be found on the data page. Further
detailed information can be found on the ArcView
Project File page.
The
regional free-air gravity map of LIS and BIS is presented in Figure
2. To open a georeferenced display of this theme in ESRI's
ArcView program make sure the application is loaded on your computer.
Users should go to the lisound directory located on the top
level of this CD-ROM and double click on the lisound.apr
project file. The individual ArcView shapefiles may also be opened
directly with any Arc application (e.g. ArcInfo, ArcExplorer) and can also
be found on the data page. Further
detailed information can be found on the ArcView
Project File page.