|
|
|
| Introduction | |
| Methods | |
| Mercury Distribution in LIS Sediments | |
| Acknowledgments | |
| References | |
| Figure Captions | |
| Table Captions | |
| Digital Data | |
| Back to Table of Contents | |
|
|
|

Chapter 7
By
Johan C. Varekamp1, Marilyn R.
Buchholtz ten Brink2, Ellen L. Mecray2,
and B. Kreulen1
|
|
|
| Introduction | |
| Methods | |
| Mercury Distribution in LIS Sediments | |
| Acknowledgments | |
| References | |
| Figure Captions | |
| Table Captions | |
| Digital Data | |
| Back to Table of Contents | |
|
|
|
 Surficial
sediments (0-2cm depth) were collected in LIS with a grab sampler which
was deployed with on-board video control. Three cruises were made in 1996
and 1997 and a total of 405 surface samples were selected for Hg analyses
(Fig. 1). Several core transects were
established in LIS and 11 cores were selected for Hg analyses (Fig.
1). Cores from coastal marshes were taken with a 10 cm diameter
metal corer and 16 cores were analyzed to a depth where background values
were obtained (Kreulen, 1999).
Surficial
sediments (0-2cm depth) were collected in LIS with a grab sampler which
was deployed with on-board video control. Three cruises were made in 1996
and 1997 and a total of 405 surface samples were selected for Hg analyses
(Fig. 1). Several core transects were
established in LIS and 11 cores were selected for Hg analyses (Fig.
1). Cores from coastal marshes were taken with a 10 cm diameter
metal corer and 16 cores were analyzed to a depth where background values
were obtained (Kreulen, 1999).
Aliquots of dried sediment samples were leached with a mixture of acids
and oxidizing substances (HNO3-H2SO4-K2S2O8-KMnO4) to extract the Hg into
solution. The resulting solution was first treated with hydroxyl-amine-hydrochloride
to reduce excess oxidants and then reduced with stannous chloride in an
extraction cell into a stream of Hg-free Nitrogen gas. The gas stream with
the extracted Hg was then carried into an Atomic Absorption Spectrometer
designed for Hg analyses. This double beam instrument (LDC Hg Monitor 3200)
has an absolute detection limit of about1 ng Hg and the signal output
was transmitted to an integrator. The instrument was calibrated with Hg
vapor injections and standards made from a HgCl2 solution. The instrument
was standardized every day and Hg concentrations in the blank and in standard
samples (NIST 2704) were monitored. Overall precision in the marsh core
samples and LIS surface sediment samples is about 12 %, whereas the LIS
core samples have a precision of about 5 %. The latter were run with a
modified gas flow path through the extraction cell of the instrument. The
analytical data presented here are not total Hg concentrations but acid-leachable
Hg. The Hg recovery from standard sample NIST 2704 with our method
was about 88 %. We use below the analytical data as well as "excess Hg
concentrations", which are the Hg concentrations minus the natural background
Hg concentration.
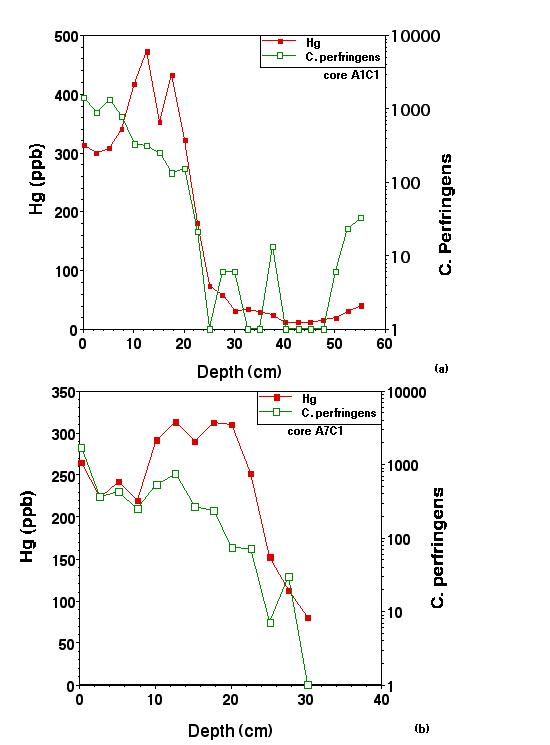
The core studies in LIS (Table 2) show in many cores a traditional contamination pattern for Hg: background values at depth of 25-50 cm of 30-80 ppb Hg, higher Hg concentrations in the core top parts, with again lower concentrations in the upper 5-10 cm (Fig. 6). Many other LIS cores show apparently homogenized Hg contamination profiles, with Hg concentrations that are consistently above the natural background but which show no trend with depth. Many of the other parameters measured on these cores (e.g., C. perfringens) also show evidence for sediment reworking.
Analytical data from the salt marsh cores (Table
3; locations in Table 4.) show
similar Hg concentrations as found in LIS, with the exception of the Housatonic
River estuary, which has much higher Hg concentrations (up to 1.5 ppm Hg).
Concentrations do not show a significant pattern from east to west, but
the total Hg burdens (total 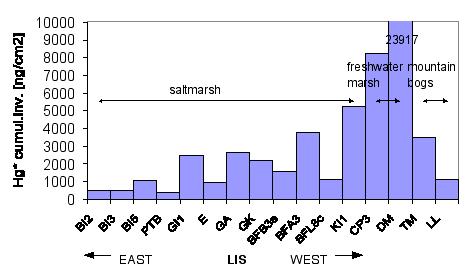 amount
of excess Hg deposited per cm2) increases from east to west (Fig.
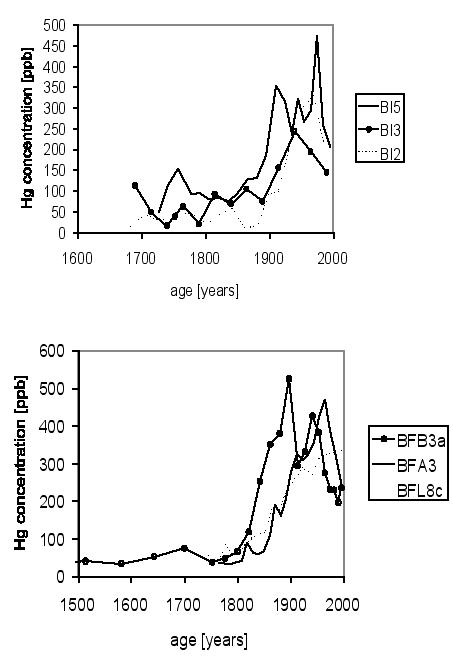
7). The age information from the marsh cores indicates that Hg
contamination started around AD 1850 + 20 in the east and possibly 20-30
years earlier in western Connecticut. The contamination peaked between
1960 and 1975 and then decreased by up to 50% over the last three decades
of the 20th century (Fig. 8), conform
findings by Engstrom and Swain (1997). Mercury data from freshwater marsh
cores taken along the Connecticut River indicate similar concentrations,
but large Hg burdens prevail in these mud-rich sediments. Marsh cores taken
on table-mountain tops where the only Hg input occurs from local atmospheric
deposition have similar Hg concentrations as the river and salt marsh core
samples.
amount
of excess Hg deposited per cm2) increases from east to west (Fig.
7). The age information from the marsh cores indicates that Hg
contamination started around AD 1850 + 20 in the east and possibly 20-30
years earlier in western Connecticut. The contamination peaked between
1960 and 1975 and then decreased by up to 50% over the last three decades
of the 20th century (Fig. 8), conform
findings by Engstrom and Swain (1997). Mercury data from freshwater marsh
cores taken along the Connecticut River indicate similar concentrations,
but large Hg burdens prevail in these mud-rich sediments. Marsh cores taken
on table-mountain tops where the only Hg input occurs from local atmospheric
deposition have similar Hg concentrations as the river and salt marsh core
samples.
The main Hg sources in Connecticut and the wider LIS region are atmospheric
deposition, effluents from waste water treatment plants (WWTP) and
local point sources such as those presumably present in the Housatonic
River area. Integration of our data with the C. perfringens counts (Buchholtz
ten Brink and others, 2000) suggests 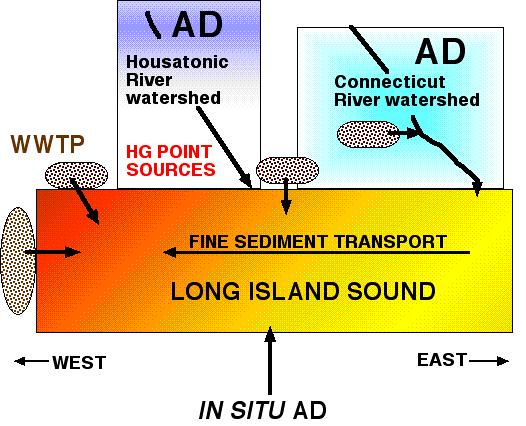 variable
WWTP contributions to the LIS Hg budget (~10-50 %), with higher values
in westernmost LIS (50-70%), and in some local spots up to 100 % WWTP contributions.
The Hg contamination in southern New England probably stems from atmospheric
Hg deposition in the watersheds (Mason and others, 1994; USEPA, 1997),
with additional contributions from local Hg sources. The enrichment of
Hg in western LIS surface sediments has ultimately three causes: 1) Transport
of Hg-contaminated fine-grained sediment to the western part of the Sound,
2) Input of Hg-rich sediment from the Housatonic River Basin, and 3) Mercury
inputs associated with WWTP effluents in western LIS. The spatial
pattern of Hg contamination in LIS and the potential Hg sources are schematically
shown in Figure 9.
variable
WWTP contributions to the LIS Hg budget (~10-50 %), with higher values
in westernmost LIS (50-70%), and in some local spots up to 100 % WWTP contributions.
The Hg contamination in southern New England probably stems from atmospheric
Hg deposition in the watersheds (Mason and others, 1994; USEPA, 1997),
with additional contributions from local Hg sources. The enrichment of
Hg in western LIS surface sediments has ultimately three causes: 1) Transport
of Hg-contaminated fine-grained sediment to the western part of the Sound,
2) Input of Hg-rich sediment from the Housatonic River Basin, and 3) Mercury
inputs associated with WWTP effluents in western LIS. The spatial
pattern of Hg contamination in LIS and the potential Hg sources are schematically
shown in Figure 9.
Buchholtz Ten Brink, M.R.; Mecray, E.L., and Galvin, E.L., 2000, Clostridium perfringens in Long Island Sound sediments: An urban sedimentary record: Thematic section, Journal of Coastal Research.
Engstrom, D.R. and Swain, E.B., 1997, Recent declines in atmospheric mercury deposition in the upper Midwest: Environmental Science and Technology, v. 31, p. 960-967.
Knebel. H.J. and Poppe, L. J.,2000, Sea-Floor environments within Long Island Sound: A regional overview: Thematic Section. Journal of Coastal Research.
Kreulen, B., 1999, Mercury Pollution in and Around Long Island Sound: M.A. Thesis, Wesleyan University, Middletown, CT, 176 p.
Mason, R.P.; Fitzgerald, W.F., and Morel, F.M., 1994, The biochemical cycling of elemental mercury: Anthropogenic influences: Geochimica Cosmochimica Acta, v. 58, p. 3191-3198.
Mecray, E.L. and Buchholtz Ten Brink, M.R., 2000, Contaminant distribution and accumulation in the surface sediments of Long Island Sound: Thematic Section, Journal of Coastal Research.
Poppe, L.J.; Knebel, H.J.; Mlodzinska, Z.J.; Hastings, M.E., and Seekins, B.A., 2000, Distribution of surficial sediment in Long Island Sound and adjacent waters: texture and total organic carbon. Thematic Section, Journal of Coastal Research.
U.S. Environmental Protection Agency (USEPA), 1997, Mercury Study: Report to Congress. EPA report # 452/R-97-0003. World Wide Web: www.epa.gov/ttnuatw1/112nmerc/mercury.html., 8 volumes.
Varekamp, J.C.; Buchholtz Ten Brink, M.R.,; Mecray, E.L, and Kreulen,
B. 2000, Mercury in Long Island Sound sediments: Thematic Section, Journal
of Coastal Research.
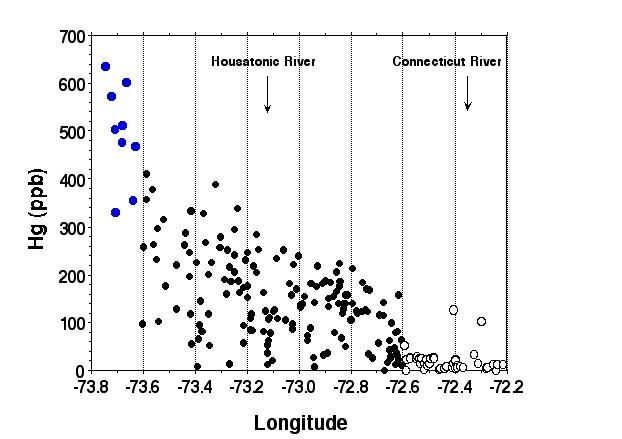
Figure 2. Analytical data for Mercury in Long Island Sound surface sediments. Note the increase in Hg concentrations from east to west.
Figure 3. Contour map of Hg concentrations in Long Island Sound.
Figure 4. East-west cross section through Long Island Sound, showing the regional trend in Hg concentration.
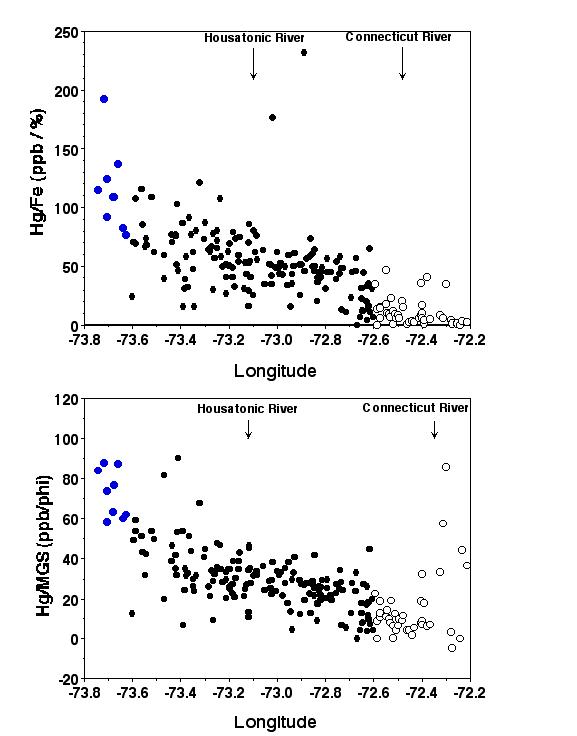
Figure 5. Grain size normalized data for the east-west profile through Long Island Sound: (a) Hg normalized on mean grain size and (b) Hg normalized on Fe concentrations. In both profiles, the scatter is reduced compared to Figure 4 and the east-west trend is less steep. The residual trend in both graphs is still strong, however, indicating Hg sources at the western side of the Sound.
Figure 6. Concentration profiles for Hg and C. perfringens in two Long Island Sound cores (cores A1C1 and A4C1).
Figure 7. Excess Hg burdens in marsh cores from coastal salt marshes along Long Island Sound, and from fresh water marshes in Connecticut. Note the general increase westward in the salt marshes, culminating in the high burden in the Housatonic River (KI). The high Hg burdens in the Connecticut River freshwater marshes CP3 and DM stems from their mud-rich character.
Figure 8. Mercury profiles from the Barn Island marshes (BI) and the Farm River (BF) marshes, both in Connecticut. Note the onset of Hg contamination between 1800 and 1850 AD and the decrease in Hg concentrations in the upper core sections.
Figure 9. Schematic view of Hg
contamination in Connecticut and Long Island Sound. Mercury deposition
in the drainage basins by direct atmospheric deposition (AD) is the main
source of Hg for the marshes and the Sound. Additional sources are local
Hg point sources, as presumably found along the Housatonic River, and waste
water treatment plant effluents.
Table 2. Analytical data for Fe and Hg and depths below the sediment/water interface in cores collected in Long Island Sound. A copy of this table (c7tab2.xls) may also be downloaded in Microsoft Excel format format.
Table 3. Analytical data for Hg, Fe, Al, Mn, Cu, Zn, and Pb in cores collected in salt marshes around Long Island Sound. A copy of this table (c7tab3.xls) may also be downloaded in Microsoft Excel format format.
Table 4. List of salt marshes sampled and the station locations for the cores collected from salt marshes around Long Island Sound. A copy of this table (c7tab4.xls) may also be downloaded in Microsoft Excel format format.