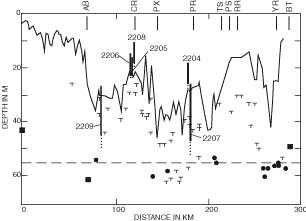
| Figure 2.2. Longitudinal profile along axis of Cape Charles paleochannel, with modern water depths over the axis shown as continuous line, adapted from Figure 3 of Colman and others (1992). 1999 Marion-Dufresne cores (vertical bars) shown projected east or west onto paleochannel axis. Dotted lower portion of vertical bars show sediment penetrated by core barrel but not recovered (assuming the recovered length corresponds to the top of penetrated section). Filled circles denote paleochannel axis depths, and "T"s show minimum depths, from seismic reflection data. Channel bottoms measured from boreholes are denoted by solid squares. Along-axis distance (x-scale) is measured from mouth of Susquehanna River along axial line of Figure 1 of Colman and others (1992). Symbols along top show approximate locations of: AB, Annapolis ("Bay") Bridge; CR, Choptank River (estuary) mouth; PX, Patuxent River (estuary) mouth; PR, Potomac River (estuary) mouth; TS, Tangier Sound; PS, Pocomoke Sound; RR, Rappahannock River (estuary) mouth; YR, York River (estuary) mouth; and BT, Chesapeake Bay Bridge-Tunnel. |
TO RETURN TO REPORT, CLOSE THIS WINDOW.
U.S. Department of Interior, U.S. Geological Survey
URL of this page: https://pubs.usgs.gov/openfile/of00-306/chapter2/fig2-2.html
Maintained by: Eastern Publications Group Web Team
Last modified: 03.28.01 (krw)