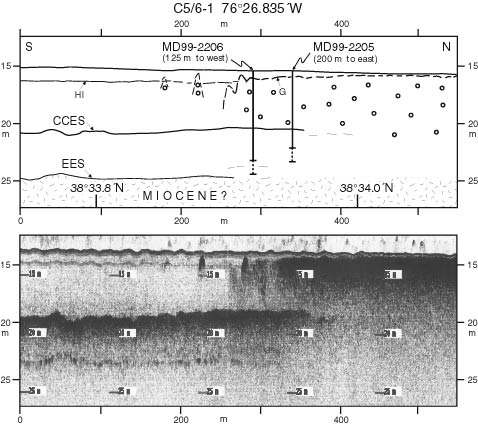
| Figure 2.5. 2-15 kHz Edgetech north-south chirp profile C5/6-1 (bottom), and geological interpretation (top), with Marion-Dufresne cores MD99-2205 and 2206 projected respectively west and east onto profile. Dotted vertical extensions of cores indicate sediment penetrated but not recovered. CCES, Cape Charles erosion surface; EES, Eastville erosion surface (Colman and Halka, 1989). HI denotes "Historical reflector." Zones of biogenic methane bubbles denoted schematically by open circles (G). Dashed lines indicate weak or intermittent reflectors. Depth scale is referred to sea surface (small numbers on chirp record are depths below towfish). Small irregularities in seafloor are artifacts of towfish heave. See Figure 2.4 for profile location. |
TO RETURN TO REPORT, CLOSE THIS WINDOW.
U.S. Department of Interior, U.S. Geological Survey
URL of this page: https://pubs.usgs.gov/openfile/of00-306/chapter2/fig2-5.html
Maintained by: Eastern Publications Group Web Team
Last modified: 03.28.01 (krw)