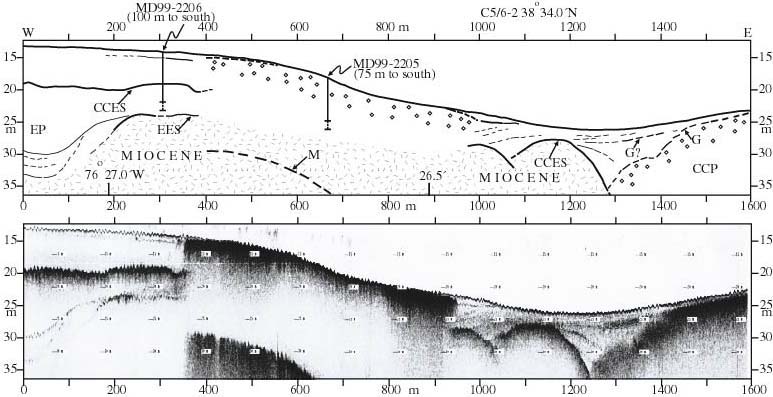
| Figure 2.6. 2-15 kHz Edgetech east-west profile C5/6-2 (bottom), and geological interpretation (top), With Marion-Dufresne cores MD99-2205 and 2206 projected north onto profile. Dotted vertical extension of cores indicates sediment penetrated but not recovered. EP, Eastville paleochannel; EES, Eastville erosion surface; CCES, Cape Charles erosion surface; CCP, Cape Charles paleochannel (Colman and Halka, 1989); M, seismic surface/bayfloor multiple; G, biogenic gas bubble zones (indicated schematically by open circles). Heavier solid lines are prominent reflectors; weaker and/or intermittent reflectors indicated by thin and/or dashed lines. Depth scale is relative to sea surface. |
TO RETURN TO REPORT, CLOSE THIS WINDOW.
U.S. Department of Interior, U.S. Geological Survey
URL of this page: https://pubs.usgs.gov/openfile/of00-306/chapter2/fig2-6.html
Maintained by: Eastern Publications Group Web Team
Last modified: 03.28.01 (krw)