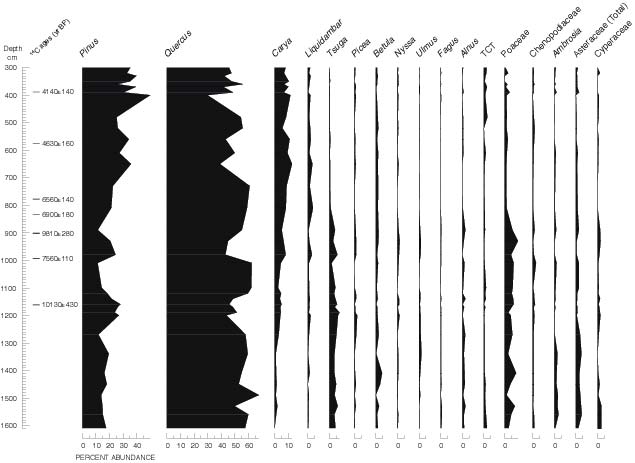
| Figure 7.2. Percent abundance of selected pollen taxa, core MD99-2207, Chesapeake Bay. The lower three radiocarbon dates are not consistent with the pollen stratigraphy as discussed in the text. |
TO RETURN TO REPORT, CLOSE THIS WINDOW.
U.S. Department of Interior, U.S. Geological Survey
URL of this page: https://pubs.usgs.gov/openfile/of00-306/chapter7/fig7-2.html
Maintained by: Eastern Publications Group Web Team
Last modified: 03.29.01 (krw)