Montana Bureau of Mines and Geology
Montana Tech of the University of Montana
Butte, MT 59701-8997
Telephone: (406) 496-2986
Fax: (406) 496-4451
e-mail: pkennelly@mtech.edu
In many cases, larger faults extend up to the ground surface. Offset along the fault can be lateral, vertical, or a combination of both. These linear offsets are often represented in topographic landforms, including fault-bounded mountain ranges and associated valleys. Linear geologic features that do not show conclusive evidence of offset or fault origin are referred to as lineaments. Analytical hillshading of Digital Elevation Models (DEMs) can accentuate traces of faults and lineaments. Visibility of faults and lineaments is a function of the three dimensional orientation of both the surface normal vector of the topographic features and the illumination vector. Traditional filtering methods used to identify linear features on remote sensing imagery can also be utilized, although the result is not as visually striking or intuitive as using analytical hillshading. The surface can also be filtered and then hillshaded to visualize lineaments. This paper presents data for two areas, the seismically active western portion of the state, and the seismically quiescent eastern portion. MBMG Special Publication 114 summarizes much of this data for western Montana (Stickney et. al., 2000). In addition to the data found in this report, this study presents planar regression analysis for hypocenter locations of the Norris earthquake swarm in western Montana and GIS visualization tools for the Brockton-Froid lineament in eastern Montana.
The only historic surface-rupturing earthquake in Montana is the 1959 Hebgen Lake earthquake, centered just west of the northwest corner of Yellowstone National Park. The magnitude 7.5 Hebgen Lake earthquake offset the Earth's surface for a distance of 20 miles (32 km) along two principal faults and produced up to 20 feet (6 m) of vertical offset. Earthquakes as large as the 1959 earthquake occur infrequently (perhaps once in a few thousand to tens of thousands of years) on specific faults in western Montana.
It is these large but infrequent earthquakes that are preserved in the geologic record and modify the landscape, creating fault scarps along which a mountain block is uplifted or a valley floor is lowered. Many other faults have ruptured during the Quaternary (the past 1.6 million years) but the age of the last rupture is not well constrained. The long elapsed time since the last major earthquake on these faults may suggest they are no longer active, but their potential to produce an earthquake cannot be completely ignored because many faults in the Intermountain West have very long recurrence times.
Small- and moderate-magnitude earthquakes (magnitudes less than 6.5) generally do not alter the Earth's surface in Montana. However, they occur more frequently than surface-rupturing earthquakes and may be powerful enough to cause damage. Thus, much of the seismic hazard facing western Montana comes from smaller but more frequent earthquakes on faults lying hidden beneath the Earth's surface as well as major but infrequent earthquakes along mapped faults.
The appearance of shaded relief topography was accomplished with the aid of ArcInfo TIN conversion routines and hill-shading techniques (Stickney et. al., 2000). The visualization of the topographic surface was created by artificially illuminating the DEM with an afternoon sun source (azimuth 315 degrees, altitude 55 degrees, and vertical exaggeration 1.5). The map was created by projecting the illuminated DEM data into a Lambert Conformal Conic Projection using the Montana State Plane Coordinate System with the following parameters: Central Meridian -109.5°, 1st standard parallel 45° north, 2nd standard parallel 49.0°, origin 44.25o and false easting 600,000 meters. Other data shown on the map, such as county boundaries, lakes, rivers, highways, and cities are derived from 1:100,000-scale U.S. Census Bureau Tiger files that also were obtained from NRIS.
Most of the faults that have produced earthquakes in recent geologic time originated many millions of years ago. These ancient faults have moved in various ways as different tectonic events shaped Montana's geologic history. The Lewis and Clark zone is an example of a fault zone formed over a billion years ago, which may still have the potential to produce damaging earthquakes. About 12 major faults make up the Lewis and Clark zone which extends from the Helena region west-northwestward through Missoula to the Montana-Idaho state line near Lookout Pass, and beyond to the vicinity of Coeur d'Alene, Idaho. The Lewis and Clark zone is a general name describing this group of faults with horizontal offsets measured in kilometers to tens of kilometers as well as strongly deformed rock strata (Wallace and others, 1990). These faults accommodated slip during the formation of the overthrust belt in the mountainous western one-third of Montana some 50 to 80 million years ago. Younger slip of a different direction along several faults in the Lewis and Clark zone has helped to shape the modern landscape through formation of valleys. However, most Lewis and Clark zone faults do not have documented Quaternary movement.
The quality of seismic monitoring in northwest Montana improved dramatically in 1995 when the MBMG entered into a cooperative agreement with the Confederated Kootenai and Salish Tribes (CSKT) in order to establish six seismographs on the Flathead Reservation, north of Missoula. Also in 1995, the MBMG received funding through a National Earthquake Hazards Reduction Program grant to install nine stations in west-central Montana between Helena and St. Regis. By 1998, the Montana seismograph network consisted of 31 seismographs distributed between Flathead Lake in northwest Montana and the north and west borders of Yellowstone National Park. Seismic data are recorded in Butte at the MBMG's Earthquake Studies Office (ESO), in Ronan at the CSKT Safety of Dams Office, and in Missoula at The University of Montana Geology Department. All seismic data are analyzed and archived in Butte. Additional data from seismographs operated by other agencies in surrounding states and Canada are routinely incorporated into Montana earthquake locations. Stickney (1995) described seismic instrumentation and data-analysis procedures employed in preparation of the Montana earthquake catalog.
A subset of 5,148 earthquake epicenters from western Montana was selected from the MBMG earthquake catalog and shown on this map. These selected earthquakes include all earthquakes with Richter magnitudes over 2.5 and those earthquakes of magnitude 1.5 or larger with better quality epicentral locations. Earthquake epicenters that lie more than 6 miles (10 km) outside the Montana border are not shown. The distribution of earthquake epicenters generally reflects the northern Intermountain Seismic Belt and eastern Centennial Tectonic Belt (Stickney and Bartholomew, 1987).
Star symbols show earthquakes of magnitude 5.5 or greater since 1900. The epicenter locations for historic Montana earthquakes are not as accurately determined as those after 1965 because prior to1965, few if any seismograph stations operated in Montana. Pre-1982 epicenters were taken from the National Oceanic and Atmospheric Administration hypocenter files, or later studies of these earthquakes if available.
Hypocenter locations in three dimensions allow visualization of seismic events. The Norris earthquake swarm of 1987 offered an opportunity for MBMG to deploy field seismographs in the epicentral area to accurately measure aftershocks. Hypocenters were determined for nearly 600 events ranging from Richter magnitude -2.1 to 3.3. ArcView's 3D Analyst extension was used to visualize these well-constrained hypocenters. Initial observations indicate that the aftershocks originated in a complex fault zone. The "cloud" of hypocenters could be interpreted as deep movement on the Bradley Creek fault, which has a scarp in this area, as well as other antithetic or synthetic faults at depth. As a first estimate, a planar regression was performed on all hypocenter locations. The resulting plane is a poor fit, with a Root Mean Squared (RMS) error of 618. The resulting plane, however, has a strike of N17W, a dip of 42° E, and would create a surficial trace on the DEM very close to the Bradley Creek fault scarp.
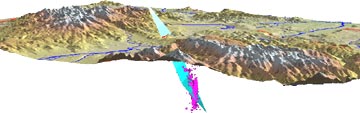
Figure 1. Norris earthquake best fit plane from regression analysis for nearly 600 hypocenter locations and 283 points located on the fault scarp. |
Identifying fault scarps in the less seismically active eastern half of Montana is challenging. One fault candidate is the Brockton-Froid lineament in northeastern Montana. The lineament has been interpreted by field mapping efforts of Colton (1963a) of the U.S. Geological Survey as a northeast-southwest (N55E) trending fault zone more than 50 km (30 mi) in length. The entire zone is straight, with the northeastern-most portion consisting of a single lineament. In the central portion, the zone consists of two parallel traces defining a small graben-like structure. At the southwestern end, the zone splays into several less well defined lineaments.
Vertical relief along the trend is evident in the Quaternary glacial till covering the area, implying relatively recent movement. Surficial deposits also vary across the inferred graben, changing from Quaternary alluvium outside the zone to Quaternary gravel within the inferred graben. Two traverses done with auger holes show thicker Quaternary sequences in the central graben as compared to outside of this structure (Colton, 1963b). No trenching has yet been done across the lineament.
The Brockton-Froid lineament is clearly identified from 30 m. Digital Elevation Models (DEMs) using analytical hillshading and remote sensing filtering techniques. Analytical hillshading applies a gray color to each pixel in the DEM based on the angle between the selected illumination vector and the surface normal vector. The illumination vector is defined by two angles, an attitude (compass direction between 0° and 360°) and an altitude (horizontal angle between 0° and 90°). The surface normal is a vector normal to a surface defined by a grid cell and its closest 8 neighboring grid cells. The grayness of grid cells will vary as a function of the cosine of the angle made in three dimensions between the surface normal and the illumination vector.
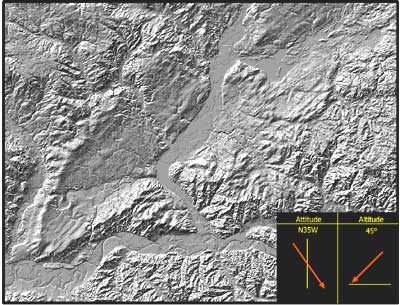
Figure 2. The Brockton-Froid lineament using analytical hillshading for visualization. The lineament is illuminated by a light source located at an azimuth of N35W and an angle from horizontal of 45°. |
Filters are often used with remote sensing data to help define linear features present in imagery. Filters apply a small grid called a convolution kernel to each grid cell and neighboring grid cells. The values are then summed and divided by the number of grid cells in the kernel. The same techniques can be applied to gridded DEM data. Two filters were effective on this data, a filter to detect NE-SW oriented edges, and a filter to detect compass gradients. The best filter for detecting the Brockton-Froid lineament was the NW-oriented compass gradient filter. The kernel for this filter is designed to sum to zero in flat areas, sum to a positive number for NE-SW linear features increasing to the NW, and sum to a negative number for NE-SW linear features decreasing to the NW. This technique, however, produces a less visually continuous lineation than the analytical hillshading. The edge detection filter is not designed to sum to zero for flat areas; edges enhanced are overprinted on the topographic model. If, however, analytical hillshading is applied to the DEM after it undergoes NE-SW trending edge detection filtering, the result clearly shows the lineament. Although the lineament itself is no sharper than in traditional analytical hillshading, the filtering process eliminates other linear features not oriented NE-SW, allowing the lineament to stand out more clearly.
Haller, K.M., Dart, R.L., Machette, M.N., Stickney, M.C., 2000, Data for Quaternary faults in western Montana: Montana Bureau of Mines and Geology Open-file Report 411, 241 p., 1 compact disk. Stickney, M.C., 1995, Montana seismicity report for 1990: Montana Bureau of Mines and Geology Miscellaneous Contribution 16, 44 p.
Stickney, M.C., Haller, K.M., and Machette, M.N., 2000, Quaternary faults and seismicity in western Montana: Montana Bureau of Mines and Geology Special Publication 114, Scale 1:750,000, 1 sheet.
Stickney, M.C. and Bartholomew, M.J., 1987, Seismicity and late Quaternary faulting of the northern Basin and Range Province, Montana and Idaho: Bulletin of the Seismological Society of America, v. 77, p. 1602-1625.
Wallace, C.A., Lidke, D.J., and Schmidt, R.G., 1990, Faults of the central part of the Lewis and Clark line and fragmentation of the Late Cretaceous foreland basin in west-central Montana: Geological Society of America Bulletin, v. 102, p. 1021-1037.