
U.S. Geological Survey Open-File Report 00-360
Online Version 1.0
By Jeff Wynn, U.S. Geological Survey, Reston, VA 20192
Disclaimer: Use of specific manufacturers or equipment in this report is for information purposes only and does not imply endorsement by the US Geological Survey or the Department of Interior.
Prince William Forest Park is situated at the northeastern end of the Virginia Gold-Pyrite belt northwest of the town of Dumfries, VA. The U. S. Marine Corps Reservation at Quantico borders the park on the west and south, and occupies part of the same watershed. Two abandoned mines are found within the park: the Cabin Branch pyrite mine, a historic source of acid mine drainage, and the Greenwood gold mine, a source of mercury contamination. Both are within the watershed of Quantico Creek (Fig.1). The Cabin Branch mine (also known as the Dumfries mine) lies about 2.4 km northwest of the town of Dumfries. It exploited a 300 meter-long, lens-shaped body of massive sulfide ore hosted by metamorphosed volcanic rocks; during its history over 200,000 tons of ore were extracted and processed locally. The site became part of the National Capitol Region of the National Park Service in 1940 and is currently managed by the National Park Service. In 1995 the National Park Service, in cooperation with the Virginia Department of Mines, Minerals, and Energy reclaimed the Cabin Branch site.
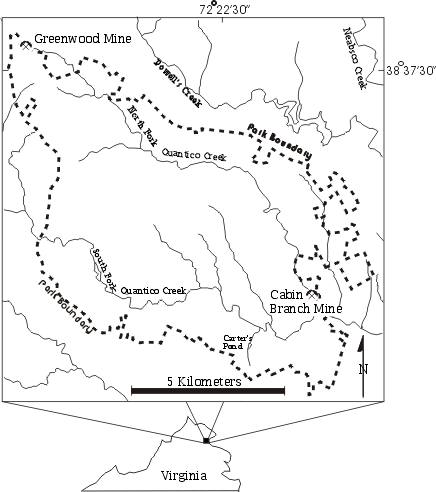
Figure 1. Location of the field-site, Prince William Forest.
The Virginia Gold-Pyrite belt, also known as the central Virginia volcanic-plutonic belt, is host to numerous abandoned metal mines (Pavlides and others, 1982), including the Cabin Branch deposit. The belt itself extends from its northern terminus near Cabin Branch, about 50 km south of Washington, D.C., approximately 175 km to the southwest into central Virginia. It is underlain by metamorphosed volcanic and clastic (non-carbonate) sedimentary rocks, originally deposited approximately 460 million years ago during the Ordovician Period (Horton and others, 1998).
Three kinds of deposits are found in the belt: volcanic-associated massive sulfide deposits, low-sulfide quartz-gold vein deposits, and gold placer deposits. The massive sulfide deposits such as Cabin Branch were historically mined for their sulfur, copper, zinc, and lead contents, but also yielded byproduct gold and silver. The environmental impact of massive sulfide deposits can be substantial. These deposits are characterized by high concentrations of heavy-metal sulfide minerals, hosted by silicate rocks. Thus, weathering of these deposits and their mine wastes has the potential to generate heavy-metal laden sulfuric acid that can have negative impacts on aquatic ecosystems. In addition, lead associated with solid mine wastes has the potential for human health impacts through ingestion. The heavy metals that are encountered in these deposits and are most likely to cause environmental impacts include copper, zinc, lead, cadmium, and arsenic. In addition, the weathering of pyrite releases large amounts of iron, and the acid generated attacks the country rocks and causes the release of large amounts of aluminum, which also can severely impact aquatic ecosystems.
A reclamation attempt was made at the site in 1995, including construction of storm-water diversion trenches around the abandoned mine area, grading tailings away from the stream bank, addition of pulverized limestone and topsoil, and revegetation. The post-reclamation chemistry of shallow groundwaters (<3 meters deep) shows a neutral pH on the southwestern bank of the stream but pH of 4.1 to 4.5 on the northeastern bank. The dominant ions are Fe2+ and SO42- (Seal, Haffner, Meier, and Pollio, 1999)
A ground electromagnetic survey was conducted over the site in 1999 as part of a wider study ( Seal, Haffner, and Meier, 1998a,b, 1999). It was hoped that a 3-D map of the soil conductivity derived from the survey could provide insight into the distribution of the mobilized sulfides present under the ground. This study was conducted in cooperation with the National Park Service
Sulfide bodies are known to be electrically conductive objects, and crushed and shattered ore without barriers in place will normally flood the local groundwater with ions derived from the sulfides. These will generally lower the pH, and will also increase the total dissolved solids of pore fluids, often dramatically, giving rise to an increased apparent conductivity. Both the sulfide body and the altered pore fluid are thus excellent targets for a conductivity-measuring electromagnetic (EM) system. The Geophysical Survey Systems, Inc. GEM-300 electromagnetic system is an active EM induction sensor ñ it both transmits and receives electromagnetic signals at up to six different programmable frequencies simultaneously. The unit includes a "bucking" coil incorporated to counteract the primary signal; in free space no primary or quadrature fields should thus be detected at the receiver coil if the system is calibrated correctly. The practical effect of this design is that any primary or quadrature signal detected will be contributed by anomalous zones in the subsurface. According to Maxwell's Laws, lower frequency signals penetrate deeper, higher frequency signals penetrate less deeply, and penetration of EM signals in general is limited by conductivity (the more conductive the subsurface, the shallower the effective penetration). Thus, a six-frequency survey spread can be expected to effectively sample six different depths below the receiver, with certain provisos (see below).
The GEM-300 system measures both the primary field and the quadrature field for each frequency. The quadrature is the EM field-strength measured 90° out of phase from the oscillating primary signal; any conductor in the Earth will have eddy currents induced in it by the primary signal. These eddy currents when detected by the receiver coil will be delayed or phase-lagged with respect to the primary signal. Because the phase-lag measured by the quadrature signal is affected by the underlying conductivity, it follows that it can be used to calculate an effective conductivity. In this way we can get six layers of apparent soil conductivity, though the "layers" are really local averages whose peak contribution comes from one particular depth. This effective "maximum contribution" depth also changes as the overlying conductivity changes, so the contour maps shown in this report are only a rough approximation, a qualitative image only, of the underlying 3-D conductivity. Despite these provisos, the six conductivity maps that follow in this report are felt to be semi-quantitative representations of the iron and sulfate content in the pore fluids, and possibly also the sulfide ion content in the rock, to depths ranging up to 10 meters for the lowest (330 Hz) frequency.
It was discovered after delivery that the GEM-300 unit could not be calibrated as delivered (and remained that way for two years despite sending it back to the manufacturer twice). Therefore, the conductivities given here are approximate only. They are consistent within a given frequency, but direct comparison of values (actual numbers) between frequencies cannot be exact. To compensate for this imprecision, each conductivity map is color-scaled over the same spectrum to be more readily comparable, frequency-by-frequency. The frequencies used in the Cabin Branch survey ranged from 330 Hz to 19,950 Hz. These can be expected to provide an effective maximum depth of penetration of roughly 6 to 10 meters for the lowest frequency (330 Hz) and probably as deep as one meter for the highest frequency (19,950 Hz) - as long as the conditions conform to a low induction number. The induction number is defined as the inter-coil spacing divided by the skin-depth. Because the inter-coil separation was 1.67 meters, and the skin-depth for the lowest frequency in the Cabin Branch area is about 10 meters, this condition was met for the Cabin Branch survey (GSSI Operations manual, 1998; also see Won and others, 1996).
Figure 2 shows the local topography, wells, seeps, and waste-piles (see Seal, Haffner, and Meier, 1998a,b, 1999). The red rectangle on it shows the location of Figure 3, the 200-meter-by-150-meter geophysical grid referenced to wells on the site, to the Cabin Branch stream itself, and to other physical features observed at the field site during the geophysical survey. Note that these maps (figures 2 and 3) do not exactly overlap.
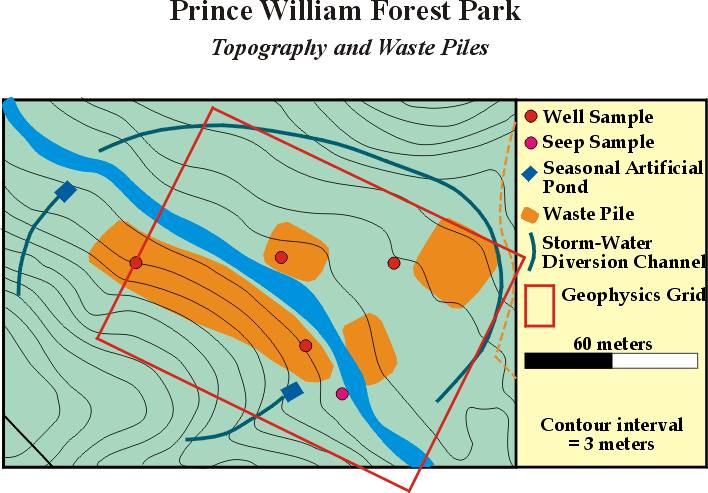
Figure 2. Geology and topography, Prince William Forest site.
The geophysical survey was conducted along northwest-southeast profiles designed to cover the target area as completely as possible and to minimize the effects of topography on the survey procedures. A 10-meter-square grid-spacing was used, so a total of 315 stations were acquired. The GEM-300 unit was programmed to sample the widest possible six-frequency range; this included 330 Hz, 690 Hz, 3810 Hz, 8730 Hz, and 19950 Hz. It is clear from the data that conductivity changed substantially over this frequency range, with more conductive materials at depth than at the surface. This makes a skin-depth number largely meaningless; nevertheless, it is estimated that maximum depth of penetration of the GEM-300 induction system, especially in the northwestern part of the grid, is approximately 10 meters for the 330 Hz signal.
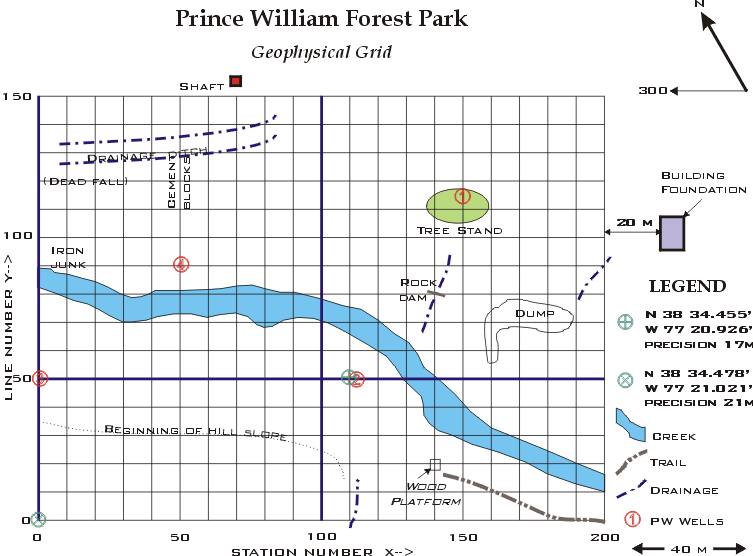
Figure 3. Geophysical survey grid, Prince William Forest site. Compare with subsequent figures.
Figures 4 to 6 are three of the six conductivity maps, for frequencies 19950 Hz, 3810 Hz, and 330 Hz, chosen from the geophysical survey figures at the Cabin Branch site that included the full range of 19950 Hz, 8730 Hz, 3810 Hz, 1650 Hz, 690 Hz, and 330 Hz. Three of the intermediate images are not shown here in order to conserve band-width, but are available in the original (paper version) of the U.S. Geological Survey Open-File Report 00-360. A synoptic examination of the figures shows several things immediately. In figure 4, the shallowest conductivity map (19,950 Hz) correlates quite closely with surface features in figure 3: the drainage ditch in the northwest corner and Quantico Creek are both low-conductivity zones, whereas the wells and metallic junk are all conductors (the wells have metal casings). In the case of the drainage ditch (built to divert water around the sulfide mine; see north corner of figure 3) and Quantico Creek, the low conductivity indicates that there is very low ionic content in either place. Any mine tailings in Quantico Creek have probably been dispersed downstream long ago.
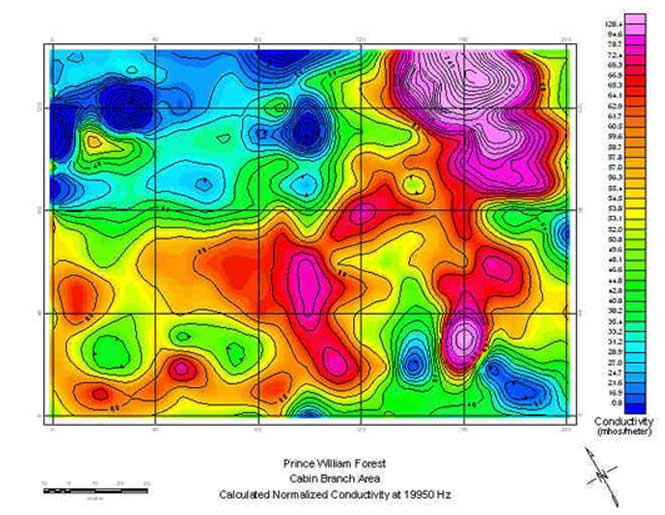
Figure 4. Conductivity map for 19,950 Hz (near-surface).
There is a notable exception to this "fresh-water-gives-rise-to-low-conductivity" rule: a conductor at X = 160 (the horizontal axis) and Y = 30 (the vertical axis in the figure) is located right in the stream. A highly-conductive zone here correlates with an iron seep observed on the bottom of the stream. The rest of the conductive (red) zones in the shallowest (19950 Hz) map, correlate closely with the areas on Figure 2 labeled as waste piles. These conductors presumably are caused by high sulfate and iron-content in the soil. The two strongest conductors in the shallow map are located at X = 160, Y = 30 and at X = 150-180, Y=120-150.
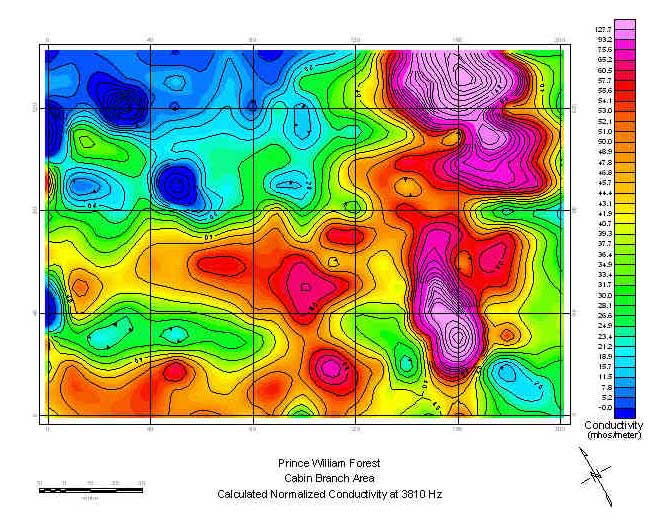
Figure 5. Conductivity map for 3,810 Hz (intermediate depth).
As one progresses to deeper and deeper depths through the figures down to 9 (330 Hz), the strong, coherent conductors at the surface begin to break up. The casing conductors still remain visible, but even the iron seep conductor is starting to go away (the "seep conductor" here appears to bottom out at probably less than 5 meters depth). In part this fragmentation may be due to lower signal-to-noise ratios at deeper depths. However, the fragmentation most likely has an androgenic origin: most of the crushed sulfide ore is at the surface. A strong conductor at depth (northwest corner of figure 6; not visible at the surface in figure 4) has appeared at X = 10-30 and Y = 110-120. The presence of a mine shaft at X = 70 and Y = 160 would suggest that perhaps original sulfide ore (or mine-related metallic junk) are buried here. With this and one other notable exception (X = 160 and Y = 130), most of the conductive materials that seem to be interconnected at the surface (as if the ions of the waste piles were blending with time) do not extend to or interconnect significantly at depth.
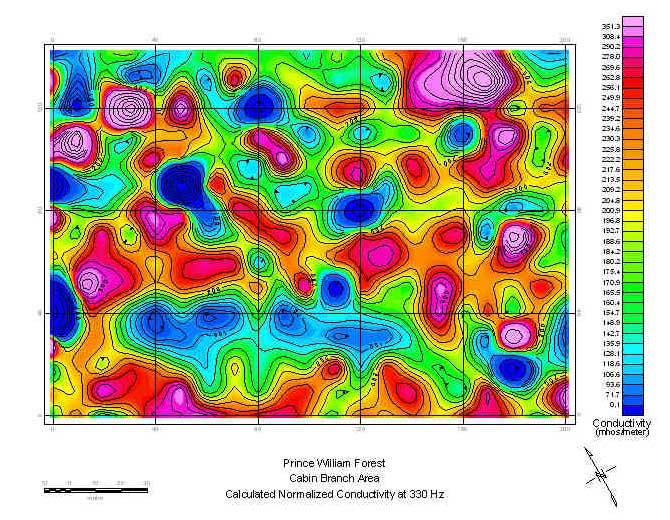
Figure 6. Conductivity map for 330 Hz (deepest depth).
In conclusion, most of the conductors appear to correlate with surface waste piles. Fresh water appears to remove ions and thereby leaves low-conductivity (blue) zones. Two significant, deep conductors remaining at the lowest frequencies are probable sulfide bodies at X = 10-30 and Y = 110-120 in the northwestern quadrant, and at X = 150-170 and Y = 130-140 in the northeastern corner of the survey area. It is possible, however, that the latter is just a very thick waste pile and that the former is buried metallic mine junk.
GSSI, 1998, Operations manual for the GEM-300 multifrequency electromagnetic profiler: Geophysical Survey Systems,
Inc., North Salem, NH, p. 60.
Horton, J.W., Jr., Aleinikoff, J.N., Drake, A.A., Jr., and Fanning, C.M., 1998, Significance of Middle to Late
Ordovician volcanic-arc rocks in the central Appalachian Piedmont, Maryland and Virginia: Geological Society of
America Abstracts with Programs, v. 30, p. A125.
Pavlides, L., Gair, J.E., and Cranford, S.L., 1982, Central Virginia volcanic-plutonic belt as host for massive
sulfide deposits: Econ. Geol., v. 77, p. 233-272.
Seal, R.R., II, Haffner, D.P., and Meier, A.L., 1998a,
Environmental characteristics of the abandoned Greenwood mine area,
Prince William Forest Park, Virginia: Implications for mercury
geochemistry: U.S. Geological Survey Open-file Report 98-326, 19 p.
Seal, R.R., II, Haffner, D.P., and Meier, A.L., 1998b,
Geochemical data including mercury speciation for surface waters at
the abandoned Greenwood mine area, Prince William Forest Park,
Virginia: U.S. Geological Survey Open-file Report 98-756, 14 p.
Seal, R.R., II, Haffner, D.P., and Meier, A.L., 1999,
Methylmercury in surface waters around an abandoned gold prospect in
the Virginia gold-pyrite belt, northern Virginia [abs.]: Geological
Society of America, Abstracts with Programs (SE), v. 31.
Seal, R.R., II, Haffner, D.P., Meier, A.L., and Pollio, C.A., 1999, Ground- and surface-water geochemical insights
into the behavior of limestone amendment at the reclaimed Cabin Branch pyrite mine, Prince William Forest Park,
Virginia: Geol. Soc. Amer. Abstracts with Programs, v. 31, p. A333.
Won, I.J., Keiswetter, D.A., Fields, G.R.A,. and Sutton, L.C., 1996, GEM-2 - a new multi-frequency electromagnetic
sensor: Jour. Environ. & Eng. Geophys. 1, p. 129-137.
![]()
This report is available from:
USGS Information Services, Box 25286,
Federal Center, Denver, CO 80225
telephone: 303-202-4210; e-mail: infoservices@usgs.gov
U.S. Department of the Interior, U.S. Geological Survey
This page is URL https://pubs.usgs.gov/openfile/of00-360/
Contact Jeff Wynn
Last modified 3 July 2001 (jmw)