U. S. Department of the Interior
U. S. Geological Survey
|
U. S. Department of the Interior |
Preliminary Method for Anticipating the
Occurrence of Precipitation-Induced Landslides
in Seattle, Washington
by
Alan F. Chleborad
Open-File Report 00-469
2000
This report is preliminary and has not been reviewed for conformity with U.S. Geological Survey standards. Any use of trade, product or firm names is for descriptive purposes only and does not imply endorsement by the U.S. Government.
by Alan F. Chleborad
Geologic Hazards
Analysis of precipitation data associated with historical landslide events in Seattle has resulted in the identification of precipitation thresholds for the initiation of landslides. Also, an air-temperature index for multiple landslide events is identified, and in conjunction with the precipitation thresholds, is used to develop a method for anticipating the occurrence of landslides during the December-March wet season.
The precipitation thresholds are based on 3-day cumulative precipitation that occurred immediately prior to landslide events and antecedent 15-day precipitation that occurred prior to the 3-day amounts. The data indicate that 15-day cumulative precipitation influences the amount of subsequent 3-day precipitation required to initiate landslides.
Results of the analysis also indicate that air-temperature data can be used to help identify times when conditions are conducive for the initiation of landslides. It is shown that a high percentage of precipitation-related landslides occurred on days when the daily maximum air temperature was between 46° and 56° F (9° and 13° C) and that nearly all of the slides occurred on days when the daily maximum air temperature was above 43° F (6° C).
In the Seattle area, precipitation in the form of rain or rain and snow is a major cause of landslides. Analysis of a database of over 1300 historic landslides (Laprade and others, 2000), dating from 1897 to 1998, has shown that landslide occurrence is closely related to the precipitation regime. In that study, it was found that approximately 86% of the landslides occurred during the four month winter wet season (December-March) with the month of January accounting for the highest percentage (45%). Characterization of precipitation and critical storm conditions that produce landslides is needed to help mitigate the landslide hazard in Seattle. The term "landslide" as used in this report includes any of several types of slope failure including earth or debris flows, slumps, slides, and soil or rock falls (after Cruden and Varnes, 1996).
In a study of the relation between precipitation and landslide occurrence in Seattle, Tubbs, (1975, unpub. thesis) concluded that the temporal distribution of landsliding in Seattle is primarily a function of short-term precipitation. No obvious relationship was found between cumulative precipitation and the amount of short-term precipitation necessary to produce widespread landsliding. In the same study, Tubbs developed an "index of temporal landslide hazard" for estimating the daily landslide hazard associated with 1 to 5-day precipitation totals.
A 1997 study conducted in western Washington by the U.S. Army Corps of Engineers (USACE) identifies a 3-day rainfall event (near 3.81 inches cumulative with an 8-yr. return interval) as a landslide initiating threshold. The threshold is based on data associated with 7 widespread, historic landslide events that impacted parts of western Washington including the Seattle area.
Results of previous studies in landslide-prone areas of California indicate that rainfall intensity and duration and antecedent seasonal precipitation are important factors that influence the initiation of debris flows (Campbell, 1975; Wieczorek and Sarmiento, 1983; Cannon and Ellen, 1985, and Wieczorek, 1987). In contrast, in a recent study of rainfall and debris-flow occurrence in an area of the Italian Alps by Deganutti and others (2000), it was concluded that antecedent precipitation was not useful for discriminating between storms that triggered debris flows and those that did not.
The association between landslide occurrence and warming trends has been documented by many observers in past years (e.g., Voight, 1978; and Wieczorek and others, 1989). In a study conducted in 1996, an air temperature threshold for the onset of landslide activity was identified for certain mountainous areas of the Western U.S. (Chleborad, 1997). A strong correlation between air temperature and landslide occurrence was also noted for landslides that occurred in parts of Western Washington during the winter storm period of December 26, 1996 to January 4, 1997 (USACE, 1997). In all of those cases, snowmelt was a major factor in the development or triggering of the landslides.
In this study, historical precipitation and air-temperature data are used to characterize climatic conditions associated with landslides in Seattle. The analysis has resulted in the identification of approximate lower-bound precipitation thresholds for the initiation of landslides. Also, an air-temperature index for multiple landslide events is identified, and in conjunction with the precipitation thresholds, is used to develop a method for anticipating the occurrence of landslides during the December-March wet season.
Data Sources
Specific information on location and date and time of landslide occurrence was obtained in a search of city of Seattle landslide files, geotechnical reports, U.S. Geological Survey (USGS) landslide project files, personal field notes, and newspaper reports. The database of over 1300 historic landslides developed for the city of Seattle (Laprade and others, 2000) was used as a guide for obtaining information from the city landslide files. The search yielded information on location and time of occurrence for 187 landslides that occurred during the period 1897 to 1997 (unpub. data, A.F. Chleborad and S. Steffens Hawley, 2000). The city landslide files and articles from Seattle newspapers were the major sources of information. Documentation on landslide occurrence in the city files include court documents, geotechnical reports, internal memoranda, photos, cost estimates, mitigation reports, maps, and written communications between claimants (or their representatives) and city officials. Copies of documentation and reports used as sources of information for this study are on file in the offices of the USGS, Denver, Colorado.
Hourly rainfall data recorded at seventeen City of Seattle rain-gauge sites during the period 1983-1997 was obtained for the study. In addition, a compilation was made of daily climatic data, including daily precipitation, daily temperature extremes, snowfall (converted to water equivalent), and snow-on-ground measurements recorded at twelve National Weather Service (NWS) stations in the Seattle area during the period 1933 to 1997. Figure 1 shows the approximate locations of city rain-gauge sites and NWS stations used as data sources.
Data Limitations
The quality and completeness of available information on historic landslides is variable. In this study, original source documents and reports were carefully examined in an effort to obtain the most accurate data on landslide timing and locations. Landslide locations and times of occurrence are specified in the selected source materials. However, much of the data did not originate from scientific studies specifically designed to obtain such data.
Ideally, measurements of precipitation are made with recording devices located at the landslide sites. Because such measurements are rare or do not exist, data from City of Seattle rain gauge and NWS stations located closest to the respective landslide locations were used for the analysis. In nearly all cases, the selected stations are located within a few miles of the respective landslides, and thus it is assumed that the data are sufficiently representative of conditions at the landslide location.
.
Figure 1.
The database of landslides compiled for this report comprises reports of landslides that damaged or destroyed property, blocked transportation routes, disrupted utility lines or threatened the lives and safety of Seattle residents. Because the degree of reporting by the public is variable, it is likely that many historic landslides in Seattle were not reported. In addition, documentation specifying the exact date of occurrence was not found for many reported landslides. Consequently, they are not included in this study.
Despite these limitations, the landslide data compiled for this report are considered useful and sufficient for the purpose of the study.
Many historic landslides in Seattle are associated with storm events that produced large amounts of precipitation. However, isolated slope failures sometimes occur during periods with little or no precipitation and are attributed to such things as leakage from broken water or sewer lines, improper drainage, or excavation. To examine the relation between antecedent precipitation and the initiation of landslides I have selected a level of landslide occurrence of three or more landslides in a 3-day (72-hr) period. I have assumed that at that level of activity, precipitation has played a major role in the development or triggering of the landslides.
As previously stated, a database of 187 Seattle landslides, with known locations and times of occurrence, was compiled for the study. Inspection of the database revealed that 91 of the 187 slides could be shown to be part of landslide events with at least three slides in a 72-hr interval (Table 1 in appendix). The landslides in Table 1 represent nine winter storms that occurred between 1933 and 1997. The storms of December 26, 1996 - January 4, 1997, December 10-30, 1933, January 17-18, 1986, and March 17-19, 1997 are notable for the large number of landslides they produced (Laprade and others, 2000).
Studies conducted in other areas suggest that the significant period of antecedent precipitation for landslide initiation may vary from days to months depending on local site conditions (e.g. Wieczorek, 1987; and Crozier, 1986). For this preliminary study, 3-day triggering precipitation and prior 15-day cumulative precipitation were selected to characterize conditions that initiate landslides (Table 2 in appendix). Three-day precipitation preceding landslide occurrence was selected because previous studies indicate that many landslides are triggered by high-intensity storm intervals of 72 hours or less (e.g., Wieczorek, 1987, Cannon and Ellen, 1986, USACE, 1997). The 15-day interval of cumulative precipitation preceding the 3-day was selected after preliminary scatter plots of 5- to 30-day intervals revealed that the 15-day plot yielded a relatively well defined lower-bound threshold for the initiation of the landslides.
For cases in which hourly rainfall data were available, snowfall and subsequent snowmelt were not significant factors, and the date and the time of day were known, exact or nearly exact 3-day and 15-day precipitation amounts could be calculated (e.g., landslide no. 45 in Tables 1 and 2). In cases where hourly data were not available and daily (24-hr) precipitation data were used or the date of landslide occurrence was specified but the time of day was not, it was possible to determine a range of 3-day and prior 15-day antecedent precipitation. For a few cases, in which daily precipitation data were used, the times of observation coincided closely with the times of landslide occurrence, allowing a more exact estimate (e.g., for landslide nos. 39, 40, and 41).
Snowfall and snow-on-ground measurements recorded at National Weather Service (NWS) stations in the Seattle area (fig. 1) suggest that melt from snow was a significant source of water in only one of the nine winter storm periods represented: the storm period of December 26, 1996–January, 4, 1997. The effect of snowmelt on precipitation estimates is discussed below.
To characterize conditions associated with landslide occurrence and approximate a precipitation threshold, I developed scatter plots of 3-day and prior 15-day antecedent precipitation using the data compiled in Table 2. Because they merit separate discussion, individual scatter plots were developed for each of the most notable of the nine storm periods: the storm periods of December 10-30, 1933, January 17-18, 1986, December 26, 1996–January 4, 1997, and March 18-19, 1997 (Figs. 2-6). Data for the remaining five miscellaneous storm periods are shown on a single scatter plot (fig. 6). Lastly, to examine the overall trend of the data and identify a threshold, or thresholds, based on all the data, a plot of the points representing all 91 landslides and nine storm periods was generated (fig. 7).
Storm Period of December 26, 1996 to January 4, 1997
Storm related events during the period December 26, 1996 to January 4, 1997 were a major natural disaster for residents of the Seattle area and other parts of western Washington. Damage due to flooding, landslides, snow, wind, and ice was extensive and costly. A detailed account of the storm and its effects can be found in the 1997 USACE report. It is estimated that at least 100 and possibly more than 200 landslides occurred in the Seattle area as a result of the heavy precipitation that fell during that period (USACE, 1997; Baum and others; 1998, and Laprade and others, 2000).
Although heavy rains accounted for much of the precipitation, a significant amount occurred as snow. Cumulative snowfall of 22.5 inches was recorded during the period December 25-29, 1996 at the Urban Site location in Seattle (fig. 1). Depth of snow-on-ground measurements made at the Urban Site station ranged from 14 in. on December 29 to 5 in. on December 30 (U.S. Department of Commerce, 1997). Snow fall and snow-on-ground measurements were not included in data recorded at the city rain-gauge sites. Results of the 1997 USACE study indicate that there was little correlation between the observed precipitation and daily landslide occurrence. Apparently, much of the precipitation that fell was intercepted and held by the snowpack. In order to estimate the amount of water available for infiltration and landslide initiation, water output from the snowpack had to be estimated. To estimate the water output, cumulative precipitation observations were partitioned based on streamflow observations (USACE, 1997). Precipitation observations from SeaTac Airport and streamflow observations from Issaquah Creek at Issaquah approximately 10 mi.* west of Seattle were used in the calculations.
The USACE method of estimating daily water output was adopted for use in this study. However, daily precipitation data from the Urban Site station in Seattle was substituted for the SeaTac data. The estimates of daily water output are shown in Table 3. Estimated water output based on the Urban Site data is similar to that based on the SeaTac data (Table 3).
Table 3. Estimation of water output.1
|
Date |
Average Daily Flow Volume (cfsd) |
% of Total Flow Volume 12/29/96 - 1/4/97 |
Urban Site NWS Observed Precipitation (inches) |
Estimated Water Output Using Urban Site Data (inches) |
SeaTac Airport NWS Observed Precipitation (inches) |
Estimated Water Output Using SeaTac Data (inches) |
|
12/26/96 |
Base Flow |
- |
1.43 |
0 |
1.12 |
0 |
|
12/27/96 |
Base Flow |
- |
0.4 |
0 |
0 |
0 |
|
12/28/96 |
Base Flow |
- |
0.14 |
0 |
0.38 |
0 |
|
12/29/96 |
850 |
9.3 |
2.75 |
0.8 |
1.92 |
0.68 |
|
12/30/96 |
1400 |
15.4 |
0.64 |
1.32 |
0.67 |
1.13 |
|
12/31/96 |
1400 |
15.4 |
1.44 |
1.32 |
1.3 |
1.13 |
|
1/1/97 |
1750 |
19.2 |
0.89 |
1.64 |
0.43 |
1.42 |
|
1/2/97 |
1500 |
16.4 |
0.82 |
1.4 |
1.51 |
1.22 |
|
1/3/97 |
1300 |
14.2 |
0.05 |
1.22 |
0.02 |
1.05 |
|
1/4/97 |
925 |
10.1 |
0 |
0.86 |
0.04 |
0.76 |
|
TOTALS |
9125 |
100 |
8.56 |
8.56 |
7.39 |
7.39 |
1Modified from USACE, 1997
Measurements of depth of snow-on-ground at both the Seattle Urban Site and Sand Point NWS stations in Seattle indicate no measurable amounts after December 30 suggesting that water contained in the low-level snowpack in the immediate area of Seattle had melted by about December 31. It is assumed that snow no longer contributed significantly to the 3-day totals after January 2, 1997. Therefore, city rain-gauge data was used to calculate 3-day precipitation amounts for landslides that occurred on January 3 and 4, 1997 (landslide nos. 80-82 in Tables 1 and 2). Due to the effect of the snowpack, the adjusted NWS amounts were used to calculate 3-day and prior 15-day precipitation for the remainder of the slides that occurred during the 96/97 event.
A scatter plot for the 1996/1997-storm period is shown in Figure 2. Eighteen landslides with documented times of occurrence are represented by the 6 plotted data points (Table 1). The error bars indicate ranges of uncertainty for the 3-day and prior 15-day antecedent precipitation. As shown by the plot, landslides were triggered in Seattle on December 31 after a 15-day amount of approximately 1.3 inches was followed by a 3-day total of approximately 2.7 inches. After the 15-day cumulative precipitation reached about 3 inches (fig. 2), progressively less 3-day triggering amounts and higher 15-day antecedent precipitation totals were associated with the occurrence of landslides. The data are consistent with what has been documented about the 96/97 storm period (USACE, 1997). Warm temperatures and high winds during the interval December 29-31, 1996 produced snow melt, and released rainwater stored in the snowpack, resulting in near-peak water output (Table 3). A subsequent precipitation event accompanied by a warm wind on 2 January, 1997 delivered approximately 1.5 in. of rain in a 24-hr period raising the 3-day total to over 4 inches. After that, daily precipitation on January 3-4 was negligible (Table 3).
Figure 2.
Storm of March 18-19,1997
Heavy rainfall on March 18 - 19, 1997 caused damaging floods and landslides in many parts of Western Washington resulting in the declaration of a state of emergency for seven counties (Seattle Post Intelligencer (Seattle PI), 1997). At the Urban Site station in Seattle, 2.1 inches of rainfall was recorded on March 18 and 1.53 inches on March 19. At SeaTac Airport, 1.86 in. of rain fell on March 18 and 1.27 in. was recorded on March 19. The March 18 amount set a record for that date at the SeaTac location.
It was reported that at least 36 slides occurred in Seattle in a 24-hour period, 21 homes had to be evacuated, and several homes were damaged or destroyed (Seattle PI, 1997). The search for information on slides related to the March 18-19 storm yielded reports on location and time of occurrence for nine landslides (nos. 83 - 91 in Tables 1 and 2). The corresponding 3-day/prior 15-day precipitation amounts are plotted on Figure 3.
Precipitation associated with the initiation of landslides on March 18-19 can be characterized as follows. The 3-day precipitation immediately preceding the landslides ranged between 1.5 in. and 3.8 in., and the prior 15-day amount ranged between 2 and 3.5 inches. However, the upper six points on the graph which are well constrained, suggest that the best estimate for the range of 3-day precipitation may be from 2.5 to 3.8 inches. With this data set, no trends are apparent that relate changes in either the 3-day or antecedent 15-day precipitation to landslide occurrence.
Storm period of January 15-18, 1986
Torrential rainfall on January 17-18, 1986 triggered numerous landslides in Seattle. The slides caused injuries, destroyed or damaged homes, and resulted in many road closures (Seattle Times Seattle PI, 1986). Cumulative precipitation recorded at the Urban Site station for the 3-day period January 16-18 totaled 5.35 in. with 4.22 in. of the total falling on January 18.
The search for landslide data for the January 16-18 storm period produced location and time of occurrence information on 10 landslides (Table 1). Data for the January 1986 landslides are plotted on Figure 4. The three uppermost plotted points in Figure 4 ( nos. 47, 53, and 56 in Tables 1 and 2) are the most definitive. As indicated by the error bars, there is a large degree of uncertainty with regard to the 3-day amounts preceding the occurrence of the remaining slides. These data indicate that the landslides of January 17-19 were the result of a high intensity storm interval of short duration. Cumulative amounts of 15-day precipitation that preceded the 3-day totals were between 2.0 and 3.0 inches.
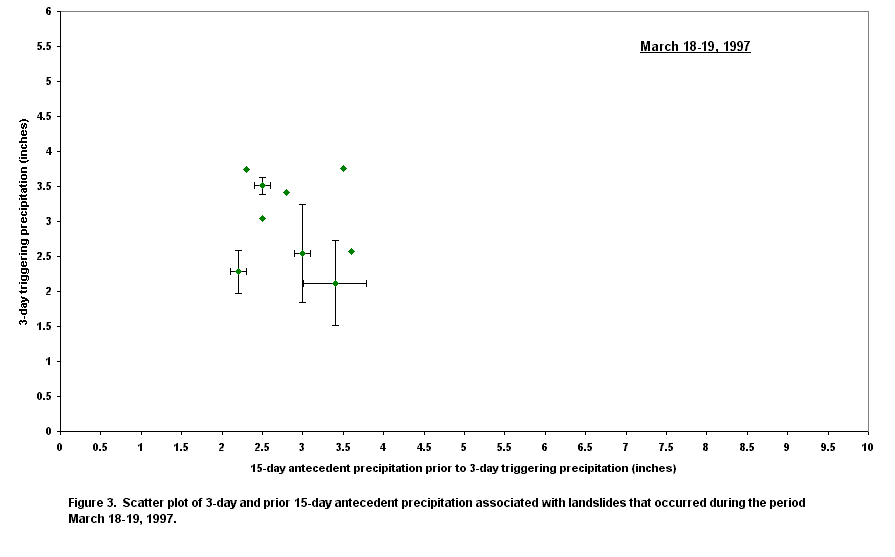
Figure 3.
Storm period of December 10-30, 1933
December 1933 was a month of record-setting precipitation and temperatures in Washington State. Precipitation totals at most places in Western Washington were the highest ever recorded in any month. Statewide, average temperatures for the month were 3.9° F above average. At the higher mountain elevations, snowfall was heavier than usual. Subsequent warm temperatures and rainfall released tremendous quantities of water which combined with heavy and continuous rains at lower elevations to cause widespread, catastrophic flooding and landslide activity. (U.S. Dept of Agriculture, 1933a). Flooding was particularly severe in the southwestern part of the state. An airline pilot flying from Portland to Seattle on December 11 described the area south of Seattle from Kelso to Olympia as appearing as an "inland sea" (Seattle PI, 1933). Many damaging landslides occurred in Seattle during the final three weeks of December 1933.
Precipitation data were compiled for 32 Seattle landslides that occurred during the period December 11 - 30, 1933 (Tables 1 and 2). Inspection of the scatter plot for these data (fig. 5) reveals that landslides occurred on December 11 when the 3-day precipitation was approximately 2.3 in. and the prior 15-day amount was between 3.4 and 3.8 inches. A week later, on December 17 landslides were triggered at lower 3-day amounts when the antecedent 15-day precipitation was about 6.5 inches. Intensification of storm activity between December 17 and December 22 resulted in numerous landslides as 3-day totals rose as high as 3.3 inches and prior 15-day amounts ranged between 6.5 and 10 inches (fig. 5). The data suggest that slide activity was most intense during the seven-day period December 17 to December 23 (see Table 1). The 3-day triggering amounts for the December 1933 landslides are, on average, approximately 1 in. less than those of the previously discussed storms. Whereas, the prior 15-day amounts are on average several inches higher, indicating a trend of lesser amounts of 3-day precipitation required for the initiation of landslides as the 15-day amounts increase. The highest 3-day precipitation totals are associated with slides that occurred during the period 12/20 through 12/22 and the lowest with those that occurred during the period 12/29 through 12/30 when prior 15-day cumulative precipitation was still high.
Miscellaneous storms between 1950 and 1996
Precipitation data for landslides associated with the miscellaneous storm periods, December 3-6, 1950, January 4-6, 1956, December 10-12, 1983, April 4-5, 1991, and February 8-9, 1996, are shown on Figure 6. Precipitation, in Seattle, during these periods, occurred as rainfall (U.S. Department of Commerce, 1950-1996). With regard to the slides of April 4-6, 1991, the plot shows that antecedent 15-day precipitation was very low (~0.5 in.) and the 3-day triggering values are relatively high (>3.0 in.). The April 1991 data is important because it helps define 3-day amounts needed to trigger multiple landslides when antecedent 15-day precipitation is very low.
Precipitation totals that resulted in the landslides of March 3-6, 1950 and February 8-9, 1996 were similar with 3-day precipitation ranging between 2.3 and 3.5 in. and prior 15-day amounts ranging between 1.5 and 2.5 inches. More information on Washington landslides associated with the storm of February 1996 can be found in a report by Harp and others, 1997.
Precipitation data for the slides of December 10-12, 1983 are fairly well constrained (fig. 6). Likewise, two of the points for the January 4-6, 1956 landslides are well constrained, but the other two have a large degree of uncertainty associated with both the 3-day and 15-day amounts.
To determine an approximate lower-bound precipitation threshold for the initiation of landslides at the defined level of landslide activity (3 or more landslides in a 72-hr period in Seattle) a scatter plot using all of the data points (figs. 2-6) was constructed (fig. 7). Midpoints of data with error bars were plotted as the best estimate of the 3-day and 15- day precipitation.
For 15-day antecedent amounts of approximately 3.0 in. or less, the data indicate an approximate lower bound threshold (solid line in fig. 7) defined by the equation:
| Y = -0.67X + 3.50, where | (1) |
| Y = 3-day precipitation prior to the initiation of landslides, and | |
| X = the 15-day antecedent precipitation prior to the 3-day total. |
For the higher values of 15-day precipitation, between 3 in. and 10 in., a lower-bound threshold is not well defined. However, the lowermost points in that range (representing landslides that occurred late in the 1996/1997 storm period and in late December 1933, figs. 2 and 5) suggest that as little as an inch of precipitation during a 3-day interval may trigger landslides. Based on those points the lower-bound threshold associated with 15-day amounts greater than 3 in. is, tentatively, taken to be 1 inch of triggering precipitation in a 3-day period. Extrapolation of the threshold line in Figure 7 suggests that a lower-bound 3-day precipitation threshold of 1-inch for the 15-day precipitation range of 3 to 5 inches may be too low. However, the conservative 1 inch in 3 days amount is proposed until additional data are obtained to better define the threshold in that range.
The precipitation boundaries defined above are interpreted as approximate lower-bound thresholds below which the specified level of landslide activity does not occur or occurs only rarely and above which it may occur under certain conditions. This definition is similar to the definition of a minimum probability threshold for landslide triggering given by Crozier (1986). I use the precipitation thresholds in conjunction with an air-temperature index, described in the following section, to develop a method for anticipating the occurrence of precipitation-induced landslides during the December-March wet season.
To examine the relation between air temperature and landslides in Seattle, temperature data was compiled for the 31 landslide days listed in Table 1 (note that the 91 landslides listed in Table 1 occurred on 31 individual days). Daily maximum and minimum temperatures from the Seattle area NWS stations were compiled for the analysis (fig. 1 and Table 4 in appendix). Figure 8 shows the cumulative frequency of daily maximum temperature for the 31 landslide days that are part of 3-day events with 3 or more landslides (Table 4). Also shown is the cumulative frequency of daily maximum temperature for all days (December–March) over a 50-year period (1948-1998) based on data from SeaTac Airport. As indicated by the graph, nearly all of the landslides occurred on days when the daily maximum temperature was above 43° F (6° C) and a high percentage (~85%) occurred on days when the daily maximum temperature was between 46° and 56° F (9° and 13° C).
To test the hypothesis that daily maximum temperatures on landslide days during the December-March wet season are significantly higher than the norm, the Z-test for comparison of means was applied (Table 5). The calculated z-value is significantly higher than the critical Z-value at the 1% confidence level (alpha = .01) indicating that the mean of daily maximum temperatures on landslide days that are part of 3-day events with 3 or more landslides is significantly higher than the norm. As indicated by P(Z>=z) in Table 5, there is less than a one percent chance that the observed difference in means would occur if the 50-year and landslide-day populations were the same.

Figure 7.
Table 5. Comparison of mean of daily maximum temperature on landslide days (December-March) that are part of 3-day events with 3 or more landslides and mean of daily maximum temperature of all days (December-March) in a 50-year period (1948-1998).
|
Daily maximum temperature on landslide days (December-March) that are part of 3-day events with 3 or more landslides |
50-year sample of daily maximum temperatures (all days, December-March) |
|
|
Mean |
52 |
47.7 |
|
Variance |
13.5 |
50.9 |
|
Observations |
31 |
6053 |
|
z |
6.4 |
|
|
P(Z>=z) |
0 |
|
|
Z Critical one-tail (alpha = .01) |
2.3 |
The total database of 187 landslides from which the 91 landslides of Table 1 were drawn has a total of 79 landslide days on which 1 or more landslides occurred. A comparison of the mean of daily maximum temperatures for the 79 days with 1 or more landslides and the mean for the 31 days that are part of 3-day events with 3 or more landslides yielded the results shown in Table 6.
Table 6. Comparison of mean of daily maximum temperature on landslide days (December-March) that are part of 3-day events with 3 or more landslides and mean of daily maximum temperature of landslide days with one or more landslides (December-March).
|
Daily maximum temperature on landslide days (December-March) that are part of 3-day events with 3 or more landslides |
Daily maximum temperatures on landslide days with one or more landslides. |
|
|
Mean |
52 |
51.7 |
|
Variance |
13.5 |
27.9 |
|
Observations |
31 |
79 |
|
z |
0.34 |
|
|
P(Z>=z) one-tail |
0.37 |
|
|
z Critical one-tail (alpha = .10) |
1.28 |
As shown in Table 6, the critical value for Z at the 0.10 (90%) confidence level is 1.28 and the calculated z-value is 0.34 indicating that the hypothesis that the means of those populations are different should be rejected. The probability that the calculated z-value would occur if the means were not equal is approximately 1 in 3 as indicated by P(Z>=z) = 0.37 in Table 6. This result may be explained by the possibility that not all landslides that occurred during a given 3-day period have been identified and incorporated into the database. Therefore, as more data on historical landslides is found, some of the days now categorized as having 1 or more landslides may be added to the 3 or more landslides in 3 days grouping.
As indicated in Table 4, the daily maximum temperature was greater than 43°F (6° C) on all but one of the landslide days (no. 82, Table 4). Therefore, a daily maximum temperature of 43° F (6° C) has been selected as an air-temperature index, below which the specified level of landslide activity (3 or more slides in a 72 hr period) is unlikely to occur. The occurrence of a high percentage of landslides at higher temperatures may be explained, in part, by the association of heavy rainfall with temperatures that are above the air-temperature index and the greater likelihood that precipitation will be in the form of snow at lower temperatures. Landslides during the 1996-1997 storm period were induced by melt from snow and rainfall, but snowmelt from a snowpack was not a significant factor in the triggering of slides associated with the other storm events.
The method developed to anticipate the occurrence of landslides during the winter wet-season is based on the precipitation thresholds and air-temperature index previously described. Readily accessible daily or preferably hourly precipitation data from nearby weather stations is tracked in order to compute the 3-day and 15-day (prior to 3-day) precipitation totals. Simultaneously, the threshold line equation (fig. 7 and equation 1) is used to determine a numerical precipitation index for the occurrence of landslides (when conditions of 15-day antecedent precipitation are less than 3.0 inches). This is accomplished by subtracting the 3-day precipitation at the threshold from the actual or observed 3-day precipitation:
P0 = P1 -(-P2 (0.67)+3.5), or
P0 = P1 + 0.67 P2 – 3.5 where, (2)
P0 is the numerical precipitation index,
P1 is the actual 3-day (72 hr) precipitation in inches, and
P2 is the15-day precipitation prior to the actual 3-day amount in inches.
When P0 is positive conditions are above the precipitation threshold and when it is negative they are below the threshold.
The numerical precipitation index is then used in conjunction with the air-temperature index to identify times when conditions are conducive for the initiation of landslides or when projected conditions based on precipitation and temperature forecasts indicate conditions will likely be conducive. Conditions are identified as conducive when the daily maximum temperature is above the 43° F (6° C) index, and one of two criteria are met:
To demonstrate the method, daily precipitation and historical air-temperature data for January and February 1996 were compiled, and the criteria for identifying critical days were applied on a day to day basis (Table 7). In this example, the method identified 7 days when antecedent precipitation and temperature conditions were conducive for the initiation of landslides (highlighted in yellow in Table 7), and 54 days when they were not. Temperature data for days that are not above the temperature index are highlighted in blue. Because the daily maximum temperature was not above 43° F on January 21 and 22, they are considered unlikely landslide days even though the 3-day precipitation was greater than 1.0 inch and the 15-day prior amounts were higher than 3.0 in. (Table 7). Conditions on January 20 are considered conducive for landslide activity, even though P0 is negative, because the 3-day precipitation exceeds an inch, the 15-day precipitation exceeds 3.0 in., and the temperature is above the 43° F air-temperature index. February 8, 9, and 10 were flagged (highlighted in yellow) because the daily maximum temperature was above 43° F and P0 was positive when the corresponding prior 15-day amounts were less than 3.0 inches. Whereas, February 18,19, and 22 were flagged because the 3-day precipitation was greater than 1 inch when the prior 15-day precipitation was greater than 3.0 inches and daily maximum temperatures were above 43°F.
Table 7. Example of data generated to identify times when conditions are most likely to initiate landslides.
| Date |
Daily precipitation (inches)
|
72hr precipitation (Inches)
|
15-day precipitation prior to 72 hr precipitation (inches) | Landslide occurrence index (P0)1 | Daily Maximum Temperature (F0) |
| 1/1/96 | 0 | 0.22 | 1.76 | -2.10 | 50 |
| 1/2/96 | 0.06 | 0.09 | 1.94 | -2.11 | 56 |
| 1/3/96 | 0 | 0.06 | 1.97 | -2.12 | 51 |
| 1/4/96 | 0.02 | 0.08 | 1.42 | -2.47 | 45 |
| 1/5/96 | 0.15 | 0.17 | 1.27 | -2.48 | 43 |
| 1/6/96 | 0.38 | 0.55 | 1.27 | -2.10 | 52 |
| 1/7/96 | 0.8 | 1.33 | 1.27 | -1.32 | 57 |
| 1/8/96 | 0 | 1.18 | 1.42 | -1.37 | 57 |
| 1/9/96 | 0 | 0.8 | 1.8 | -1.49 | 52 |
| 1/10/96 | 0 | 0 | 2.6 | -1.76 | 52 |
| 1/11/96 | 0 | 0 | 2.6 | -1.76 | 58 |
| 1/12/96 | 0 | 0 | 2.6 | -1.76 | 55 |
| 1/13/96 | 0.14 | 0.14 | 2.6 | -1.62 | 49 |
| 1/14/96 | 0.41 | 0.55 | 2.59 | -1.21 | 53 |
| 1/15/96 | 1.12 | 1.67 | 2.14 | -0.40 | 53 |
| 1/16/96 | 0.07 | 1.6 | 1.77 | -0.71 | 44 |
| 1/17/96 | 0.03 | 1.22 | 1.99 | -0.95 | 42 |
| 1/18/96 | 0.1 | 0.2 | 3.08 | -1.24 | 43 |
| 1/19/96 | 0.47 | 0.6 | 3.15 | -0.79 | 40 |
| 1/20/96 | 0.66 | 1.23 | 3.12 | -0.18 | 47 |
| 1/21/96 | 0.64 | 1.77 | 3.22 | 0.43 | 42 |
| 1/22/96 | 0.13 | 1.43 | 3.67 | 0.39 | 42 |
| 1/23/96 | 0.17 | 0.94 | 4.18 | 0.24 | 43 |
| 1/24/96 | 0.06 | 0.36 | 4.44 | -0.17 | 40 |
| 1/25/96 | 0.02 | 0.25 | 3.77 | -0.72 | 42 |
| 1/26/96 | 0 | 0.08 | 3.94 | -0.78 | 42 |
| 1/27/96 | 0 | 0.02 | 4 | -0.80 | 41 |
| 1/28/96 | 0.18 | 0.18 | 4.02 | -0.63 | 37 |
| 1/29/96 | 0 | 0.18 | 4.02 | -0.63 | 28 |
| 1/30/96 | 0 | 0.18 | 4.02 | -0.63 | 33 |
| 1/31/96 | 0 | 0 | 4.06 | -0.78 | 40 |
| 2/1/96 | 0 | 0 | 3.65 | -1.05 | 42 |
| 2/2/96 | 0 | 0 | 2.53 | -1.80 | 42 |
| 2/3/96 | 0.33 | 0.33 | 2.46 | -1.52 | 40 |
| 2/4/96 | 0.04 | 0.37 | 2.43 | -1.50 | 51 |
| 2/5/96 | 0.84 | 1.21 | 2.33 | -0.73 | 52 |
| 2/6/96 | 0.35 | 1.23 | 2.19 | -0.80 | 55 |
| 2/7/96 | 0.55 | 1.74 | 1.57 | -0.71 | 54 |
| 2/8/96 | 2.63 | 3.53 | 1.77 | 1.22 | 57 |
| 2/9/96 | 0.07 | 3.25 | 1.99 | 1.08 | 53 |
| 2/10/96 | 0 | 2.7 | 2.37 | 0.79 | 56 |
| 2/11/96 | 0 | 0.07 | 4.94 | -0.12 | 58 |
| 2/12/96 | 0 | 0 | 4.99 | -0.16 | 59 |
| 2/13/96 | 0 | 0 | 4.99 | -0.16 | 62 |
| 2/14/96 | 0 | 0 | 4.99 | -0.16 | 62 |
| 2/15/96 | 0 | 0 | 4.81 | -0.28 | 62 |
| 2/16/96 | 0.05 | 0.05 | 4.81 | -0.23 | 57 |
| 2/17/96 | 0.72 | 0.77 | 4.81 | 0.49 | 54 |
| 2/18/96 | 0.62 | 1.39 | 4.81 | 1.11 | 57 |
| 2/19/96 | 0.15 | 1.49 | 4.86 | 1.25 | 49 |
| 2/20/96 | 0.18 | 0.95 | 5.58 | 0.71 | 56 |
| 2/21/96 | 0.23 | 0.56 | 5.87 | 0.13 | 42 |
| 2/22/96 | 0.63 | 1.04 | 5.98 | 0.53 | 45 |
| 2/23/96 | 0 | 0.86 | 5.32 | 0.80 | 43 |
| 2/24/96 | 0.14 | 0.77 | 5.2 | 0.75 | 46 |
| 2/25/96 | 0 | 0.14 | 5.28 | 0.10 | 47 |
| 2/26/96 | 0 | 0.14 | 2.65 | -1.58 | 46 |
| 2/27/96 | 0 | 0 | 2.72 | -1.68 | 46 |
| 2/28/96 | 0 | 0 | 2.72 | -1.68 | 50 |
| 2/29/96 | 0 | 0 | 2.72 | -1.68 | 55 |
1See text for definition of P0
The total database of 187 landslides with known dates of occurrence (unpub. data, A.F. Chleborad and S. Steffens Hawley, 2000) includes five slides that occurred during the period January 1 to February 29, 1996. Three of those occurred during February 8-9 (Table 1 and fig. 6), one on February 12, and one on February 18. For the purpose of comparison, those four dates are highlighted in column 1 of Table 7. However, the comparison cannot be used to evaluate the method because data relating to the slides of February 8-9 were used to develop the precipitation threshold and air-temperature index.
In this study, precipitation associated with historic landslides in Seattle has been characterized and a method for anticipating the occurrence of multiple landslides based on precipitation thresholds and an air-temperature index has been proposed. Results of the study indicate that 15-day cumulative precipitation influences the amount of 3-day precipitation required to initiate landslides at the specified level of landslide occurrence.
Because the precipitation thresholds and air-temperature index are approximations and because factors other than precipitation and air temperature influence the initiation of landslides, some false signals can be expected with the use of the method. Consequently, the method cannot be used to predict landslide occurrence. However, it is expected that it will be useful for identifying times when precipitation-induced landslides are most likely to occur, thus providing a basis for initiating prudent measures to reduce the landslide hazard, such as, avoidance or intensified monitoring and observation of landslide prone areas. In addition, it is expected that the method will complement methods based on rainfall intensity-duration thresholds that are currently being developed (J. Godt, oral commun., 2000) by helping identify critical times to closely monitor rainfall.
Advantages of the method include its simplicity and the use of easily acquired climatic data (daily or hourly precipitation and air temperature). Also, awareness of 15-day antecedent cumulative precipitation at any given time provides a basis for estimating critical amounts of 3-day precipitation needed to surpass the threshold.
Factors other than precipitation can have a significant influence on the initiation of landslides and need to be examined as well. For example, evapotranspiration and the snowmelt process can affect the amount of precipitation that is actually available for infiltration. Also, the precipitation thresholds and air-temperature index may be better defined by considering the different types of landslides separately (e.g., shallow slides and debris flows versus deep-seated rotational and translational slides). Shallow, rapid landslides and debris flows can occur abruptly in response to intense rainfall, whereas, slow-moving, deep-seated landsliding typically occurs gradually in response to precipitation events, with prolonged acceleration preceding any catastrophic movement (Iverson, 2000).
Work plans include an evaluation of the method by compilation and analysis of landslide and climatic data during future winter wet seasons and analysis of historical climatic and landslide data that were not part of this study. If the evaluation confirms the usefulness of the method it may be applied to other areas with a significant landslide hazard.
I thank Rex Baum, Jonathan Godt, and Dave Perkins for their review comments and suggestions. Also, I am grateful to Suzanne Steffens Hawley for a careful compilation of data used for this report.
Baum, R.L., Chleborad, A.F., Schuster, R.L., 1998, Landslides triggered by the winter 1996-97 storms in the Puget Lowland, Washington: U.S. Geological Survey Open File report 98-239, 16 p.
Campbell R.H., 1975, Soil slips, debris flows, and rainstorms in the Santa Monica mountains and vicinity, southern California: U.S. Geological Survey Professional Paper 851, 51 p.
Cannon, Susan H. and Ellen, Stephen, 1985, Rainfall conditions for abundant debris avalanches, San Francisco Bay Region, California: California Geology, December 1985, p. 267-272.
Chleborad, A.F., 1997, Temperature, snowmelt, and the onset of spring season landslides in the central Rocky Mountains: U.S. Geological Survey Open-File Report 97-27, 35 p.
Chleborad, A.F., 1998, Use of air-temperature data to anticipate the onset of snowmelt-season landslides: U.S. Geological Survey Open-File Report 98-124, 16 p.
Cruden, D.M., and Varnes, D.J., 1996, Landslide types and processes: in Turner, A.K. and Schuster, R.L., Landslides-Investigation and Mitigation, Transportation Research Board Special Report 247,
p. 36-75.
Crozier, Michael J., 1986, Landslides: causes, consequences and environment: Surry Hills, Australia, Croom Helm, p. 171-192.
Deganutti, A.M., Marchi, and Arattano, M., 2000, Rainfall and debris-flow occurrence in the Moscardo basin (Italian Alps): in Debris-flow hazards mitigation: Mechanics, prediction, and assessment, Wieczorek and Naeaser eds., Proceedings of the second international conference on debris-flow hazards mitigation, Taipei, Taiwan, 16-18 August, 2000, p. 67 - 72.
Harp, E.L., Chleborad, A.F., Schuster, R.L., Cannon, S.H., Reid, M.E., and Wilson, R.C., 1997, Landslides and Landslide Hazards in Washington State Due to February 5-9. 1996 storm, U.S. Geological Survey Administrative Report 29 p. and 1 pl.
Laprade, W.T., Kirkland, T.E., Nashem, W.D., and Robertson, C.A., 2000, Seattle landslide study, Shannon and Wilson, Inc. Internal Report W-7992-01, 164 p.
Seattle Post Intelligencer, 1933, Devastation spreading as Snohomish dike crumbles; N.W. loss exceeds 5 million: Seattle, Washington, December 12, p. 1.
Seattle Times Seattle Post Intelligencer, 1986, Two injured as mudslide hits home: Seattle, Washington, January 19, p. A1 and A8.
Seattle Post Intelligencer, 1997, Three dozen slides roar in Seattle:Seattle, Washington, March 20, P. A1 and A6.
Tubbs, D.W., 1974, Landslides in Seattle: Washington Division of Geology and Earth Resources Information Circular 52, 15 p., 1 plate.
U.S. Army Corps of Engineers, 1997, Post Event Report: Winter storm of 1996/1997, Federal Disaster DR 1159, Western Washington Summary: Document prepared for the Federal Emergency Management Agency, 49 p.
U.S. Department of Agriculture, 1933a, Climatological data, general summary: Washington section, December, v. 12, no. 6.
U.S. Department of Agriculture, 1933b, Climatological data: Washington section, December, v. 12, no. 6.
U.S. Department of Commerce, 1950, Climatological data: Washington, March, Vol. LIV, no. 3.
U.S. Department of Commerce, 1955, Climatological data: Washington, December, Vol. LX-1, no. 12.
U.S. Department of Commerce, 1956, Climatological data: Washington, January, Vol. LX, no. 1.
U.S. Department of Commerce, 1983, Climatological data: Washington, November, Vol. 87, no. 11.
U.S. Department of Commerce, 1983, Climatological data: Washington, December, Vol. 87, no. 12.
U.S. Department of Commerce, 1986, Climatological data: Washington, January, Vol. 90, no. 1.
U.S. Department of Commerce, 1991, Climatological data: Washington, March, Vol. 95, no. 3.
U.S. Department of Commerce, 1991, Climatological data: Washington, April, Vol. 95, no. 4.
U.S. Department of Commerce, 1996, Climatological data: Washington, January, Vol. 100, no. 1.
U.S. Department of Commerce, 1996, Climatological data: Washington, February, Vol. 100, no. 2.
U.S. Department of Commerce, 1996, Climatological data: Washington, December, Vol. 100, no. 12.
U.S. Department of Commerce, 1997, Climatological data: Washington, January, Vol. 101, no. 1.
U.S. Department of Commerce, 1997, Climatological data: Washington, March, Vol. 101, no. 3.
Voight, Barry, 1978, Lower Gros Ventre slide, Wyoming, U.S.A.: Chap. 3 in Rockslides and avalanches, Barry Voight, editor, 1, Developments in Geotechnical Engineering, Elsevier Scientific Publishing, v. 14A, p. 113-166.
Wieczorek G.F., and Sarmiento, J., 1983, Significance of storm intensity-duration for triggering of debris flows near La Honda, California: Geological Society of America Abstracts with Programs, v. 15, no. 5, p. 289.
Wieczorek, Gerald, F., 1987, Effect of rainfall and duration on debris flows in central Santa Cruz Mountains, California: in, Costa J.E., and Wieczorek, G.F., eds. Debris flows/avalanches: Processes, recognition, and mitigation: Geological Society of America Reviews in Engineering Geology, Volume VII, p. 93-104.
Wieczorek, G.F., Lips, E.W., and Ellen, S.D., 1989, Debris flows and hyperconcentrated floods along the Wasatch Front, Utah, 1983 and 1984: Bulletin of the Association of Engineering Geologists, V. 26, No. 2, p. 191-208.
Table 1. Database of Seattle landslides that are part of historic landsllde events with three or more landslide occurrences in City of Seattle in a 72-hour period.
|
Landslide |
Location |
Date of |
Time of |
Source of information |
|
1 |
Vicinity of 5th Ave. and Terrace St. |
12/11/33 |
- |
City of Seattle landslide files* |
|
2 |
6200 block of Beach Dr. |
12/11/33 |
- |
Seattle Post Intelligencer (Seattle PI), 12/12/33, p. 3 |
|
3 |
6200 block of Beach Dr. |
12/11/33 |
- |
Seattle PI, 12/12/33, p. 3 |
|
4 |
Vicinity of Eastlake Ave. and East Ward St. |
12/11/33 |
- |
Seattle PI, 12/12/33, p. 3 |
|
5 |
Vicinity of Perkins Ln. and Bertona St. |
12/11/33 |
- |
Seattle PI, 12/12/33, p. 3 |
|
6 |
Airport Wy. near Stevens St. |
12/11/33 |
- |
Seattle PI, 12/12/33, p. 3 |
|
7 |
Lakeview Blvd. near Galer St. |
12/11/33 |
- |
Seattle PI, 12/12/33, p. 3 |
|
8 |
1000 block of Elliott Ave. |
12/17/33 |
At night |
City of Seattle landslide files* |
|
9 |
5400 block of W. Olga St. |
12/17/33 |
- |
City of Seattle landslide files* |
|
10 |
4800 block of Jacobson Rd |
12/17/33 |
- |
Seattle PI, 12/18/33, p. 1 |
|
11 |
4800 block of Beach Dr. |
12/17/33 |
- |
Seattle PI, 12/18/33, p. 1 |
|
12 |
Rainier Ave. near Norfolk St. |
12/17/33 |
- |
Seattle PI, 12/18/33, p. 1 |
|
13 |
Westlake Ave. N. near Comstock St. and Halliday St. |
12/17/33 |
- |
Seattle PI, 12/18/33, p. 1 |
|
14 |
1600 block of Harbor S.W. |
12/17/33 |
- |
City of Seattle landslide files* |
|
15 |
12th Ave S. between Edmunds and Angeline Sts. |
12/18/33 |
- |
Seattle PI, 12/19/33, p. 1 |
|
16 |
Near California Wy. and Ferry Ave. |
12/18/33 |
- |
Seattle PI, 12/19/33, p. 2 |
|
17 |
Between Harbor Avenue S.W. and Maryland Pl. |
12/20/33 |
Morning |
Seattle Daily Times, 12/20/33, p. 1; Seattle PI, 12/21/33, p. 2 |
|
18 |
California Wy. near Harbor Ave. S.W. |
12/20-21/33 |
- |
Seattle PI, 12/21/33, p. 2; Seattle Daily Times, 12/21/33, p. 8 |
|
19 |
Beach Dr. near West Juneau St. and Atlas Pl. |
12/20-21/33 |
At night |
Seattle PI, 12/21/33, p. 2; Seattle Daily Times, 12/21/33, p. 8 |
|
20 |
Beach Dr. near Atlas Pl. |
12/20-21/33 |
- |
Seattle PI, 12/21/33, p. 2; Seattle Daily Times, 12/21/33, p. 8 |
|
21 |
Vicinity of 9th Ave. S. and Jackson St. |
12/20-21/33 |
- |
Seattle PI, 12/21/33, p. 2 |
|
22 |
6000 block of Atlas Pl. |
12/21/33 |
- |
City of Seattle landslide files* |
|
23 |
5000 block of Laurelcrest |
12/21/33 |
11:00 AM |
City of Seattle landslide files* |
|
24 |
1900 block of Perkins Ln.W. |
12/21/33 |
- |
City of Seattle landslide files* |
|
25 |
3500 block of 51st Ave. N.E. |
12/21/33 |
- |
City of Seattle landslide files* |
|
26 |
6500 block of 49th Ave. S. |
12/21-22/33 |
- |
Seattle PI, 12/22/33, p. 1 |
|
27 |
2500 block of 5th Ave. N. |
12/22/33 |
Morning |
City of Seattle landslide files* |
|
28 |
Westlake Ave. N. near Fremont bridge |
12/23/33 |
- |
Seattle Daily Times, 12/24/33, p. 8 |
|
29 |
2500 block of Perkins Ln. |
12/23/33 |
- |
Seattle Daily Times, 12/24/33, p. 8 |
|
30 |
West Seattle |
12/29-30/33 |
- |
Seattle Daily Times, 12/30/33, p. 1 |
|
31 |
Queen Anne Hill |
12/29-30/33 |
- |
Seattle Daily Times, 12/30/33, p. 1 |
|
32 |
Beacon Hill |
12/29-30/33 |
- |
Seattle Daily Times, 12/30/33, p. 1 |
|
33 |
1500 block of Alki Ave. S.W. |
3/3/50 |
Midnight |
City of Seattle landslide files* |
|
34 |
Vicinity of 47th Ave. S.W. and 104th St. |
3/3/50 |
- |
Seattle Times, 3/5/50, p. 2 |
|
35 |
5000 block of NE laurelcrest Ln. |
3/4/50 |
10:40 PM |
City of Seattle landslide files* |
|
36 |
4000 block of Laurelcrest Ln. |
3/5/50 |
- |
City of Seattle landslide files* |
|
37 |
12300 block of Riviera Pl. N.E. |
3/6/50 |
6:30 AM |
Seattle Daily Times, 3/5/50, p.1 |
|
38 |
2300 block of South Bayview St. |
1/4/56 |
- |
City of Seattle landslide files* |
|
39 |
12500 block of 42nd Ave N.E. |
1/5/56 |
6:50 AM |
Seattle Daily Times (night sports final), 1/5/56, p.1 |
|
40 |
13000 block of 42nd Ave. N.E. |
1/5/56 |
- |
City of Seattle landslide files* |
|
41 |
12700 block of 39th Ave. N.E. |
1/6/56 |
6:00 AM |
Seattle Daily Times (night sports final), 1/6/56, p.1 |
|
42 |
12500 block of 39th Ave. N.E. |
1/6/56 |
- |
City of Seattle landslide files* |
|
43 |
1700 block of Sturgus Ave. S. |
12/10/83 |
- |
City of Seattle landslide files* |
|
44 |
100 block of Lake Dell |
12/10/83 |
- |
City of Seattle landslide files* |
|
45 |
1500 block Aurora Ave. |
12/11/83 |
6:00 AM |
City of Seattle landslide files* |
|
46 |
1700 block of Sturgus Ave. S. |
12/12/83 |
- |
Seattle PI, 12/13/83, p. 1, 12/14/83, p. D1 |
|
47 |
9200 block of Greenwood Ave. N. |
1/18/86 |
After 6:00 PM |
City of Seattle landslide files* |
|
48 |
1200 block of Harbor Ave. S.W. |
1/18/86 |
- |
City of Seattle landslide files* |
|
49 |
Keppler St. near Rainier Ave. S. |
1/18/86 |
- |
City of Seattle landslide files* |
|
50 |
Near 38th Ave. and Newport Ave. |
1/18/86 |
- |
City of Seattle landslide files* |
|
51 |
1900 block of Sunset Ave S.W. |
1/18/86 |
After 6:00 PM |
City of Seattle landslide files* |
|
52 |
1700 block of Harbor Ave. S.W. |
1/18/86 |
- |
City of Seattle landslide files* |
|
53 |
3100 block of W. Harley St. |
1/18/86 |
5:00 PM |
City of Seattle landslide files* |
|
54 |
Near 11th Ave. and W. Galer St. |
1/18/86 |
- |
City of Seattle landslide files* |
|
55 |
1000 block of California Ln. S.W. |
1/18-19/86 |
- |
City of Seattle landslide files* |
|
56 |
2500 block of N.E. 97th St. |
1/19/86 |
Before 2:00 AM |
City of Seattle landslide files* |
|
57 |
4600 block of S.W. Maple Wy. |
4/5/91 |
5:00 AM |
City of Seattle landslide files* |
|
58 |
200 block of S. 218th St. |
4/5/91 |
5:00 AM |
Seattle Times (night final), 4/5/91, pg. A1 |
|
59 |
235 Lake Dell Ave. |
4/5/91 |
Before 6:10 PM |
City of Seattle landslide files* |
|
60 |
14200 block of 40th Ave. N.E. |
4/4-5/91 |
At night |
City of Seattle landslide files* |
|
61 |
4200 block of N.E. 89th St. |
2/8/96 |
8:30 PM |
City of Seattle landslide files* |
Table 1 cont’d
|
62 |
9700 block of Rainier Ave. S. |
2/8-9/96 |
At night |
Seattle PI, 2/9/96, p. A10 |
|
63 |
5000 block of N.E. Laurelcrest Ln. |
2/9/96 |
Early morning |
City of Seattle landslide files* |
|
64 |
13700 block of 40th Ave. N.E. |
12/29/96 |
- |
City of Seattle landslide files* |
|
65 |
5200 block of S.W. Jacobson Rd. |
12/30-31/96 |
At night |
White Center News, 1/8/97, pgs. 1and 2 |
|
66 |
1300 block of Alki Ave. S.W. |
12/31/96 |
7:00 PM |
City of Seattle landslide files* |
|
67 |
2500 block of Dexter Ave. N. |
12/31/96 |
10:00 PM |
Seattle PI (morning edition), 1/1/97, p. A1 |
|
68 |
Between 1700 and 2400 blocks of Perkins Ln. W. |
12/31/96 |
Afternoon |
Seattle PI (morning edition), 1/1/97, p. A1 |
|
69 |
1900 block of Perkins Ln. W. |
12/31/96 |
Afternoon |
Seattle PI (morning edition), 1/1/97, p. A1 |
|
70 |
Between 1700 and 2400 blocks of Perkins Ln W. |
12/31/96 |
Afternoon |
Seattle PI (morning edition), 1/1/97, p. A1 |
|
71 |
Between 1700 and 2400 blocks of Perkins Ln W. |
12/31/96 |
Afternoon |
Seattle PI (morning edition), 1/1/97, p. A1 |
|
72 |
1400 block of 38th Ave. |
1/1/97 |
6:00 AM |
Personal field notes |
|
73 |
2500 block of Perkins Ln. |
1/1/97 |
2:00 PM |
Seattle Times (night final), 1/2/97, pgs. A1 & A3 |
|
74 |
2500 block of Perkins Ln. |
1/1/97 |
2:00 PM |
Seattle Times (night final),1/2/97, pgs. A1 & A3, |
|
75 |
2300 block of Fauntleroy Wy. S.W. |
1/1/97 |
9:30 PM |
Seattle Times (night final), 1/2/97, pg. A3 |
|
76 |
7000 block of Seaview Ave. N.W. |
1/1/97 |
8:00 PM |
Seattle Times (night final), 1/2/97, pg. A3 |
|
77 |
3000 block of Perkins Ln. W. |
1/1/97 |
7:00 PM |
Seattle PI (morning paper), 1/1/97, p. A1 |
|
78 |
Interlaken Dr. E. on N. Capitol Hill |
1/1/97 |
- |
Seattle Times (night final), 1/2/97, pgs. A1 & A3 |
|
79 |
Magnolia Bridge near Magnolia Wy. |
1/2/97 |
4:30 PM |
Seattle Times (night final), 1/3/97, pgs. A1 & A15 |
|
80 |
Beach Dr. N.E. between 151 St. and 155th St. |
1/3/97 |
3:00 AM |
Seattle Times.com (online edition archives), 1/4/97 |
|
81 |
1500 block of Lakeview Blvd. E. |
1/3/97 |
5:30 AM |
Seattle Times.com (online edition archives), 1/4/97 |
|
82 |
North end of California Wy. S.W. |
1/4/97 |
At night |
White Center News, 1/8/97, p. 2 |
|
83 |
1500 block of Alki Ave. S.W. |
3/18/97 |
- |
White Center News, 3/26/97, p. 4 |
|
84 |
2300 block of Perkins Ln. |
3/18-19/1997 |
At night |
Seattle PI, 3/19/97, p A1 |
|
85 |
1900 block of 17th Ave. S. |
3/19/97 |
Before 6:00 AM |
Seattle PI, 3/20/97, p. A6; Seattle Times, 3/19/97, p. A1 |
|
86 |
Aurora Avenue on east side of Queen Anne Hill |
3/19/97 |
6:00 AM |
Seattle PI, 3/20/97, p. A1 |
|
87 |
7700 block of 45th Ave. S.W. |
3/19/97 |
8:00 AM |
Seattle PI (morning edition), 3/20/97, p. A1 |
|
88 |
Vicinity of 17th Ave. and S. Plum St. |
3/19/97 |
2:30 AM |
Seattle PI (morning edition), 3/20/97, p. A1 |
|
89 |
2300 block of Westlake Ave N. |
3/19/97 |
10:00 PM |
Seattle PI (morning edition), 3/20/97, p. A6 |
|
90 |
3000 block of NE Perkins Way |
3/19/97 |
8:00 AM |
Seattle Times (night final), 3/19/97, p. A6 |
|
91 |
1700 block of Magnolia Way W. |
3/19/97 |
Afternoon |
Seattle PI (morning edition), 3/21/97 |
*The City of Seattle landslide files consist of various types of documentation including copies of internal memoranda, legal doucments, maintainance reports, geotechnical reports, claim for damage forms, photographs, and newspaper articles. Copies of documents and written reports used as sources of information for this report are on file in the offices of the U.S. Geological Survey, Denver, Colorado.
Table 2. Antecedent precipitation for landslides listed in Table 1.
|
Landslide |
72-hr precipitation prior to landslide occurrence (inches)2 |
15-day precipitation prior to 72-hr triggering precipitation (inches)2 |
Data source |
|
1 |
2.33-2.34 |
3.38-3.78 |
Seattle |
|
2 |
2.33-2.34 |
3.38-3.78 |
Seattle |
|
3 |
2.33-2.34 |
3.38-3.78 |
Seattle |
|
4 |
2.33-2.34 |
3.38-3.78 |
Seattle |
|
5 |
2.33-2.34 |
3.38-3.78 |
Seattle |
|
6 |
2.33-2.34 |
3.38-3.78 |
Seattle |
|
7 |
2.33-2.34 |
3.38-3.78 |
Seattle |
|
8 |
.15-2.07 |
6.56-6.63 |
Seattle |
|
9 |
.15-2.07 |
6.56-6.63 |
Seattle |
|
10 |
.15-2.07 |
6.56-6.63 |
Seattle |
|
11 |
.15-2.07 |
6.56-6.63 |
Seattle |
|
12 |
.15-2.07 |
6.56-6.63 |
Seattle |
|
13 |
.15-2.07 |
6.56-6.63 |
Seattle |
|
14 |
.15-2.07 |
6.56-6.63 |
Seattle |
|
15 |
2.07-3.01 |
6.63-6.7 |
Seattle |
|
16 |
2.07-3.01 |
6.63-6.7 |
Seattle |
|
17 |
3.28-3.31 |
6.71-8.19 |
Seattle |
|
18 |
3.29-3.32 |
8.19-9.5 |
Seattle |
|
19 |
3.29-3.32 |
8.19-9.5 |
Seattle |
|
20 |
3.29-3.32 |
8.19-9.5 |
Seattle |
|
21 |
3.29-3.32 |
8.19-9.5 |
Seattle |
|
22 |
3.28-3.29 |
8.2-9.2 |
Seattle |
|
23 |
3.28-3.29 |
8.2-9.2 |
Seattle |
|
24 |
3.28-3.29 |
8.2-9.2 |
Seattle |
|
25 |
3.28-3.29 |
8.2-9.2 |
Seattle |
|
26 |
3.28-3.32 |
8.19-9.5 |
Seattle |
|
27 |
3.28-3.32 |
8.19-9.5 |
Seattle |
|
28 |
1.37-3.2 |
9.49-9.63 |
Seattle |
|
29 |
1.37-3.2 |
9.49-9.63 |
Seattle |
|
30 |
0.85-1.11 |
7.94-8.51 |
Seattle |
|
31 |
0.85-1.11 |
7.94-8.51 |
Seattle |
|
32 |
0.85-1.11 |
7.94-8.51 |
Seattle |
|
33 |
2.27-3.03 |
2.4-2.71 |
WB City |
|
34 |
2.27-3.03 |
2.4-2.71 |
WB City |
|
35 |
2.55-3.27 |
2.0-2.78 |
University of Washington |
|
36 |
2.55-3.27 |
2.0-2.78 |
University of Washington |
|
37 |
2.55-3.27 |
2.0-2.78 |
University of Washington |
|
38 |
1.46-2.94 |
4.77-6.14 |
WB City |
|
39 |
3.38 |
4.73 |
Maple Leaf Reservoir |
|
40 |
3.38 |
4.73 |
Maple Leaf Reservoir |
|
41 |
2.99 |
5.60 |
Maple Leaf Reservoir |
|
42 |
2.04-4.33 |
4.27-6.56 |
Maple Leaf Reservoir |
|
43 |
2.00-2.16 |
2.49-2.99 |
Station 20 (City of Seattle) |
|
44 |
2.00-2.16 |
2.49-2.99 |
Station 20 (City of Seattle) |
|
45 |
2.06 |
3.17 |
Station 20 (City of Seattle) |
|
46 |
1.25-1.88 |
2.98-2.85 |
Station 20 (City of Seattle) |
|
47 |
5.07-5.91 |
2.91-3.05 |
Station 14 (City of Seattle) |
|
48 |
1.71-5.91 |
2.71-3.05 |
Station 14 (City of Seattle) |
|
49 |
1.42-4.45 |
2.41-2.74 |
Station 10 (City of Seattle) |
|
50 |
1.34-5.34 |
2.37-2.70 |
Station 20 (City of Seattle) |
|
51 |
5.07-5.91 |
2.91-3.05 |
Station 14 (City of Seattle) |
|
52 |
1.71-5.91 |
2.71-3.05 |
Station 14 (City of Seattle) |
|
53 |
4.52 |
2.86 |
Station 8 (City of Seattle) |
|
54 |
1.41-4.84 |
2.12-2.41 |
Station 11 (City of Seattle) |
|
55 |
- |
- |
- |
|
56 |
4.86 |
2.80 |
Station 4 (City of Seattle) |
|
57 |
4.03 |
0.62 |
Station 14 (City of Seattle) |
|
58 |
4.3-4.8 |
.62-.66 |
SeaTac AP |
|
59 |
2.30-3.92 |
0.74 |
Station 20 (City of Seattle) |
|
60 |
2.44-4.09 |
.55-.56 |
Station 4 (City of Seattle) |
|
61 |
3.02 (City 2) |
1.65 (City 2) |
Station 2 (City of Seattle) |
|
62 |
3.02-3.55 |
2.05-2.72 |
Station 10 (City of Seattle); SeaTac AP |
|
63 |
2.89-3.25 |
1.66-1.93 |
Station 3 (City of Seattle); Sand Point |
|
64 |
0.0-3.26 |
1.2-1.33 |
Sand Point (adjusted)3 |
|
65 |
- |
- |
- |
|
66 |
2.12-3.44 |
1.27-1.54 |
Urban Site (adjusted)3 |
|
67 |
2.12-3.44 |
1.27-1.54 |
Urban Site (adjusted)3 |
Table 2 cont’d
|
68 |
2.12-3.44 |
1.27-1.54 |
Urban Site (adjusted)3 |
|
69 |
2.12-3.44 |
1.27-1.54 |
Urban Site (adjusted)3 |
|
70 |
2.12-3.44 |
1.27-1.54 |
Urban Site (adjusted)3 |
|
71 |
2.12-3.44 |
1.27-1.54 |
Urban Site (adjusted)3 |
|
72 |
3.44-4.28 |
1.27-2.07 |
Urban Site (adjusted)3 |
|
73 |
3.44-4.28 |
1.27-2.07 |
Urban Site (adjusted)3 |
|
74 |
3.44-4.28 |
1.27-2.07 |
Urban Site (adjusted)3 |
|
75 |
3.44-4.28 |
1.27-2.07 |
Urban Site (adjusted)3 |
|
76 |
3.44-4.28 |
1.27-2.07 |
Urban Site (adjusted)3 |
|
77 |
3.44-4.28 |
1.27-2.07 |
Urban Site (adjusted)3 |
|
78 |
3.44-4.28 |
1.27-2.07 |
Urban Site (adjusted)3 |
|
79 |
4.28-4.36 |
2.07-3.37 |
Urban Site (adjusted)3 |
|
80 |
2.3 |
3.37-4.69 |
Station 1 (City of Seattle); Urban Site (adjusted)3 |
|
81 |
2.59 |
3.37-4.69 |
Station 20 (City of Seattle); Urban Site (adjusted)3 |
|
82 |
0.88-0.90 |
4.69-6.33 |
Station 14 (City of Seattle); Urban Site (adjusted)3 |
|
83 |
1.51-2.74 |
2.99-3.78 |
Station 14 (City of Seattle) |
|
84 |
1.85-3.26 |
3.07-2.87 |
Station 12 (City of Seattle) |
|
85 |
1.97-2.59 |
2.10-2.26 |
Station 20 (City of Seattle) |
|
86 |
3.05 |
2.52 |
Station 11 (City of Seattle) |
|
87 |
3.76 |
3.51 |
Station 14 (City of Seattle) |
|
88 |
2.57 |
3.55 |
Station 20 (City of Seattle) |
|
89 |
3.75 |
2.29 |
Station 11 (City of Seattle) |
|
90 |
3.41 |
2.79 |
Station 12 (City of Seattle) |
|
91 |
3.63-3.87 |
2.45-2.55 |
Station 12 (City of Seattle) |
1
See Table 1 for location, time of occurrence, and source of landslide information
2 1 inch = 25.4 millimeters
3 See discussion in text
Table 4. Air-temperature data for landslide days.1
|
Landslide day no. |
Date |
Daily Air Temperature |
Source Station |
||||
|
Maximum |
Minimum |
Average |
|||||
|
1 |
12/11/33 |
56 |
51 |
54 |
Seattle |
||
|
2 |
12/17/33 |
51 |
37 |
44 |
Seattle |
||
|
3 |
12/18/33 |
48 |
39 |
44 |
Seattle |
||
|
4 |
12/20/33 |
54 |
41 |
48 |
Seattle |
||
|
5 |
12/21/33 |
57 |
38 |
48 |
Seattle |
||
|
6 |
12/22/33 |
53 |
47 |
50 |
Seattle |
||
|
7 |
12/23/33 |
47 |
37 |
42 |
Seattle |
||
|
8 |
12/29/33 |
52 |
45 |
48 |
Seattle |
||
|
9 |
3/3/50 |
56 |
45 |
51 |
WB City |
||
|
10 |
3/4/50 |
49 |
42 |
46 |
U of W |
||
|
11 |
3/5/50 |
49 |
42 |
46 |
U of W |
||
|
12 |
3/6/50 |
49 |
42 |
46 |
U of W |
||
|
13 |
1/4/56 |
50 |
39 |
45 |
WB City |
||
|
14 |
1/5/56 |
48 |
34 |
41 |
Maple Leaf Res. |
||
|
15 |
1/6/56 |
52 |
35 |
44 |
Maple Leaf Res. |
||
|
16 |
12/10/83 |
50 |
42 |
46 |
Urban Site |
||
|
17 |
12/11/83 |
48 |
40 |
44 |
Urban Site |
||
|
18 |
12/12/83 |
48 |
39 |
44 |
Urban Site |
||
|
19 |
1/18/86 |
55 |
40 |
48 |
Jackson Park |
||
|
20 |
1/19/86 |
55 |
40 |
48 |
Jackson Park |
||
|
21 |
4/5/91 |
51 |
46 |
49 |
Urban Site |
||
|
22 |
2/8/96 |
56 |
46 |
51 |
Sand Point |
||
|
23 |
2/9/96 |
50 |
37 |
44 |
Sand Point |
||
|
24 |
12/29/96 |
49 |
38 |
44 |
Sand Point |
||
|
25 |
12/31/96 |
56 |
43 |
50 |
Urban Site |
||
|
26 |
1/1/97 |
56 |
46 |
51 |
Urban Site |
||
|
27 |
1/2/97 |
53 |
43 |
48 |
Urban Site |
||
|
28 |
1/3/97 |
55 |
42 |
49 |
Sand Point |
||
|
29 |
1/4/97 |
43 |
39 |
41 |
Urban Site |
||
|
30 |
3/18/97 |
56 |
51 |
54 |
Urban Site |
||
|
31 |
3/19/97 |
56 |
51 |
54 |
Urban Site |
||
| AccessibilityFOIAPrivacyPolicies and Notices | |
| |
|