
Digital Mapping Techniques '01 -- Workshop Proceedings
U.S. Geological Survey Open-File Report 01-223
Removing Science Workflow Barriers to Adoption of Digital Geological Mapping by Using the
GeoMapper Universal Program and Visual User Interface
By George H. Brimhall and Abel Vanegas
University of California, Berkeley
Earth Resources Center Digital Mapping Lab
Department of Earth and Planetary Science
307 McCone Hall
Berkeley, CA 94720-4767
Telephone: (510) 642-5868
Fax: (510) 643-8443
e-mail: brimhall@socrates.berkeley.edu
INTRODUCTION
Currently, digital mapping technology is evolving rapidly through a challenging transitional period between lingering use of paper and conversion to promising digital media and electronic mapping methods. Until recently, digital mapping has referred to various facets of this transitional phase in terms of technology: cataloging existing maps in digital form for retrieval (Soller et al, 2000), devising a lexicon of geological names (Stamm et al, 2000), GIS information management (Brodaric, 2000), cartographic symbolization (Soller and Lindquist, 2000), production of final maps after scanning paper based maps (Stanford and MacKubbin, 2000), compilation and digitization (Furr, 2000), retrieving information using GIS (Fryer et al, 2000) and visualization (Morin, 2000). Progress has been faster in developing digital technology to support office map production than in actual mapping in the field. Our work is an effort to help close the gap between the promise and productivity of digital mapping.
The status of field data collection using digital mapping systems as opposed to digitization of paper maps, was summarized by Kramer (2000) including our progress developing GeoMapper within the Earth Resources Center of the University of California, Berkeley (ERC) (Brimhall, 1998, 1999, 2000; Brimhall and Vanegas, 2000, 2001; Vanegas et al, 2000 ). GeoMapper in this earlier phase of development was a pen-based system for making geological maps in the field using Strata Software's PenMap as a digitizing tablet to create macro buttons expressing the basic geological symbols for structures, contacts, and colored area fills. By creating new maps directly in digital form in the field using GeoMapper to support digital tools, many of the aforementioned time consuming steps that are a byproduct of the transitional phase between traditional paper-based media and digital electronic form could be circumvented. At that point in time more than a year ago, customization of the GeoMapper mapping legend to accommodate a user's local geology (stratigraphy, mineralization, alteration and sample types) required a thorough knowledge of the entire PenMap macro file programming module suite (PenMap3, Formgen, PmwCustomizer and RastMap). Attainment of this level of programming proficiency requires both an investment of time of many months and a technical background in programming quite uncommon for many practicing field geologists. Hence, constructing a mapping legend for each new project area was a major undertaking impossible without programming skills and a considerable investment in time. Nevertheless, working in the ERC Digital mapping lab we completed GeoMapper mapping legends and mapping systems for the Western Mining Corporation (WMC) of Australia, Placer Dome Exploration for their Getchell Mine in Nevada, Codelco, Chile for their Chuquicamata mine, and for introductory and advanced field geology classes of the Department of Earth and Planetary Sciences, University of California Berkeley. We now are in our third year of digital mapping at UC Berkeley. The GeoMapper systems were tested, refined and improved through their use in both surface and underground geological mapping and function well over small to large scale maps in a wide spectrum of geological environments. GeoMapper has also been used in the ERC in support of abandoned mine characterization using hyperspectral visible light/infrared methods supported by real-time GPS and laser positioning (Montero-Sanchez and Brimhall, 1998, 2000; Montero-Shanchez et al, 1999; Takagi and Brimhall, 2000).
BARRIERS TO ACCEPTANCE OF DIGITAL TECHNOLOGY
These ERC digital mapping research and development projects provided much knowledge about the nature of the modern mapping discipline in academia and industry. Especially revealing aspects have been desirable features and the breadth of technical demands on the systems covering a spectrum from new mappers in the field mapping classes to experienced professionals. Especially important is (1) the need to find ways to engage users whose backgrounds in computing is limited although they may be excellent experienced mappers. This work also revealed (2) a number of distinct barriers to acceptance of digital mapping that are surprisingly similar to those recognized for acceptance of mobile computing in the healthcare industry in daily practice (Stetson, 2001). Acknowledgement and resolution of shortcomings is essential to advancement and acceptance of new technology.
Learning From Medicine
In healthcare, medical professionals (doctors and nurses) point out that slowness to accept pen computer-based systems is due to (1) cost, (2) cross vendor incompatibility, (3) office workflow disruption and (4) slowness and complexity of data entry. In a hospital, time is at an absolute premium. Any system that slows down a clinician is unacceptable. Stetson (2001) points out that medical software does seem designed to meet well-known office administrative requirements such as medical forms, but then ignores the bedside and laboratory clinical requirements of how doctors do their work with patients. Clinicians prefer digital systems that, in addition to administrative needs, meet their own workflow preferences as practitioners so that digital tools are both familiar enough and simple enough for personnel to quickly grasp and use confidently while performing their jobs.
Learning From Mapping Experience
Geological mapping has many similarities to medical practice both in terms of technical issues in map production in the office and performance in the field. Highly-trained scientists and engineers conduct their professional discipline by actively seeking information, making instantaneous interpretations and decisions. Contrary to common perceptions, the gravity of the interpretation by field mappers is often no less than in medicine. Our scientific conclusions often can affect the lives of numerous people and the efficacy of financial investment in the billions of dollars as in construction, water resource management, mining, environmental applications and emergency intervention and planning for natural hazards like earthquakes, floods and landslides. Consequently, a digital mapping system must meet the workflow needs of this user group if they are to work with confidence and facility and to supply vitally-important geo-spatial information and interpretations. Software systems designed largely for the office environment of map production cannot do this effectively. Finally, since mapping addresses three dimensional exposures, existing mapping systems that support only mapping in plan view leave a large gap in required mapping capabilities.
THE PROMISE OF DIGITAL MAPPING
If proven to be practical, economical and flexible in terms of mapping in plan or section, portable integrated field mapping systems supported by GPS, lasers and digital cameras could soon become commonplace not only for mapping on land, but underground, from the air, on the sea bed, and ultimately in space on other planetary surfaces. Resource sustainability on a global basis has become an imperative societal goal making geo-spatial phenomena the central scientific infrastructure. However, for digital mapping to realize its potential to serve these needs as a truly enabling generative technology worthy of becoming widely adopted and ultimately replacing the traditional paper methods while creating valuable new knowledge about the earth, a significant challenge remains to be overcome in software design and functionality as it does in medicine. The present limitations are surprisingly similar and stem from not fully acknowledging the scientific needs of practitioners, especially as being distinct from technological needs alone. We need to manage new technologies more effectively in doing science. Here we address only the issue of workflow and throughput, and view the remaining problems of cost and vendor incompatibility as being dependent upon the digital mapping systems first proving to be useful before they become commonplace.
The Different Challenges of Science and Technology
Science and technology are alternative perspectives of knowledge and especially of use of instrumentation. Science seeks a deep understanding of natural phenomena while technology uses advanced technical means to serve human ends. A geological map is fundamentally an information-rich scientific document although it is produced technically. Digital mapping technology is rightly concerned with technical issues, yet another important dimension of the map is its scientific knowledge. This scientific knowledge is created by a highly-trained scientist with needs in the field quite distinct from those of office personnel who produce the map and deal with data base management. In some organizations, the mapper and map producer are one in the same individual. Recalling space exploration, man is the "most extraordinary computer of them all �(whose) judgement, nerve and � (ability to) learn from experience still make him unique" among instruments (John F. Kennedy in Sorensen, 1965). In advancing GeoMapper, we have viewed our challenge then to be in constructing a software architecture that above all else enables the scientific mission in the field and provides a compatibility with subsequent map production needs so the two activities become mutually supportive.
We perceive two main challenges in mapping software design. The first is creation of an effective visual user interface to manage mapping tools, graphics and files for local geology in such a way that the system being used actually feels to a geologist like normal mapping and produces professional quality maps at a rate sufficient to make the system cost effective by eliminating unnecessary paper media steps. Secondly, the software also needs to offer a practical means of incorporating the essential stratigraphic and lithological features of a wide range of geological terranes so that each geologists can begin new projects without delay using a newly-created and appropriate legend. With respect to both challenges, it is impractical to require users to know even macro language programming to create a usable visual interface for their work. The visual user interface constitutes the entirety of the link between their professional scientific skills and the new digital tools at their disposal. With this interface they confront the realities of nature to be mapped; therefore it must be familiar, comprehensive, easy to use and easy to personalize to local setting otherwise it is a formidable barrier.
GEOMAPPER UNIVERSAL
It is essential to realize that when we geologists map, we are in fact practicing our scientific discipline in the field through observation, exercising reasoning and using the scientific tools intrinsic to geology. A visual user interface must provide much more than graphic tools like points, lines and areas, colors and data bases in a generic visual user interface. The term "user friendly" does not convey much of the requirement as it does not inform one of what is really necessary to provide utility. Here we present our recent advances in designing the second generation of GeoMapper (GeoMapper Universal) with totally new visual user interfaces for a geologist to readily personalize the mapping legend for local geology on a project basis, learn the mapping system and readily conduct digital geological mapping using the scientific methods of field geology (Brimhall and Vanegas, 2001) including mapping in section view. Unless digital mapping capabilities meet both technological and scientific requirements of field geology as it is practiced today and are robust and easy to use, adoption will come only slowly after each barrier to use is removed. Present mapping capabilities with traditional methods are immensely powerful and the tools are simple and inexpensive. Traditionally, a geologist carries a map board with colored pencils, paper maps, a compass and scales. This tool box is quite similar to that of a doctor or a nurse. By practical necessity, the tools in both cases have evolved to the point of near perfection for what they present: an inexpensive, portable, light weight paper-based medium proven by the test of time to offer the essential information of science at the lowest cost.
EVOLUTION OF MAPPING AS THE SCIENTIFIC BASIS OF GEOLOGY
Mapping using paper media has been a core discipline of professional geology in the U.S. for a century in federal and state agencies, industry and academic training. Interaction between these groups has proven mutually beneficial to advancing mapping techniques and science. The traditions have been proven globally in all types of field conditions, varied geology, and project scope from rapid reconnaissance to detailed mine mapping at a variety of scales. Mapping has evolved considerably from scientific support of mining by the U.S. Geological Survey (Lindgren and Turner, 1894, 1895) which set an international standard of excellence in surface mapping, color folio map production, cross sections and general scientific interpretive utility. Industrial geologists, initially in the Anaconda Company in Butte Montana, developed standardized mapping procedures for underground mines forming the basis of compilation of plan level maps, serial cross sections and three dimensional geological models used in exploration, development and resolution of vein apex mining law litigation (Brunton, 1901; Linforth, 1914; Sales, 1929, 1941; McLaughlin and Sales, 1933; McKinstry, 1948). To prepare students for this growing geological field, systematic field mapping classes for undergraduate students were instituted in the US and Canada; one of the first in 1892 at the University of California, Berkeley by Professor Andrew Lawson. Over the next half century, training in surface mapping evolved (Derry, 1947) and remains a requirement in the curricula of most earth science programs including intensive summer field training. Three kinds of information uniquely accessed in the field are addressed: direct observation and measurement, age relations and interpretation (Compton, 1985). Field camps still provide the systematic training of young geologists to address district scale investigations. Map compilations by the AAPG on a continental scale (Derry, 1980) especially correlation by lithotectonic units, age of the sea floor and orogenesis (Muelberger, 1996) provide the basis for crustal evolution models, ocean basin dynamics, metallogenic provinces, and energy resource appraisal. This evolution in mapping and ever-increasing use of maps in earth sciences, means that the challenges facing digital mapping are considerable and demand an exacting set of standards of digital systems, flexibility, and immediate adaptability. Digital mapping cannot compromise these professional standards and succeed.
What We Do in the Field and How We Map
To offer more than a generic graphical tool pad with device drivers for pen input and control of electronic instrumentation, it is essential to design a geological user interface around the practical needs of earth scientists and engineers to map field relationships and to produce finished maps and data bases as part of our workflow. Fundamentally, all mapping is a reasoned abstraction; a simplified scaled rendering and projection of complex reality made visible through observation on the small scale of exposures which are mapped on larger scales onto a chosen plane of projection as a representation. We reduce four dimensional space-time to a two dimensional plane with line, area and symbol attributes to convey time. Orientation and numerical data are related to symbols. How and what we map are determined by our purpose, map scale and time frame. In adapting digital tools for mapping, there are advantages in retaining traditions in so far as they remain useful and provide familiarity and continuity that aid learning a new digital system.
Interactive Feedback in a Continuum of Geo-spatial Activity
In the process of developing GeoMapper to implement mapping in a style even approaching the practicality and level of excellence developed over the twentieth century, one is forced to confront the profound complexity of what we geologists actually do in the field and call "geological mapping." Geological mapping is the practice of systematically delineating, classifying and recording a complex variety of natural geological features in an organized and disciplined fashion and applying the scientific method of hypothesis testing using graphical relationships. The body of necessary knowledge is immense. Cognition and spatial problem solving is an on-going part of mapping which is then, intrinsically, a real-time process. Through the process of mapping, new insights continuously emerge from the map patterns which provide guidance as to what features to map next, which direction to go next, and which multiple working hypotheses to entertain until one proves superior to the others. Hence, geological mapping is an interactive, real-time scientific discipline which accommodates identification of complicated geospatial and temporal features, flexibility in interpretation, error assessment in making interpretations, and managing unforeseen complexity in the earth as it unfolds on a developing map.
The Mapping Continuum and the Visual User Interface
Translated into a digital formalism, mapping proves to be a great deal more than what is often referred to in the digital media world as "field data capture, 3-D modeling, GIS analysis, data base management or visualization." Mapping is, in practice, all of these processes undertaken together simultaneously in real-time outdoors or underground immersed in nature. Mapping is not a sequence of discrete point measurements although to non-geologists it may appear so. Instead, mapping is a continuum of activities requiring one to keep oriented, located, and continually aware of their lithological and structural environment. In the transition from paper to digital records, digital mapping has been to some extent disintegrated into separate component parts so that each component can take advantage of a specific digital tool; some in the office and others in the field. In making a digital mapping field system however, all the parts need to function together in harmony and be readily accessed and implemented in the routine that mappers deem convenient and essential to workflow and throughput. The problem is that while technological adaptation and substitution can mimic and replace certain traditional mapping procedures, we need to reintegrate the component parts of the new digital technology around the actual activities of the scientist in the field using the visual user interface and pen stylus as the sole control. Our focus has been on finding the most direct means of mapping using digital technology with as few interruptions and departures from how we normally map.
Digitizing Tools
GeoMapper uses a variety of digital tools including Strata Software's PenMap as a digital graphical tool implementing powerful components of mapping in the style of an "electronic plane table." In computer usage these tools are points, lines, symbols and areal pattern and color attributes which are located graphically as geo-spatial features. Through the GeoMapper visual user interface we organize such raw graphic tools and file structures into a geological formalisms such as lithology, formations, structures etc. Device drivers for using digital GPS and laser equipment in surveying are also an integral part of the PenMap tool package.
GEOMAPPER UNIVERSAL'S ARCHITECTURE
GeoMapper uses several computer programs to execute the mapping process in a manner consistent with established procedures, preferred work sequences and efficiency sufficient as to be considered practical. Since the earth is complex and geology enormously varied, organization is the critical issue to rapid startup, workflow, compilation, data management and map production. GeoMapper Universal provides users a range of organizational features which (1) simplify personalization for local geology around a project orientation, (2) implement geological mapping in either plan and arbitrary section views, (3) separate common mapping activities used most frequently from those that are used only occasionally, and (4) export and manage data files.
Project Manager
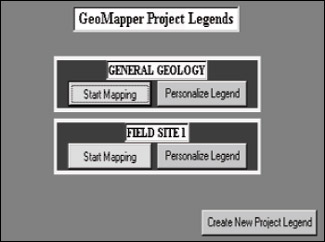
The GeoMapper visual user interface is logical and largely self explanatory from the standpoint of a geologist. The first activity in starting a new mapping project is to investigate and define the local geological stratigraphic column. Once a digital mapping legend is created, a user does not need to go back though this step whenever they start a new days' mapping. Hence, we have combined these two steps into a single Project Manager startup screen in GeoMapper Universal (figure 1). The screen shows the names of the Projects, here as "general geology." By clicking on Create a New Project Legend, a new project title can be added to the list and selected at will from all those created. Then click either on Start Mapping or Personalize Legend to proceed.
|
|
Figure 1. Project Manager is the first computer screen of GeoMapper Universal. With it, one elects to either make a new mapping legend or start mapping.
|
Legend Maker
The stratigraphic section in an area of interest is the geologist's link with time and process and defines the units to be mapped. In any region of the U.S., the local stratigraphic section can be easily downloaded digitally or retrieved conventionally from the Correlation of Stratigraphic Units of North America (COSUNA) (Childs and Salvador, 1985) from the AAPG Bookstore. To create such a legend in GeoMapper we use Legend Maker which is implemented when one clicks on Personalize Legend in the Project Manager (figure 2). To personalize the legend a user simply needs to use point and click skills to effect changes in the design of the formation and lithology buttons, select their area fill patterns and/or colors, and type-in their descriptive names. Typically this process takes less than an hour. A hard copy of the legend can be printed. This Legend Maker feature of GeoMapper removes the most serious barrier to using digital mapping: that of readiness to map.
Figure 2. Legend Maker is shown here, partially completed by a user. This is where the local geology of a project is entered in terms of lithology, formations and age sequence, using only point and click methods. The Formation buttons use the standard geological time scale symbolism with Epoch or Period in caps and subscript initials for the formation name. The Lithology buttons show the pattern used for that rock type.
|
Start Mapping
Once the geological legend has been made, one clicks on Start Mapping on the Project Manager window (figure 1). From this point on, GeoMapper's visual user interface shows arrays of buttons arranged so as to provide a logical, self-explanatory set of features used in mapping.
Button Tool Bars
Tool bars are arrays of buttons which can be touched by the pen stylus to implement mapping steps. A combination of color coding, grouping, sequential ordering, and button design make it possible to begin mapping in a very short time, often less than a few hours. The organization of the visual interfaces is designed around the requirements of mapping practice. The structure of the files created within project areas is consistent with extraction of information to solve real geological problems. Immediate results are accomplished by provision of user protocols offering the basic geological formalisms organized into like features: lithology, structure, formations, mineralization, alteration and sampling sites that collectively constitute the essential and complex geo-spatial and temporal features contained in geological maps. Toolbars increase the speed of mapping considerably.
Logic behind Color-Coded Button Mapping
GeoMapper's architecture implements mapping tools with buttons, in contrast to pull-down menus which can interrupt the thought process of mapping and leave you stranded as to what to do next. GeoMapper includes only the commands necessary for preparing a map file in which mapping can be accomplished with the variety of mapping tools expected in geology. Furthermore, the buttons are shown in the general sequence of their use so that scientific logic guides the selection of mapping tools. Button color-coding facilitates eye and hand coordination when selecting frequently used buttons from a feature group or to point out important buttons in a sequence group. We use a stop light method with green, yellow and red phases of activity. Green buttons refer to the most commonly used buttons in geological mapping. Yellow buttons refer to procedures that are used only rarely, for example if you need to erase or undo the last work. Red buttons refer to procedures that are essential to do before you stop mapping, for example saving your files or doing export of critical files. Other colors refer to special use functions. Light blue buttons refer to a sequence of steps to map base maps. These buttons are used only once in a project. Purple buttons group instruments like GPS and lasers into setup buttons to select the instruments, and turn them on and finally turn them off. Magenta buttons manage section view mapping functions and all algebraic transformations done in GeoMapper.
Button Mapping Starting With the Master Toolbar
GeoMapper tool bars contain both the geological features needed to map the earth as well as a visual interface to use all the digital electronic equipment a user selects. The first tool bar which appears, Master Toolbar, manages maps and instruments, and the taking of rock, soil, and water samples and infrared spectra (figure 3). In the GeoMapper button interface shown, referenced to numbered buttons in parentheses, a mapper begins using the buttons located in the upper left corner and proceeds across this row towards the right and eventually onto the second row. In support of the sequence logic, features that are essential to a mapping project including data entry are color-coded with green buttons. The save and exit features are colored red as they are crucial steps when working with digital map files and must be implemented before exiting. The most frequently used buttons from the editing and zooming feature groups are color-coded yellow. The base map preparation sequence group of buttons are color coded-cyan, and the instrument communications group (GPS and Laser) is colored magenta. The initial map file preparation runs through a sequence of buttons beginning with opening up a map file (1); loading the mapping legend (configuration) (2); compiling and selecting base maps and setting their display parameters such as using a digital topographic base map either with or with an ortho-photo show (3-7); loading survey points (8); setting the automatic saving timer (9); setting the mapping units (meters or feet), projection types, and datum for the GPS (10-11); turning off previous methods of input (12); plotting a survey point (13); turning off the survey point graphic (14); using the laser range finder (15-16) and the magnetic declination correction use laser back site correction (17) to set the declination on the laser, then mapping a ground line with the laser (18); plotting the survey tape (19) and the scale bar (20) for scale orientation; and, setting the display screen parameters (21).
Figure 3. Master Toolbar: Numbered buttons are; 1- Open Map file, 2- Load a Legend Toolbar (configuration), 3- Compile Maps , 4- Load DXF file (vector graphics), 5- Make Base Map (vector base map made out of loaded vector graphics), 6- Select Base Map, 7- Set Base Map Options, 8- Load Survey Points, 9- Set AutoSave timer, 10- Select GPS, 11- Start GPS, 12- Methods of Input Off, 13- Survey Point, 14- Survey Graphics Off, 15- Set LASER, 16- Start LASER, 17- ID Angle correction for LASER, 18- Map Ground Line w/ LASER, 19- Plot Survey Tape, 20- Plot Map Scale, 21- Set Map Display Options, 22- Paint Buttons Utility, 23- Layers Tool box, 24- Set GIS Table Options and Area Fills (transparency), 25- Set Symbols (default size and orientation), 26- GIS Table (Form Generator) Utility, 27- Set DTM Parameters, 28- GeoMapper Tools Toolbar, 29- Lithology Toolbar, 30- Structure Toolbar, 31- Formations Toolbar, 32- Mineralization Toolbar, 33- Alteration Toolbar, 34- Snap node for instrument method of input, 35- Free node for pen method of input, 36- Type-in coordinate data method of input, 37- Undo/Redo graphics input, 38- Erase graphics (drag a polygon to select graphic nodes), 39- Erase symbols, 40- Move individual polyline nodes, 41- Move individual polyline nodes, snapping onto other nodes, 42- Move, rotate, or resize symbols, 43- Edit the elevations (drag a polygon to select graphic nodes), 44- Redraw the map graphics, 45- Pan the map , 46- Zoom Utility box, 47- Zoom in/out to the previous view, 48- Zoom out by five, 49- Zoom out to show all of the map, 50- Plot Rock Sample, 51- Plot Soil Sample, 52- Plot Water Sample, 53- Plot Infra-Red Sample, 54- Plot Notes reference, 55- Plot Point graphic , 56- Plot Polyline graphic, 57- Plot Text graphic w/ settings , 58- Save Map file and Legend changes, 59- Export Map for Compilation, 60- Setup Printer and Paper size, 61- Print Map file, 62- Exit Map file.
|
From this point, the mapper can then proceed directly to the second row and use the Lithology (29), Structure (30), Formation (31), Mineralization (32), and Alteration (33) buttons to open their respective mapping tools as needed. When the Lithology (29), Structure (30), Formation (31), Mineralization (32), and Alteration (33) buttons are touched by the pen stylus, each expand to show their own tool bars. Use of sequential tool bars reduces the amount of computer screen display used up by the legend and maximizes the area of the map.
Lithology Toolbar
Lithologies can be mapped either as lines with different styles or as patterned infills. Clicking on the Lithology button causes 20 Lithology (1, 2, �. 20) buttons to show on the right of the Area button as area fills and 10 of those Lithologies (1, 2, �10) that can be mapped as lines found to the right of the Line button (figure 4). The buttons are arranged in an age sequence that decreases as you move to the right on the toolbar. Button number 1 is marble, 2 is quartzite, 3 is serpentinite, 4 is peridotite, 5 is gabbro, 6 is granite, 7 is porphyry, 8 is diorite, 9 is tuff, and 10 is schist before any personalization. The lithological patterns programmed follow Compton (1985). The Lithology toolbar also contains the basic structural features of contacts and strike and dip so that a mapper needn't change tool bars while doing the most basic mapping activities. This saves time.
Figure 4. Lithology Toolbar shows the local rock types in an area, in age sequence. Lithologies can be mapped either using a line style or areas filled with patterns. Buttons are changed automatically by a user when they use Legend Maker.
|
Structure Toolbar
Clicking on the Structure button brings up a full set of structural symbols given in both azimuthal and down-dip methods (shown with a D) (figure 5). When a symbol is selected, the mapper enters azimuthal and dip data. The program then plots the symbol in its correct orientation automatically. Contacts are shown in black, faults in blue, veins in red and fold axes in black. Dashed lines represent uncertain positions of these features. Different thickness of faults and veins are given as separate buttons. Structural symbols include contacts, faults (normal, thrust), strike and dip, horizontal beds, vertical beds, cleavage, foliation, trend and plunge, plunging anticline, and plunging syncline.
Figure 5. Structure Toolbar shows the common structural symbols used in mapping.
|
Formations Toolbar
The Formation button causes 20 Formations (1, 2, . . ., 20) buttons to appear (figure 6). The buttons are arranged in sequence of age with the youngest on the right end of the toolbar buttons. Formation color infills are often completed in the office by snapping onto the nodes along contacts. This makes a sharp demarcation of color on both sides of the contact line with no gap. Coloration of the entire map by formation using this toolbar creates the most visible attributes of completed geological maps.
Figure 6. Formation Toolbar shows the local rock formations in an area in age sequence. Buttons are changed automatically by a user when they use Legend Maker.
|
Mineralization Toolbar
The Mineralization button brings up a suite of oxide and sulfide facies mineral symbols that are used with the four mineralization style buttons representing dissemination, veinlets, stockworks and breccias (figure 7). Oxides facies minerals include calcite, quartz, limonite, hematite, goethite, cuprite, tenorite, pyrophyllite, and kaolinite. Sulfide facies minerals include galena, sphalerite, tenantite, pryrite, bornite, chalcocite, chalcopyrite, covellite, digenite, enargite, molybdenite, and anhydrite. These features are customizable.
Figure 7. Mineralization Toolbar shows common ore minerals and mineralization styles.
|
Alteration Toolbar
The Alteration button brings up two sets of buttons for Propylitic, Argillic, Potassic, Sericitic, Advanced Argillic, Silicification, Garnetization, and Carbonation facies of hydrothermal alteration (figure 8). The first set, is used to map alteration as a color-coded line and the second set is used if you prefer to map alteration as a color-coded area. These features are customizable.
Figure 8. Alteration Toolbar shows the most common types of wall rock alteration.
|
GeoMapper Tools Toolbar
This tool bar opens up the final set of buttons shown in figure 9 in magenta to map in geology in section view, for example when mapping the side walls in mines or exposed cliff faces, or road cuts in any orientation besides plan view. This type of mapping is usually done using a digital photograph as the base map so our mapping tools can be used to trace contacts and add infill patterns. With the laser set up and located using the GPS for positioning and its declination corrected for local magnetic declination, the Capture Photograph button (1) can be used to download an image from a camera to register the direction of the photo, the date of the snap shot, and a description. The next button is the Field GeoRef Points button (2) which opens an instruction window for geo-referencing the photo in the field using the Laser. The Plan Map View button (3) will guide you in transforming (4) the field geo-reference points which are imported by the GeoReference Image button to create a section view georeference. The Raster BaseMap Utility button (5) will use the section view geo-reference points to create a base map of the image. Finally a section view frame (6) is defined around the image base map by following the instructions of the Section View Frame button.
Figure 9. Tool Toolbar contains special features such as those necessary for mapping in section and exporting completed maps and numerical data bases.
|
Section Mapping Algorithm
Although we typically map in horizontal plan view in GeoMapper, we can map in any arbitrary section by user matrix algebraic transformations that we have coded in Visual Basic. This is done by taking a digital photograph of the inclined surface you wish to map and measuring the orientation of the inclined surface (figure 10). A laser is used to locate georeferencing points on the photo. Using rotation matrices, we rotate the plane of the photo into horizontality where we map as though it was inclined using the full geological legend. When the mapping is complete, we simply undo the rotation by another matrix transformation and restore the section to its proper position, bringing with it the geology and all three-dimensional data such as contacts, symbols, and color infills.
|
|
|
|
Figure 10. Geometry of the section mapping algorithm used in GeoMapper Universal, as accessed from the Tool Toolbar.
|
Scientific Logic and Uncertainties
As in mapping with traditional paper and pencil media, GeoMapper has been designed to implement the fundamental guidelines of the scientific method including rigorous separation of fact and interpretation by showing uncertainty. This is done by modulating line character from being solid where contacts are well-located and dashed where they are inferred. The outline of outcrops can also be mapped separately from a color infill which covers the entire area underlain by a given formation. This is a powerful and novel feature of GeoMapper as the outcrops record the primacy of the data on which interpretations are based.
Map Scale and Spatial Resolution
We have constructed scale bar symbols which can be placed anywhere on a map when needed. By mapping small-scale data-rich features like outcrops separately from the overall formations, a map may be drawn at any scale appropriate for a question at hand. When one zooms out, those features may be too small to see at a broader scale, but they are preserved and can be shown on a detailed scale by zooming back in.
Map Compilation and Bi-directional Data Transfer
Digital mapping creates new scientific knowledge. The original map with its contacts modulated for the level of certainty, outcrops and color formation infills, represents this knowledge in its purest, primary form. Geographic Information Systems (GIS) can process primary data inputs created by mapping, and in so doing, are useful printing output, data storage, and interpretive tools. In that respect, GeoMapper Universal can be viewed as the front end of GIS systems. Compilation of maps as new map information is available can be done either within GeoMapper as a growing aggregate map file or exported as small sub-areal maps to GIS systems. GIS information can be ported into GeoMapper including base maps, ground lines, and survey point data.
REFERENCES
Brodaric, B., 2000, Digital geological Information: From the Field to the map to the Internet, in D.R. Soller, ed., Digital Mapping Techniques '00 - Workshop Proceedings: U.S. Geological Survey Open-File Report 00-325, p. 3-12, https://pubs.usgs.gov/openfile/of00-325/brodaric.html.
Brimhall, G.,1998, Direct digital field mapping using pen-based PC computers supported by differential global positioning systems and laser range finders: Geol. Soc. Amer. Abstracts with Programs, v. 30, no. 7, p. A-256.
Brimhall, G., 1999, Evaluation of digital mapping classes in introductory and advanced field classes at UC Berkeley: Geol. Soc. Amer. Abstracts with Programs, v. 32, no. 7, p. A-191.
Brimhall, G.H, 2000, The Earth Resources Center Digital Mapping Lab: University of California, Berkeley, http://socrates.berkeley.edu/~earthres/.
Brimhall G. and Vanegas, A., 2000, Digital mapping of geology and ore deposits with GeoMapper: Geol. Soc. Amer. Abstracts with Programs, v. 32, no. 7, p. A-514.
Brimhall, G. and Vanegas, 2001, Digital Mapping Using Pen PC Computers, Differential Mode GPS, Laser Range Finders and Digital Cameras: Geomapper User Manual, Earth Resources Center Digital Mapping Lab, University of California, Berkeley.
Brunton, D.W., 1901, Geological mine-maps and sections: Trans. Amer. Inst. Min. Engrs., v. 86, p. 508.
Childs, O.E. and Salvador, A., 1985, Correlation of Stratigraphic Units of North America (COSUNA): Amer. Assoc. of Petrol. Geologists, Bull., v. 69, p. 173-189, http://www.aapg.org/datasystems/LibraryPricing.html
Compton, R.R., 1985, Geology in the Field: John Wiley and Sons, New York, 398 pages.
Derry, D.R., 1947, Geological Mapping: Canadian Mining and Metallurgical Bulletin, v. 40, p. 682-688.
Derry, D.R., 1980, World Atlas of Geology and Mineral Deposits: Halsted Press, London, 110 pages.
Fryer, S., Gregson, J., Connors, T., Poole, A., and Heise, B., 2000, The National Park Service Digital Geologic map Model: Transformation from paper to Digital, Featuring legends, Cross sections, Map Notes, and Keyword Searchability, in D.R. Soller, ed., Digital Mapping Techniques '00 - Workshop Proceedings: U.S. Geological Survey, Open-File Report 00-325, p. 69-82, https://pubs.usgs.gov/openfile/of00-325/fryer.html.
Furr, T.W, 2000, Digital Geological Mapping for the State of Oklahoma, in D.R. Soller, ed., Digital Mapping Techniques '00 - Workshop Proceedings: U.S. Geological Survey, Open-File Report 00-325, p. 191-194, .
Johnson, K. and Brimhall, G., 1999, Novel real-time digital mapping method for caves as a supplement to speleothem based paleo-climate reconstruction: Geol. Soc. Amer. Abstracts with Programs, Cordilleran Section meeting, v. 31, no. 6, p. A-67.
Kramer, J.H., 2000, Digital Mapping Systems, in D.R. Soller, ed., Digital Mapping Techniques '00 - Workshop Proceedings: U.S. Geological Survey, Open-File Report 00-325, p. 13-19, https://pubs.usgs.gov/openfile/of00-325/kramer.html.
Lindgren, W. and Turner, H.W, 1894, Description of the gold belt; description of the Placerville sheet, California: U.S. Geological Survey, Geologic Atlas of the United States Folio GF-3.
Lindgren, W. and Turner, H.W., 1895, Description of the gold belt; description of the Smartsville sheet, California: U.S. Geological Survey, Geologic Atlas of the United States Folio GF- 18.
Linforth, F.A., 1914, Applied geology in the Butte mines: Trans. Amer. Inst. Min Engrs., v. 86, p. 508.
McLaughlin, D.H. and Sales, R.H., 1933, Utilization of geology by mining companies, in Ore deposits of the Western United States (Lindgren Volume), Amer. Inst. of Mining and Metallurgical Engineers, New York, p. 683-686.
Montero Sanchez, I., and Brimhall G., 1998, Novel application of digitally integrated mapping systems for the mineralogical characterization of abandoned mines: Geol. Soc. Amer. Abstracts with Programs, v. 30, no. 7, p. A-358.
Montero Sanchez, I., Brimhall, G., Alpers, C., 1999, Use of UV/VIS/IS spectroscopy to characterize mine waste dumps in the Penn Mine, Calaveras County, California: Geol. Soc. Amer. Abstracts with Programs, Cordilleran Section meeting, v. 31, no. 6, p. A-91.
Montero Sanchez, I., and Brimhall, G., 2000, Fast mineral identification algorithm for reflectance spectra of iron oxide, iron oxyhydroxide and iron sulfate minerals: Geol. Soc. Amer. Abstracts with Programs, v. 32, no. 7, p. A-180.
Morin, P.J., 2000, What Visualization Contributes to Digital Mapping, in D.R. Soller, ed., Digital Mapping Techniques '00 - Workshop Proceedings: U.S. Geological Survey, Open-File Report 00-325, p. 131-136, https://pubs.usgs.gov/openfile/of00-325/morin.html.
Sales, R.H., 1929, Ore discovery and development: Eng. and Min. Jour., v. 128, p. 277-279.
Sales, R.H., 1941, Mine maps and models, in Peels's Mining Engineer's handbook, Section 19: John Wiley and Sons, New York, p. 2-11.
Soller, D.R., 2000 , Introduction, in D.R. Soller, ed., Digital Mapping Techniques '00 - Workshop Proceedings: U.S. Geological Survey, Open-File Report 00-325, p. 1-2, https://pubs.usgs.gov/openfile/of00-325/intro.html.
Soller, D.R. and Berg, T.M., and Wahl, R., 2000, Developing the National Geologic Map Database, Phase 3- an Online, "Living" Database of Map Information, in D.R. Soller, ed., Digital Mapping Techniques '00 - Workshop Proceedings: U.S. Geological Survey, Open-File Report 00-325, p. 49-52, https://pubs.usgs.gov/openfile/of00-325/soller4.html.
Soller, D.R. and Lindquist, T., 2000, Development and Public review of the draft "Digital Cartographic Standard for geologic Map Symbolization", in D.R. Soller, ed., Digital Mapping Techniques '00 - Workshop Proceedings: U.S. Geological Survey, Open-File Report 00-325, p. 43-48, https://pubs.usgs.gov/openfile/of00-325/soller3.html.
Sorensen, T.C., 1965, Kennedy: Harper and Row, New York, p. 527.
Stamm, N.R., Wardlaw, B.R., Soller, D.R., 2000, GEOLEX- The national Geologic Map database's Geologic Names Lexicon, in D.R. Soller, ed., Digital Mapping Techniques '00 - Workshop Proceedings: U.S. Geological Survey, Open-File Report 00-325, p. 31-42, https://pubs.usgs.gov/openfile/of00-325/stamm.html.
Stanford, L.R. and MacKubbin, V.T., 2000 , Application of a Digital Geologic Base Model in ArcView GIS, in D.R. Soller, ed., Digital Mapping Techniques '00 - Workshop Proceedings: U.S. Geological Survey, Open-File Report 00-325, p. 55-56, https://pubs.usgs.gov/openfile/of00-325/stanford.html.
Stetson, 2001, Healthcare: Barriers to Acceptance of Mobile Computing in healthcare: A look at why medical professionals are slow to accept pen computers in daily practice: Pen Computing, p. 18-20, v. 8 number 38.
RETURN TO Contents
National Cooperative Geologic
Mapping Program | Geologic Division |
Open-File Reports
U.S. Department of the Interior, U.S. Geological Survey
URL: https://pubsdata.usgs.gov/pubs/of/2001/of01-223/brimhall.html
Maintained by David R. Soller
Last modified: 18:24:48 Wed 07 Dec 2016
Privacy statement | General disclaimer | Accessibility