Digital Mapping Techniques '01 -- Workshop Proceedings
U.S. Geological Survey Open-File Report 01-223
Data Structure for the Arizona Geological Survey Geologic Information System: Basic Geologic Map Data
By Stephen M. Richard and Tim R. Orr
Arizona Geological Survey
416 W. Congress, #100
Tucson, AZ 85701
Telephone: (520) 770-3500
Fax: (520) 770-3505
e-mail: Richard_Steve@pop.state.az.us
INTRODUCTION AND PURPOSE
Geoscience data are used for land-management decision-making, for engineering design, in the search for mineral resources, and for scientific research. Traditionally, geologic information has been stored and disseminated using geologic maps and written reports (Bernknopf et al., 1993). Because of the complexity of the earth, much of the information included in a geologic map is buried in several layers of abstraction. Specific applied use of geologic data typically requires preparation of a derivative map designed to show a particular aspect of the geologic data. Such maps might be designed to show rock lithology, the orientation of bedding or foliation in layered rocks, the acid buffering capacity of the rocks, or to show rocks of a particular age. Production of such derivative maps designed for a specific purpose commonly requires a geologically sophisticated analysis of the original map, as well as cartographic design and drafting of the derivative map.
Computer-based geographic information systems allow the manipulation and analysis of much larger and more sophisticated geographic data sets than was possible using paper maps and physical overlays. These systems provide tools to manipulate and integrate geologic data with other geographic data to a greater extent than ever before possible. A well designed, data-rich information system could automate much of the process of producing derivative maps designed for specific applications. This would free the data user to explore the data in more ways, and to experiment with different representations of the data. Providers of geoscience data, like the Arizona Geological Survey, must redesign information delivery systems to facilitate the integration of their geologic data resources into automated systems, and to maximize the usefulness of geologic information.
To this end, the Arizona Geological Survey is developing a computer-based geologic information system designed to meet the needs of mineral exploration geologists, researchers in search of detailed technical information, land managers or planners requiring information pertinent to regulatory, planning, and development functions, and curiosity-driven users from the general public. Many of these users may not be expert geologists, but still need to be able to query the system to obtain information. The underlying data model must be flexible enough to encompass a wide range of earth science information, storing it in such a fashion that it does not become obsolete with advances in geologic science.
Based on several years of development and discussion with other database developers (see papers in Soller, 1997; 1998; 1999; 2000; and this volume), this system has evolved into a structure with a variety of inter-related components, summarized in Table 1. This document defines a relational database implementation of the metadata, cartography, geologic map, and geoscience infrastructure parts of the Arizona geologic information system necessary to represent the basic geologic information and cartography recorded on a typical geologic map. This information includes the assignment of map units to regions on the map, the classification of boundaries between the map units as faults or contacts (here referring to depositional or intrusive contacts), the recording of basic point-referenced structural data, and the cartographic representation of these features. Subsequent documents will describe the detailed geoscience description tables (map units, lithology, age dates, stratigraphic relationships, etc.). The implementation is based on Microsoft Access (currently using the Access2000 version; datasets are distributed with Access97 tables for wider accessibility) as the relational database, and ESRI ArcInfo (v.8.0.1) and ArcView (v.3.2) as the geographic data system.
|
Table 1. Components of Arizona Geological Survey Information System.
[Click HERE for a Word version.]
|
GEOLOGIC MAP DATA
A geologic data set is a collection of map unit definitions, interpretations of the nature of the boundaries between the map units, locations of faults and boundaries between the map units defined, and descriptions (quantitative and qualitative) of the nature of the map units, structures, faults, and map unit boundaries. Data set as used here is independent of the format of the data -- it may be digital or analog (Richard, 2000). A geologic map image is a visual representation of a geologic data set for an area, designed to communicate information to a user. The map image is defined by the map area extent, the geologic data (both spatial location and classification) used, the choice of symbols for geologic features, the map projection and scale, a specification of the surface represented by the map, and the cultural and physiographic base map. The path from a geologic data set to a geologic map image requires selecting symbols to represent the distribution of the map units, the location and type of map unit boundaries and faults, and the location and relevant data for point observations (orientation measurements). These symbols are placed on a base map that represents the map area by means of a projection and some elevation model to represent topography on the mapped surface. The base map provides a visual reference frame to depict the spatial relationships between geologic features, and a means of physically locating the features depicted. Design of the base map is an important aspect of cartography. This definition of a map image makes no distinction between a standard geologic map (map surface = earth surface), a mine-level map (map surface = horizontal plane), or a geologic cross section (map surface = vertical plane along section line).
A digital geologic data set represents a geologic data set in a georeferenced form using a set of computer files. A digital geologic data set is defined by:
- The conceptual model that is the basis for the geologic data set.
- A logical data schema that is a mapping of the conceptual model underlying the geologic data set to data structures that can be represented by an automated system (e.g relational tables, described in this report).
- A physical implementation schema that defines the organization of data into files, the detailed structure of the files, and the representation of data in the files. The file format dictates the software and hardware sys-tems that are compatible with the data.
- A projection and map horizon specification that describes how the three-dimensional location of features on the Earth is specified.
- The data instances contained in the files (locations of contacts and faults, map unit definitions, classifica-tion of areas to map units....).
- A set of definitions that specify the meaning of attributes applied to included data instances.
DATA MODEL IMPLEMENTATION COMPONENTS
This report describes the logical and physical implementation of a database system for the representation of geologic features represented on geologic maps. It is assumed that the reader is familiar with the basics of the ESRI coverage data model and the use of ESRI ArcView GIS 3.x and Microsoft Access 97-2000 software.
This database implementation is a second-generation effort, and supercedes the data structure outlined in Richard and Thieme (1997). The design is an outgrowth from a proposed North American standard data model ("NADM") for geologic maps (Johnson et al., 1998), overseen by the North American Data Model Steering Committee (http://geology.usgs.gov.dm/). In the course of implementing this database, the Johnson et al. (1998) model was found inadequate to allow inclusion of information in existing AZGS databases and for a complete representation of geologic information. Focus then shifted to the NADM "Cordlink" variant model (Brodaric et al., 1999) as a starting point. Various aspects of this model were also found insufficient or unsatisfying. The logical model presented here was evolved to reduce the number of tables and allow greater flexibility and logical consistency. The final implementation resembles the Johnson et al. (1998) NADM 4.3 model only in very general terms. The model builds on the design philosophy laid out in Richard (1998), the conceptual model described in Richard (1999), and the recent parallel development of an object-oriented data model by Brodaric and others (Brodaric, 2000; Brodaric and Hastings, 2001; Brodaric and Gahegan, 2000).
The core components of the model are:
- Classification Concept table(s). At the core of the model is a table or group of tables with similar structure that define terminology. The essential elements of these ClassificationConcept tables are a unique identifier, a name, and a definition/description. The unique identifier follows the global unique identifier scheme described below. The name is a string that allows human identification of the concept (e.g "basalt"), and the definition/description is a free text field that defines the term or describes its meaning precisely.
- Relationship tables. These are tables that link data instances. The meaning of the link is defined by a relation-ship type attribute. The data instances that fill roles in a relationship may be any individual classification concept, description, or relationship; the kinds of valid role fillers are determined by the relationship type attribute. Three sorts of relationship tables are included with different structure and application. Hierarchy Relationship tables define parent-child relationships in hierarchies; these may be taxonomic (IsA) or meronymic (Part-Whole). Simple Relationship tables link data instances, which may have a sequence; typically these link description parts (e.g image to rock description, age date to rock description, chemical analysis to location). The most complex relationships are Attributed Relationships, which allow an attribute value to be associated with the link, along with a sequencing index, and classification confidence and classification basis attributes.
- Description tables. These are tables tailored to particular kinds of descriptions. Spatial objects (points, lines, polygons...) are represented in a description table. In addition, the core model includes tables for structural measurements, rock samples, text, geochronologic ages, chemical substances, lithologic description, stratigraphic time, spatial objects, images, and measured quantity. Only the spatial object, structural measurement and rock sample tables are described here. Some description tables are linked to ClassificationConcepts directly through the sharing of a unique identifier, and provide a structured description to characterize the classification concept. Others provide descriptions of "real world" instances (a particular rock sample, a particular contact, a particular fault....).
- Map Visualization tables. These are a set of tables used to define map visualizations. This group includes three tables:
- Map View Definition table - specifies a title, author, design scale, map extent, symbolization scheme and classification scheme for the map;
- Map Legend - relates each symbol used in the map visualization to a classification concept;
- Cartographic Object table - defines the symbols used on the map in implementation-independent terms.
Three modes of defining assignment of symbols to spatial objects represented on the map are used. First, in this database, all spatial objects have a default classification attribute and a default cartographic object attribute. This default symbolization corresponds to that assigned by the original author of the map visualization (default visualization). Second, symbols may be associated with spatial objects through the map legend, (symbol - classification link) and a spatial classification attributed relationship (spatial object - classification link). This approach corresponds to the NADM 4.3 and Cordlink Variant approach. Finally, a general visualization links spatial objects to symbols through an attributed relationship link (symbolization scheme) whose type is the identifier for the map view definition. This final approach corresponds most closely to how map visualizations are actually generated from spatial data. The relationship attribute is the rotation to apply to structure measurement symbols, or, in the case of purely cartographic annotation symbols, the text string to display.
Identification Scheme
Unique identification of data instances in an internationally distributed data warehouse is achieved by partitioning responsibility for maintenance of unique identifiers. The Arizona Geological Survey uses a 3-component composite key, consisting of 3 long (4 byte) integers. At the top level, each organization providing data to the system must be assigned a NameSpace by the overall system manager. Note that a NameSpace is a ClassificationConcept. The name string and an integer identifier for the NameSpace must be globally unique. Within each NameSpace, every data file must have a unique integer identifier, and should have a unique name string. The system manager for the NameSpace must assign a unique identifier number to each data table, geographic data set (coverage, shapefile, etc.), image, text file, etc. that will be used by the system. Information about each data file (called a DataSet here) is stored in a central DataSet table maintained within each NameSpace. This table is analogous to a "catalog" in the Open GIS consortium model. The DataSet table must include a physical address (url) for each DataSet so that it can be located automatically when accessed. Within each DataSet, every data instance has a unique integer identifier number. The field containing this identifier is generally named with a string in the form "DataSetName" & "ID". In summary, the unique, global identifier for any data instance is a tuple consisting of 3 integers: {NameSpaceID, DataSetID, ObjectID}. Because this system has not been adopted outside the Arizona Geological Survey at present, the NameSpaceID is not explicitly included in tables here. Because some database software cannot join on multiple fields, implementation considerations require generating a single UniqueID from the DataSetID and ObjectID under some conditions. This is done using the formula ID = (DataSetID * 10000000) + ObjectID.
Metadata
Feature level metadata is implemented by linking every data instance with an origin TrackingRecord, either as an attribute of the instance, or by inheriting origin tracking from the DataSet that contains the instance. The TrackingRecord defines a person, organization, and project (an "activity") that generated the data instance, along with a link to a data processing description for how the information was obtained and introduced to the database. Each TrackingRecord may be linked (through a SimpleRelationship) to one or more bibliographic citations.
Table and Field Naming Conventions
Tables and fields are named using strings with no spaces. The first letter of separate words in the name is capitalized, and no underscore separates words in the name. Typing an underscore is error-prone, and under many display conditions, underscores may be difficult to see. Because of limitations in ArcInfo (v8.0.1) and ArcView (v.3.2) software, field names in spatial data native tables are limited to 10 characters.
DATA OVERVIEW AND ORGANIZATION
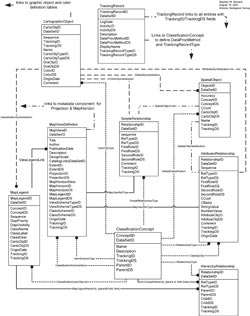
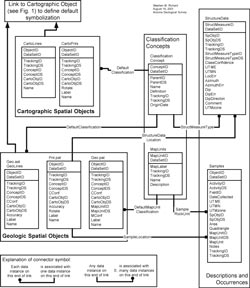
Three schema at the end of this document are presented to assist in understanding the data structure. Figure 1 is a simplified schema showing the tables necessary to represent the basic geologic data and cartography contained in a typical geologic map visualization. This schema includes the three kinds of relationship tables used to implement the general relationship structure. Metadata, implementation-specific description of cartographic objects, and description representation is not expanded in this schema. Figure 2 is a simplified schema showing the description of spatial objects. Fields in the spatial object table (AAT and PAT in ESRI terminology) represent a default visualization and classification scheme, which uses the geologic symbolization and classification of the original map author. This schema also includes some representation of description -- sample locations and structural measurements are included. It does not include the correlation tables necessary for building general relationships between objects, or any metadata tables. Figure 3 is a simplified schema showing a more in-depth (but not complete) view of the feature-level metadata implementation. All the tables shown on these schemata are described in this text, and the figures should be referenced throughout the following discussion.
|
|
|
|
|
Figure 1. Simplified schema for geoscience database implementation. Map visualization represented by general relationship links between cartographic, classification, and spatial objects. Metadata, implementation-specific description of cartographic objects, and description representations are not expanded in this schema. Different line patterns used to facilitate tracing links.
[Click on image to open a larger version in a new window.]
|
|
|
Figure 2. Simplified schema for geoscience database implementation. Metadata links not shown.
[Click on image to open a larger version in a new window.]
|
|
|

|
|
|
Figure 3. Schema for basic metadata relational implementation.
[Click on image to open a larger version in a new window.]
|
The geologic and cartographic information in the database is organized into several ArcInfo coverages and ESRI shapefiles. The basic geology defined in the Geo coverage requires the point-line-polygon topology implemented by an ArcInfo coverage. Other spatial data may be in coverages or ESRI shapefiles. The Geo polygon and arc coverage contains the lines that represent geologic contacts and faults, and the associated polygons based on those lines that define the outcrop area of map units. The Pnt point data set contains the field observation stations that record things such as structural measurements and collected rock samples. The GeoLines line data set contains the geologic lines that do not define boundaries between rock units, such as concealed faults and fold hinge surface traces. The CartoLines line dataset contains cartographic lines, such as text lead-in lines. Last, the CartoPnts point dataset locates the cartographic point features used in the default map layout, such as text labels.
Every spatial object (point, line, or polygon) is uniquely identified by a compound primary key consisting of a source-file identifier, named DatasetID, and a unique identifier within that file, named "DataSetName" & ID (referred to as ObjectID here). The ArcInfo-assigned User-ID field, a seemingly good candidate for unique identifiers, is not immutable under build and clean operations on the data set. Therefore, ObjectID was added as a user-defined attribute, and the uniqueness constraint must be enforced by the user. The ObjectID values in the tables in this database should not be edited unless the user fully understands the data structure and the ramifications of editing the primary key in a relational database table. All points, lines, and polygons have a TrackingID attribute that joins with the TrackingRecord table to show the source origination and tracking information for each object. Geologic points and lines also have an Accuracy attribute that defines the location uncertainty in meters for the point or line. The compound object key, ObjectID and DatasetID, and the compound source tracking key, TrackingID and TrackingDS, plus the Accuracy attribute for geologic points and lines, are the minimal set of attributes fundamental to each spatial object.
A number of other attributes are also included in the coverage and shapefile tables to facilitate visualization of the geologic data in a default layout, and to allow querying against a default classification scheme equivalent to the original source map. These default values also make simple analyses of the map possible in non-relational database environments required by some users of AZGS data. The compound classification concept attribute, ConceptID and ConceptDS, defines the default classification of every object (Fault; Bedding; Surficial Map Unit...); the classification confidence attribute, CConf, provides a subjective measure of the confidence level for the classification of the object (Low; Standard...); and the compound cartographic object attribute, CartoObjID and CartoObjDS, defines the cartographic object used to symbolize each feature in the default visualization ("0.35pt. solid black line (24K)"; "Inclined bedding symbol - color black (24K)"; "PMS-1205"...). There is also a Label attribute used to store any specific labels or names associated with an object, such as unit names for geologic polygons, and a Name attribute that contains a brief description of each object for intelligibility. Polygon features have a map unit confidence attribute, MConf, that provides a subjective measure of the identification confidence of a polygon to a particular map unit (Low; Standard...). Point features also have a Rotate attribute, measured anticlockwise, starting from a compass azimuth of 90°, that defines the degree of rotation of graphical elements used for feature symbolization in the ArcView project. The rotation magnitude is specific to the graphical environment of ArcView 3.2 using the AZGSgeo.ttf true type font. Use of these geographic data sets with a different GIS platform and/or font may require that the rotation values in the Rotate attribute be recalculated.
In the summaries that follow, each table includes a compound unique identifier and a tracking record link. These universal fields are described here rather than in the tables below. Italicized words are names of other tables in the database.
- ObjectID: Integer, width 16. First part of the compound primary key. Uniquely identifies each record in a particular table. Domain: Integers >0 and <1016, no duplicates. (Name varies from table to table)
- DataSetID: Integer, width 16. Second part of the compound primary key. Uniquely identifies the record in the DataSetAZ table that defines the data set that contains the definitive instance of this object. Domain: Integers >0 and <1016, must be defined in the DataSetAZ table.
- TrackingID: Integer, width 16. First part of the compound primary key for link to the origin tracking record for each object. It is a foreign key that joins to the TrackingID field of the TrackingRecord table. Domain: Integers >0 and <1016, must have match in table identified by TrackingDS value.
- TrackingDS: Integer, width 16. The DataSetID for the table that contains the data object identified by TrackingID. Domain: Integers >0 and <1016, must be defined in the DataSetAZ table.
GEOLOGIC SPATIAL DATA
Geology Coverage
The geospatial data for a particular geologic data set are represented in a set of Arc/Info coverages or ESRI shapefiles. These files contain spatial objects that represent geologic features at corresponding locations in the physical world. A minimum of two files are required to represent a geologic map -- one that represents geologic faults and contacts, and one that represents the distribution of map units. AZGS geologic map databases include these in one Arc/Info coverage with polygon and line topology, named Geo. A third file may be included to represent point-located data (structure measurements, rock descriptions, sample locations). AZGS geologic map databases include these in an Arc/Info point coverage or an ESRI point shapefile, named GeoPnts. A fourth file may be necessary to represent those geologic lines that do not define polygon topology (concealed faults, fold hinges, dikes, marker beds...). AZGS geologic map databases include these in one Arc/Info line coverage or ESRI line shapefile, named Geolines. Fields in the data table associated with this extra line-file are equivalent to the arc attributes in the Geo coverage, and are not described separately here.
The Geo coverage is a polygon and arc coverage that contains geologic lines that bound polygons (contacts, faults, mapping boundaries...), or represent surfaces that are discontinuous within polygons (faults that become buried or die out). The polygon topology defined by the lines in this coverage identifies the distribution of geologic map units.
Polygon Attributes
- ObjectID/DataSetID: Compound key, unique identifier for each spatial object
- TrackingID/TrackingDS: Compound foreign key, link to origin tracking record.
- ConceptID/ConceptDS: Link to classification concept that classifies the kind of map unit a particular polygon represents. It is a foreign key that joins to the ConceptID field of the ClassificationConcept table. See Table 2 for example values.
Table 2. Example classification concept ID codes used in the Geo.pat table.

|
|
[Click HERE for a Word version.]
|
- CConf: Character, width 16. Assigns a qualitative confidence level to the classification of the kind of unit represented by the polygon. Domain: "low", "standard", or "high".
- CartoObjID/CartoObjDS: Compound foreign key, link to cartographic object used to symbolized this spatial object on the default map visualization. It is a foreign key that joins to the CartoObjID field of the Cartographic-Object table. See Table 3 for example values.
Table 3. Example cartographic object codes used in the Geo.pat table.
|
|
[Click HERE for a Word version.]
|
- MapUnitID/MapUnitDS: Compound foreign key, link that identifies the geologic map unit associated with each polygon of type "Rock Volume Map Unit" (ConceptID = 2406) or "Surficial Map Unit" (ConceptID = 2405). It is a foreign key that joins to the ObjectID/DataSetID of the MapUnits table. See Table 4 for example values.
Table 4. Example rock unit identification codes used in the Geo.pat table.
|
|
[Click HERE for a Word version.]
|
- MConf: Character, width 16. For polygons of type "Rock Volume Map Unit" (ConceptID = 2406) or "Surficial Map Unit" (ConceptID = 2405), indicates the subjective confidence of the person making the map unit classification in the assignment of the material within the polygon to a particular rock volume or surficial geologic map unit. Otherwise the field does not contain a value. Domain: "low", "standard", or "high".
- Label: Character, width 50. Equivalent to the geologic map unit labels on the default map visualization. This attribute represents the default classification of each polygon to a particular rock unit and is included to make symbolizing and viewing the default map visualization relatively simple. The label is queried if the classification confidence is low.
- Name: Character, width 255. Equivalent to the geologic map unit names in the map explanation on the default map visualization. This is a redundant field added to simplify the use of the data set in non-relational database environments.
Arc Attributes
- ObjectID/DataSetID: Compound key, unique identifier for each spatial object
- TrackingID/TrackingDS: Compound foreign key, link to origin tracking record.
- Accuracy: Float (real), single precision. Represents the spatial uncertainty in the location of a feature, in meters. For example, a value of 10 for a line feature indicates that the geologic entity represented by the line on the default map visualization is within 10 meters of the mapped feature's actual location on the ground. At present this uncertainty combines the geologic uncertainty in the accuracy of location (e.g for a gradational or poorly exposed contact), and the numerical uncertainty in the computer representation of the line location resulting from accumulated calculation and digitizing errors. The uncertainty must be greater than the numerical precision of the X,Y coordinates that locate a point (i.e. the accuracy cannot exceed the precision). This value determines the line style that represents the line by using standard solid, dashed, and dotted lines. For most existing maps, this length will be based on standard map accuracy, i.e. the geologic entity is located within the width of the line shown on a map for a solid line. In this data set, location uncertainties are qualitatively estimated. A value of 0 indicates that accuracy is not defined, as in the case of cartographic lines. Domain: rational numbers >numerical precision of data and <108.
- ConceptID/ConceptDS: Same as for geology polygon coverage. See Table 5 for example values.
Table 5. Example classification concept values used in the Geo.aat table.
|
|
[Click HERE for a Word version.]
|
- CConf: Same as for geology polygon coverage.
- CartoObjID/CartoObjDS: Same as for geology polygon coverage. See Table 6 for example values.
Table 6. Example cartographic object codes used in Geo.aat table.
|
|
[Click HERE for a Word version.]
|
- Label: Character, width 50. When used, contains strings that identify line features that have a label associated with them, as in the case of named faults. Domain: Free text.
- Name: Character, width 255. Identifies the default classification of each type of line. This is a redundant field added to simplify the use of the data set in non-relational database environments.
Point Coverage
The GeoPnt coverage is a point coverage that represents geologic spatial features located at a distinct point (structural measurement stations, rock samples collection stations...).
Point Attributes
- ObjectID/DataSetID: Compound key, unique identifier for each spatial object
- TrackingID/TrackingDS: Compound foreign key, link to origin tracking record.
- Accuracy: Same as for geology arc coverage, see above.
- ConceptID/ConceptDS: Same as for geology polygon coverage. Typical value: ConceptID = 3340 - Field Observation Station.
- CConf: Same as for geology polygon coverage.
- CartoObjID/CartoObjDS: Same as for geology polygon coverage. See Table 7 for example values.
Table 7. Example cartographic object codes used in the GeoPnt.pat table.
|
|
[Click HERE for a Word version.]
|
- Label: Character, width 50. When used, contains strings that are equivalent to any labels associated with point features on the default map visualization, e.g sample identification numbers.
- Rotation: Integer, width 4. Specifies the font symbol rotation that correctly represents the azimuth of the geologic feature displayed on the default map visualization at this point. This value is specific to the graphical environment of ArcView 3.2 using the AZGSgeo.ttf font.
- Name: Same as for geology arc coverage, see above.
CARTOGRAPHIC SPATIAL OBJECTS
Cartographic elements for the default map visualization of a particular geologic data set are included in a line and a point shapefile. Because the locations of points and lines in these shapefiles are chosen to provide cartographic clarity, the Accuracy and CConf fields are irrelevant and therefore not included. Otherwise the fields are the same as those in the geologic line and point coverages (geo.aat and pnt.pat), described above. The CartoLines shapefile contains the cartographic lines (text lead-in lines...) used in the default map visualization. The CartoPnts shapefile contains the cartographic points (text labels, fault symbols, fold geometry symbols...) used in the default map visualization. Table 8 lists some kinds of points included in this shape file, and Table 9 lists some associated cartographic object examples.
Table 8. Example cartographic object codes used in the GeoPnt.pat table.
[Click HERE for a Word version.]
|
|
|
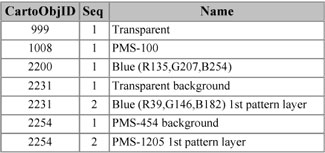
Table 9. Example cartographic object codes used in the CartoPnts table.
[Click HERE for a Word version.]
|
THEMATIC GEOLOGY DATABASE TABLES
The majority of geologic information is stored in thematic databases specific to particular kinds of geoscience information, and linked to the Spatial Object tables by explicit links, or through relationship links. Information in these thematic tables includes structural measurements, rock sample descriptions, text descriptions, geochronologic age data, chemical and isotopic analytical data, lithologic descriptions, stratigraphic time scales, and images. This thematic geoscience part of the database is the least developed aspect of the system at present. Only basic map unit description, structural measurement and rock sample tables are described here. The thematic tables are specific to the particular geologic data set. These tables are included in a Microsoft Access database associated with each geologic data set.
Map Unit Table
The MapUnits table defines the map units used to classify polygons in the Geo coverage. In a more complete implementation, the MapUnitID would be a link to a more complete description in a series of tables for lithology, rock volume, and geologic surface description (geoscience description component of database, see Table 1).
Database Table Fields
- MapUnitID/DataSetID: Compound key, unique identifier for map unit.
- TrackingID/TrackingDS: Compound foreign key, link to origin tracking record.
- OriginDate: Date/Time. Records when the record was created. This information provides more detailed information on the time that records were originally entered, supplementing the information in the associated TrackingRecord table.
- MapLabel: Text, width 25. Text string for standard map label for this unit.
- Name: Text, width 255. Identifies the map unit name or rock type.
- Description: Memo. Full description of the rock unit.
Samples Table
The Samples table contains location and description information for rock samples collected within the extent of the geologic data set. The inclusion of both the UTM coordinates for the sample location and a link to a spatial object representing the sample location is redundant, but both forms of location are included for reliability. If the link with the spatial object data set is corrupted, the Samples table still contains sufficient information to locate the sample. Likewise, the sample table can be exported for data exchange without including a data set with location spatial objects.
Database Table Fields
- ObjectID/DataSetID: Compound key, unique identifier for sample.
- TrackingID/TrackingDS: Compound foreign key, link to origin tracking record.
- ActivityID/ActivityDS: Compound foreign key, link to Activity for collection of the sample. Activities for sample collection should indicate the person who collected the sample. Domain: Integers >0 and <1016.
- FieldID: Text, width 30. Records the sample identifier assigned to the rock collected in the field by the original collector.
- DateCollected: Date/Time. Records when a sample was collected.
- UTME: Number, real, single precision. UTM easting coordinate for sample location. Domain: 122000 < UTME < 700000.
- UTMN: Number, real, single precision. UTM northing coordinate for sample location. Domain: 3420000 < UTMN < 4110000.
- UTMzone: Number, long integer. Zone number for UTM coordinates. Domain: 11 or 12 for the State of Arizona.
- Accuracy: Same as for geology point coverage.
- SpObjID/SpObjDS: Compound foreign key, link to spatial object that represents sample location.
- Area: Text, width 64. Geographic area name from Arizona Geological Survey Place Names list. Domain: Place names included in Trapp and Reynolds (1998).
- Quadrangle: Text, width 64. Name of USGS 7.5 minute quadrangle that contains the sample location. Domain: USGS 7.5 minute Quadrangle names.
- MapUnitID/MapUnitDS: Compound foreign key, link that identifies the geologic map unit in the MapUnits data set from which the sample was collected.
- Notes: Memo. Free text notes on sample.
Structural Measurement Data Table
The StructureData table contains values that define the orientation of structural features. The inclusion of both the UTM coordinates for the station location and a link to a spatial object representing the station location is redundant, but both forms of location are included for reliability. If the link with the spatial object data set is corrupted, the StructureData table still contains sufficient information to locate the station. Likewise, the StructureData table can be exported for data exchange without including a data set with location spatial objects. A separate correlation table to link stations with locations is unnecessary because each station has a unique location.
Database Table Fields
- StructMeasureID/DataSetID: Compound key, unique identifier for measurement.
- TrackingID/TrackingDS: Compound foreign key, link to origin tracking record.
- SpObjID/SpObjDS: Compound foreign key, link to spatial object in geology points coverage that represents the measurement location.
- Name: Text, width 255. Provides a descriptive name for each type of structural measurement.
- StructMeasureTypeID/StructMeasureTypeDS: Compound foreign key, link to classification concept that identifies the kind of structure measured. It is a foreign key that joins to the ConceptID field of the ClassificationConcept table. See Table 10 for example values.
- ProjectID/ProjectDS: Compound foreign key that uniquely identifies the project associated with the activity. See Table 12 for example values.
Table 10. Example structural measurement type codes used in the StructureData table.

|
|
|
[Click HERE for a Word version.]
|
- CConf: Same as for geology polygon coverage.
- UTME: Same as for Samples Table.
- UTMN: Same as for Samples Table.
- UTMzone: Same as for Samples Table.
- Accuracy: Same as for geology point coverage.
- Azimuth: Number, single-precision real. Records the trend or strike of a structural feature in degrees. For planar surfaces, the measurement is recorded using the right-hand rule (i.e. the measurement is made such that the down-dip direction is to the right when facing in the azimuth direction). The magnitude of the angle is measured clockwise starting from a compass azimuth of 0°. Domain: Real numbers, from 0 to 360.
- AzimuthErr: Number, single-precision real. Records the uncertainty, in degrees, associated with an azimuth measurement. For example, an AzimuthErr of 5 for an Azimuth of 127 would indicate that the azimuth actually falls within the range from 122 to 132 degrees. Domain: Real numbers, >0 and <108.
- Dip: Number, single-precision real. Records the angle between a planar or linear feature and horizontal (degrees). The angle is measured in the vertical plane perpendicular to strike for planar features and parallel to trend for linear features. The dip angle here measures total rotation rather than the conventional inclination measurement. For overturned beds this results in dips >900. This allows conceptually consistent representation of the dip for upright, overturned, or doubly overturned structures. Upright beds have dip <90, overturned beds have 90 < dip <180. Doubly overturned beds have dip >180. Domain: Real numbers, >0 and <108.
- DipErr: Number, single-precision real. Records the uncertainty, in degrees, associated with a dip measurement. For example, a DipErr of 3 for a Dip of 29 would indicate that the dip actually falls within the range from 26 to 32 degrees. Domain: Real numbers, >0 and <108.
ARIZONA GEOLOGIC DATA SYSTEM TABLES
The lookup tables defined below contain supporting data maintained by the Arizona Geological Survey to support all databases within the organization. These tables are included as a Microsoft Access database. By default, each data set below references a table that is included in the Arizona Geological Survey namespace.
Classification Tables
Classification Concept Table
The ClassificationConcept table is a collection of terminology definitions - a term with a definition. These terms are used to classify other objects in all parts of the database. A unique identifier (ConceptID - DatasetID pair) identifies each concept. Thus the name of the concept may be changed without updating other links. The Arizona Geological Survey geologic information system has separate classification concept tables that are specific to different components of the system (e.g. Rock Unit Lexicon, Standard lithologic terms, etc.). Each of these classification concept tables has its own data set identifier defined in the DataSetAz table.
Database Table Fields
- ConceptID/DatasetID: Compound key, unique identifier for concept.
- TrackingID/TrackingDS: Compound foreign key, link to origin tracking record.
- Name: Text, width 255. Provides a descriptive name for each classification concept.
- ParentID/ParentDS: Compound foreign key, link to ClassificationConcept that represents the concept type. Semantically this is equivalent to the parent of the concept and the links between classification concepts and parent concepts define the classification concept hierarchy. This hierarchy is represented by the HierarchyRelationship table for use in general database queries. Inclusion of this attribute with each classification concept facilitates management of a single, simple tree hierarchy for classification concepts, but future development may allow a more complex concept hierarchy with multiple parent links. The ParentID is a foreign key that joins to the ConceptID field in this same table. Domain: Integers >0 and <1016.
- Definition: Memo. Defines each classification concept.
- OriginDate: Date/Time. Records when the record was created.
Relationship Tables
Three sorts of relationship tables are used for representing semantic links between objects in the database (see Relationship Table Discussion, above). In the Arizona Geological Survey geologic information system, each component of the system (cartography, rock unit lexicon, standard lithology, geochronology...) has relationship tables specific to that sub-domain. A particular geologic data set may include several different relationship tables of each of the types described below, each with its own DataSetID defined in the DataSetAz table.
Attributed Relationship Table
The AttributedRelationship table is used for representing relationships between objects in the database, i.e. for linking instances of two entities in which each relationship instance is assigned one or more attributes. This table is constructed to allow up to 5 attributes: CConf (Concept Confidence), CBasis (Concept Basis), StringValue (any string), Number Value (any number), or Attribute (a link to another object in the database). The RelTypeID link defines the semantics of the relationship links. Relationship constraints on RelType specify which attributes may have values, and specify the domains of those values. Examples of attributed relationships include geologic classification of spatial objects, and various kinds of fractional analyses (e.g. chemical analysis, modal mineral analysis, grain size distribution).
Database Table Fields
- RelationshipID/DataSetID: Compound primary key that uniquely identifies each record in the AttributedRelationship table. Although the compound key {RelTypeID, RelTypeDS, FirstRoleID, FirstRoleDS, SecondRoleID, SecondRoleDS} provides a unique key, the table has a standard {ObjectID, DatasetID} key to allow a relationship to play a role in another relationship using the standard relationship tables. Domain: Integers >0 and <1016, no duplicates.
- TrackingID/TrackingDS: Compound foreign key, link to origin tracking record.
- Sequence: Number, long integer. Third part of compound primary key. Orders multiple instances of a single relationship link; use for ordered aggregation.
- RelTypeID/RelTypeDS: Compound foreign key, link to classification concept that identifies the kind of relationship. This allows the AttributedRelationship table to represent any relationship that is defined by a ClassificationConcept.
- FirstRoleID/FirstRoleDS: Compound foreign key that identifies the object that fills the first role in the AttributedRelationship.
- SecondRoleID/SecondRoleDS: Compound foreign key that identifies the object that fills the second role in the AttributedRelationship.
- CConf: Same as for geology polygon coverage.
- CBasis: Text, length 255. Indicates the basis for assigning the relationship. Ideally this and CConf should be ClassificationConcept terms, but a text field is implemented here as an interim measure to get a better feeling for what sort of terms are required to assign values for confidence and basis.
- StringValue: Text, length 255. Allows assignment of a text attribute value for the relationship. An example is a text string that is displayed at a point location as cartographic annotation, in which case the relationship links the point with a TextFormat cartographic object. Domain: Free text.
- NumberValue: Number, single-precision real. Allows assignment of a numeric attribute value for the relationship. Examples include assignment of a fractional abundance for a component in a fractional analysis, or a symbol rotation value for a point location-structure symbol link. Domain: Real numbers, >0 and <108.
- AttributeObjID/AttributeObjDS: Compound foreign key that identifies an attribute object associated with this AttributedRelationship instance.
- OriginDate: Date/Time. Records when the record was created.
- Comment: Memo. Additional information about a relationship instance.
Hierarchy Relationship Table
The HierarchyRelationship table represents parent-child relationships. Multiple tree hierarchies may be represented, each identified by a HierarchyType - a classification concept that defines the nature of the hierarchy. For implementation simplicity, a hierarchy is represented in this table as a set of links between each parent and all the child objects beneath it in the hierarchy tree (its transitive closure). The depth of any child object in the tree is determined by the number of parent objects linked to it. This representation makes response to queries that require all kinds (sub types) of a thing (e.g. "all spatial objects", "all map units") simple to execute. Currently, each child has only one parent.
Database Table Fields
- RelationshipID/DataSetID: Compound key that uniquely identifies relationship; see discussion for AttributedRelationship, above.
- TrackingID/TrackingDS: Compound foreign key, link to origin tracking record.
- HierarchyTypeID/HierarchyTypeDS: Compound foreign key, link to ClassificationConcept that identifies the kind of hierarchy. This allows the HierarchyRelationship table to represent multiple concept hierarchies as well as other unrelated hierarchies or part-whole trees.
- ParentID/ParentDS: Compound foreign key, link to the parent object in the relationship.
- ChildID/ChildDS: Compound foreign key, link to the child object in the relationship.
Simple Relationship Table
This table is used to represent relationships that link instances of any two objects in which no uncertainty is involved and the relationship has no attributes. Examples include aggregations of parts, and linking SpatialObjects to Cartographic-Objects for symbolization.
Database Table Fields
- RelationshipID/DataSetID: First part of compound key that uniquely identifies relationship; see discussion for AttributedRelationship, above.
- TrackingID/TrackingDS: Compound foreign key, link to origin tracking record.
- Sequence: Number, long integer. Third part of compound primary key. Orders multiple instances of a single relationship link. Use for ordered aggregation relationship. Domain: Integers >0 and <1016.
- RelTypeID/RelTypeDS: Compound foreign key, link to classification concept that identifies the kind of relationship. This allows the SimpleRelationship table to represent any relationship that is defined by a ClassificationConcept.
- FirstRoleID/FirstRoleDS: Compound foreign key, link to object that fills the first role in the SimpleRelationship.
- SecondRoleID/SecondRoleDS: Compound foreign key, link to object that fills the second role in the SimpleRelationship.
- Comment: Memo. Contains any additional information about a relationship instance.
Metadata Tables
Activities Table
The Activities table is a link to an activity responsible for update of, or addition to, the database. An activity is a particular person, working for a particular organization, under the auspices of a particular project.
Database Table Fields
- ActivityID/DatasetID: Compound key that uniquely identifies the activity.
- Name: Text, width 255. Provides a unique name identifier for each activity.
- PersonOrgID/PersonOrgDS: Compound foreign key that uniquely identifies the {person, organization} tuple associated with the activity. See Table 11 for example values.
Table 11. Example PersonOrg codes used in the Activities Table.
[Click HERE for a Word version.]
|
- ProjectID/ProjectDS: Compound foreign key that uniquely identifies the project associated with the activity. See Table 12 for example values.
Table 12. Example ProjectID codes used in the Activities Table.
[Click HERE for a Word version.]
|
- Comment: Memo. Contains descriptive text about each activity.
Bibliographic Citations Table (AZgeoBibLinkTable)
The AZgeoBibLinkTable table is derived from the Arizona Geological Survey bibliographic data base (AzGeoBib, Trapp et al. (1996), DataSetID = 4 in the DataSetAZ table), and provides a mechanism for citing published literature. In this database citations are related to tracking records through the MetadataRelationship table. This derivative table is included to replace links to the full AzGeoBib database.
Database Table Fields
- AzGeoBibID/DataSetID: Compound key that uniquely identifies the citation in AzGeoBib.
- Authorship: Text, length 255. Author of cited publication. Format: "Last Name, First Initial.Middle Initial."; Author names separated by comma, with "," and " before last author.
- Title: Text, length 255. Title of cited publication.
- Citation: Text, length 255. A text citation for the location of publication.
- Year: Date/Time. Year of publication for citation.
DataSetAZ Table
The DataSetAZ table is a catalog of the data sets within the Arizona Geological Survey namespace. A data set is any collection of data that is held in an individual file or table. Examples include individual ArcInfo coverages, ESRI shapefiles, tables in Microsoft Access databases, dBase tables in individual .dbf files, and files containing images (e.g tiff, jpeg). The contents of the DataSetAZ table define the "Arizona Geological Survey" namespace. This table is analogous to an Open GIS Consortium "Catalog." In the more complete metadata implementation, a geographic dataset is associated with map extent, projection, and map horizon objects that define the original geometry of the spatial data.
Database Table Fields
- DataSetID: Number, long integer. First part of the compound primary key, uniquely identifies data set in the DataSetAZ table.
- NameSpace: Text, width 50. Second part of the compound primary key. Identifies the agency or organization that owns or maintains the data set. Example: "Arizona Geological Survey."
- NameSpaceID/NameSpaceDS: Compound foreign key that joins to the ConceptID field of the ClassificationConcept table. There is a 1:1 correspondence between NameSpaceID and values in the NameSpace field; either can serve as the second part of the compound key that identifies a DataSet. Both a string value and an numeric value are included to facilitate implementation using the convention adopted for this database system that a data object within a particular namespace is identified by a compound primary key consisting of 2 long integers.
- TrackingID/TrackingDS: Compound foreign key, link to tracking record that records origin of dataset. This tracking record is inherited by records in the data set if they do not have individual tracking records.
- DataSetName: Text, width 255. Uniquely identifies the data set within the NameSpace.
- DataSetTypeID/DataSetTypeDS: Compound foreign key, link to ClassificationConcept that identifies the physical data structure of the data set (e.g ArcInfo coverage, Microsoft Access table....). See Table 13 for example values.
Table 13. Example data set type codes used in the DataSetAZ table.
|
|
|
[Click HERE for a Word version.]
|
- DataSetSubjectID/DataSetSubjectDS: Compound foreign key, link to a ClassificationConcept that classifies the data set according to a subject classification term. The subject classification term identifies the domain of interest for the data in the data set. In future implementations, the data set subject will be used for error and consistency checking. A more complete key word index for data sets would need to be implemented through a correlation table (Simple Relationship) allowing a many-to-many join between data sets and subjects. See Table 14 for example values.
Table 14. Example data set subject codes used in the DataSetAZ table.
|
|
|
[Click HERE for a Word version.]
|
- SourceFileTypeID/SourceFileTypeDS: Number, long integer. Classifies each data set by its physical file type or format. It is a foreign key that joins to the ConceptID field of the ClassificationConcept table. Domain: See Table 15.
Table 15. Example source file type codes used in the DataSetAZ table.
|
|
|
[Click HERE for a Word version.]
|
- PhysicalAddressTypeID/PhysicalAddressTypeDS: Compound foreign key, link to ClassificationConcept that identifies the type of physical address that records where the data set is stored. Example values: 2726 = DOS-style path name; 2727 = Microsoft Network file path name.
- PhysicalAddress: Text, width 255. Identifies the actual physical location of the data set.
- IdentifierFieldName: Text, width 50. The name of the field in the DataSet that contains the identifier component of the compound unique identifier for each record. The field name is typically the table name or an object type name with "ID" appended. Identifier field names always end with the string "ID."
- DataSetFieldName: Text, width 50. Records the name of the field in the DataSet that contains the data set component of the compound unique identifier for each record. By convention, this field is named "DataSetID", but some variations occur.
- Comment: Memo. Provides additional descriptive information about each data set.
Metadata Relationship Table
The MetadataRelationship table is a SimpleRelationship table that provides a general mechanism for semantic links between metadata instances. A RelType (relationship type) identifier links to a ClassificationConcept that defines the semantics of the relationship. Constraints on kinds of objects that may play the first and second role, and the number of fillers allowed for each role, will eventually be specified by a ValidRelationshipConstraint data structure, but this part of the database is currently being revised and is not described here. This table may be used to implement a many-to-many join between tracking records and citations, project hierarchy (large project with subprojects), organization successor (when an organization changes name), organization aggregation (to represent individual departments as part of a larger organization), StartDate and EndDate links between Person-Organization affiliations and a metadata dates entity, PersonOrg-ContactInformation links to allow multiple contact addresses and types (phone, internet, surface mail...), and Object-LogEntries to allow multiple tracking records to be related to any object, to track revisions, comments, etc. See description of SimpleRelationship table for fields in this table.
Tracking Record Table
The TrackingRecord table keeps a record of the intellectual and physical sources for objects and data by defining links to tables that describe the processes and activities through which data was created. Data objects that have a TrackingID/TrackingDS link are directly linked to a TrackingRecord of TrackingRecordType "OriginTracking" that provides information on the original source of the object. The TrackingRecord data structure includes a link to an Activity (tuple of person, organization, project) responsible for the tracked event, and a link to a ProcessingMethod that describes the procedure used to represent the feature in digital form. Links to citations for publications relevant to the origin of the information are constructed through a MetaDataRelationship link (see MetadataRelationship table).
Tracking records may also be LogEntries that document updates or comments related to any data object. LogEntry tracking records are linked to data objects using a MetaDataRelationship link, allowing a many-to-many relationship between log entries and data objects.
Database Table Fields
- TrackingID/DataSetID: Compound primary key, uniquely identifies each record.
- TrackingRecordTypeID/TrackingRecordTypeDS: Compound foreign key, link to ClassificationConcept that identifies the type of tracking record. See Table 16 for example values.
Table 16. Tracking Record Type codes used in the TrackingRecord table.
[Click HERE for a Word version.]
|
- Name: Text, width 255. Uniquely identifies each origin tracking record and is included for intelligibility.
- LogDate: Date/Time. Records when an entry was created.
- ActivityID/ActivityDS: Compound foreign key, link to Activity in the Activities table that is responsible for the tracked event. See Table 17 for example values.
Table 17. Example Activity ID codes used in the TrackingRecord table.
[Click HERE for a Word version.]
|
- DataProcMethodID/DataProcMethodDS: Compound foreign key, link to a data processing name and definition in the ClassificationConcept table. A complete data processing object define the steps in developing a particular data item (digitized spatial feature, record in a data table) as an ordered aggregation of "DataProcessingSteps" (a MetadataRelationship).
- Description: Memo. Free text description of tracked event, or additional information.
Cartographic Tables
Cartographic Object Table
The CartographicObject table is an implementation-independent representation of symbols used to display points, lines, polygons, and text on a map visualization. This is done by defining links to tables that provide implementation-dependent descriptions of graphical objects used for symbolization. Graphical object tables in this database are designed to describe symbology for ArcView 3.2 running in a Microsoft Windows environment.
Individual cartographic objects may consist of several graphical objects stacked according to the sequence attribute in the table, with the lowest sequence symbol overlain by subsequent symbols in the sequence. A CartographicObject defines links to tables that define implementation-specific graphical objects and colors; these tables are not explained here. The DataSetID for the linked tables serves to indicate what sort of graphical element is being specified.
Geologic structure symbols present a special problem, because a standard strike-and-dip symbol is considered to be the same CartographicObject, irrespective of its orientation, and while the same symbol is used for each measurement location (SpatialObject), the symbol is rotated depending on a value (the azimuth) specific to a StructureMeasurement associated with that SpatialObject. SpatialObject must be joined with CartographicObject through an attributed relationship(s) that includes the rotation value as its attribute. The CartoObjType may be used to determine if the symbolization depends on an AttributedRelationship.
Database Table Fields
- CartoObjID/DatasetID: Compound unique identifier for each Cartographic Object
- TrackingID/TrackingDS: Compound foreign key, link to origin tracking record.
- Sequence: Number, integer. Third part of the compound primary key. Corresponds to the layer order in which graphical elements are created. For example, an ornamented line, such as a line with queries, would be created using two layers. The first layer, the line itself, would have a sequence value of 1, while the second layer, the query symbol, would have a sequence value of 2. Domain: Integers >0 and <108.
- Name: Text, width 255. Uniquely identifies and describes each cartographic object and is included for intelligibility.
- CartoObjTypeID/CartoObjTypeDS: Compound foreign key, link to ClassificationConcept that classifies the graphical element type. It is a foreign key that joins to the ConceptID field of the ClassificationConcept table. See Table 18 for example values.
Table 18. Example cartographic object type codes used in the CartographicObject table.
|
|
|
[Click HERE for a Word version.]
|
- GraObjID/GraObjDS: Compound foreign key, link to a specific graphical element. It is a foreign key that joins to the GraObjID field of either the GraphicLine table (GraObjDS = 26), the GraphicLineOrnamented table (GraObjDS = 412), the GraphicPattern table (GraObjDS = 411), or the GraphicTextFormat table (GraObjDS = 420) (these tables are not described in this document). See Table 19 for example values.
Table 19. Example graphic object codes used in the CartographicObject table.
|
|
|
[Click HERE for a Word version.]
|
- ColorID/ColorDS: Compound foreign key, link to a specific color defined in a Color table (not described in this document).
- OriginDate: Date/Time. Records when the record was created.
- Comment: Memo. Provides additional descriptive information about a record.
Map Legend Table
The MapLegend table contains relationship links between a ClassificationConcept and an implementation-independent CartographicObject used to symbolize objects belonging to the class. A particular map legend may contain only one instance of each symbol included, but different symbols may correspond to the same classification concept (e.g symbols for horizontal, inclined, vertical, and overturned planar bedding). The MapLegend table assigns a Name, Label, and Description for objects of that class which are used to generate the explanation to display on the map. The Sequence field orders items in the legend. Legend items may be present that have no corresponding classification concept; these typically act as headings. The compound key for the MapLegend table is the tuple {MapLegendID, DataSetID, Sequence}. Hierarchy in the legend is represented by a HierarchyRelationship with RelTypeID = MapLegendID.
Database Table Fields
- MapLegendID/DataSetID: First parts of compound key for each MapLegend object.
- TrackingID/TrackingDS: Compound foreign key, link to origin tracking record.
- Sequence: Third part of compound primary key. Orders records with the same MapLegendID/DataSetID values within a legend display.
- ConceptID/ConceptDS: Compound foreign key, link to classification concept that is symbolized by the associated cartographic object in this table.
- CartoObjID/CartoObjDS: Compound foreign key, link to CartographicObject that specifies the symbolization for spatial objects classified to the associated ConceptID for this legend item.
- DispPriority: Long Integer. A priority number that allows the user to specify the order in which objects are drawn when the map is displayed. Objects with larger numbers are drawn on top of, and may hide, objects with smaller numbers.
- DispVisibility: Text, width 1. Determines whether or not a symbol is displayed in the legend. Domain "Y" (the symbol is displayed in the legend); "N" (the symbol remains hidden from view when the legend is displayed).
- ClassName: Text, width 255. The name for the geologic feature represented by the cartographic object (CartoObjID) in this MapView. This is the name associated with the symbol in the map legend graphic.
- ClassLabel: Text, width 16. The label to use in the map display to identify the geologic feature represented by the cartographic object (CartoObjID) in this MapView.
- ClassDesc: Memo. A text block for use in the map legend display that describes the geologic feature represented by the cartographic object (CartoObjID) in this MapView. Generally this description will correspond to the ConceptID that the symbol represents, modified by location and identification accuracy values from the classification scheme.
- OriginDate: Date/Time. Automatically filled with the date and time this record was added to the database.
Map View Definition Table
The MapViewDefinition table defines a Title, Description, Extent, Projection, DesignScale, MapHorizon, ClassificationScheme and MapLegend to use for a particular MapView. A MapView is a collection of SpatialObjects within a bounded area (the Extent), classified using a particular ClassificationScheme, and symbolized using a particular MapLegend. The MapView does not necessarily use all the items in the MapLegend, or all the SpatialObjects classified under the ClassificationScheme. Every ClassificationConcept in the ClassificationScheme that is related to a Spatial-Object included in the MapView must have a CartographicObject assigned by the MapLegend associated with the MapView.
SimpleMapView - All SpatialObjects symbolized in the MapView are entirely within the MapExtent, and the set of CartographicObjects in the MapLegend is the same as the set of Cartographic-Objects used to symbolize spatial objects in the view.
GeneralMapView - SpatialObjects may come from different DataSets that may have extents different from the MapView extent, and the MapLegend may include Cartographic-Objects not used in the MapView. SpatialObjects symbolized in the MapView must be clipped to the MapExtent, and the MapLegend must be filtered to select only the items that appear in the MapView.
The ViewSchemeType in the MapViewDefinition table determines how the MapView is constructed. In addition to specifying if the view is a GeneralMapView or SimpleMapView, the ViewSchemeType also varies along a second dimension based on how the link between Cartographic-Objects and SpatialObjects is defined, as follows:
- DefaultMapView - Represents a default visualization of a geologic data set. Default ClassificationConcepts, CartographicObjects, necessary CartographicObject attributes (e.g rotation for strike-and-dip symbols) and feature-linked annotation (polygon labels, dip values) are assigned using fields embedded in the SpatialObject tables. SimpleRelationship aggregates the DataSets containing the SpatialObjects through a simple relationship of type MapViewID; sequence attribute establishes display order for DataSets. All DataSets contain data within the same MapExtent. The MapLegend can be produced through a query that returns the union of unique ClassificationObject/CartographicObject pairs included in the records for all Spatial-Objects represented in the view. MapLegendID and ClassSchemeID are not required, but a predefined MapLegend is necessary to structure the MapLegend display, display order, and explanatory name, label and text (ClassName, ClassLabel, ClassDesc) for features; otherwise the default legend layout for the particular GIS implementation will be used.
- DirectMapView - MapViewID is a RelationshipType for a SymbolizationScheme Relationship linking SpatialObject with CartographicObject, and MapLegendID identifies the appropriate Map-Legend objects. All CartographicObjects used must be included in the MapLegend. The ClassificationSchemeID link in the MapViewDefinition identifies the classification scheme used as the basis for assigning symbols to spatial objects. The direct scheme is necessary for individually varying symbolization (e.g structure symbols), and also allows for map generalization in which an object classified in the same way may be symbolized differently.
- NADM43MapView - SpatialObjects are linked with ClassificationConcepts through a ClassificationScheme specified by the MapViewDefinition, and ClassificationConcepts are linked with CartographicObjects through the MapLegend. Assignment of CartographicObjects to Spatial-Objects requires two joins, and the ClassificationConcepts used are conceptually equivalent to Cartographic-Objects because, in order to symbolize an object differently, it must be classified differently. Thus, in order to rotate structure symbols to the correct display azimuth, ClassificationConcepts for each azimuth must be generated, or the azimuth attribute of the data to symbolize must be propagated from the structural measurement table, through the SpatialObject, ClassificationScheme link (Spatial-Object-Classification), and MapLegend link (Classification-CartographicObject).
Database Table Fields
- MapViewID/DataSetID: First parts of compound key for each MapView object.
- TrackingID/TrackingDS: Compound foreign key, link to origin tracking record.
- Title: Text, length 255. Records the title displayed on the map view.
- Author: Text, length 255. Records the authorship displayed on the map view. For views that attempt to duplicate a published map, this would be the original authorship of the published map.
- PublicationDate: Date/Time. Records the date of creation of the map view. For views that attempt to duplicate a published map, this would be the original date of map publication.
- Description: Memo. Text description of the map. Could be used to store text blocks for display on the map layout. Should describe purpose of map.
- DesignScale: Number, Long Integer. Records display scale for which map view has been designed. The number is the denominator of the scale fraction. For example, if the map is designed for display at 1:24000, this field would contain the value "24000."
- CatalogLinksDatsetID: Number, Long Integer. Identifier for a simple relationship data set (in DataSetAZ catalog table) that contains set of links of type "MapView components." linking the MapViewID with the DataSetID's for all data sets required to construct the MapView. This aggregation must identify at least the data sets containing spatial data used by the map view, and the relationship tables that contain classification and symbolization links.
- ExtentID/ExtentDS: Compound foreign key, link to an Extent object (in an Extents metadata table) that defines the boundary of the geology displayed in this map view.
- ProjectionID/ProjectionDS: Compound foreign key, link to a projection in a Projection metadata table (not described in this document). The projection describes the mapping between a non-planar map horizon and the planar map view surface.
- MapHorizonDesc: Memo. Description of the map horizon, which is the physical surface that contains the geologic features displayed on this map view. Domain: Free text.
- MapHorizonID/MapHorizonDS: Compound foreign key, link to MapHorizon record in a MapHorizon metadata table (not described in this document). This link defines the base map and representation of the 3-D geometry of the physical surface represented by the map view.
- MapLegendID/MapLegendDS: Compound foreign key, link to the MapLegend aggregation in the MapLegend table. The MapLegendID serves as the filter for selecting ClassificationConcept-CartographicObject links, and identifies the symbols used in the map view.
- ViewSchemeTypeID/ViewSchemeTypeDS: Compound foreign key, link to the classification concept that defines how symbols are assigned to spatial objects for this map view. Domain: 2785 = NADM4.3 type (spatial object-classification, classification-symbol); 2786 = MapLegend and Direct (spatial object-symbol through relationship table); and 3364 = Default (spatial object-symbol through attribute in native spatial object table).
- ClassSchemeID/ClassSchemeDS: Compound foreign key, link to the ClassificationConcept that represents a collection of AttributedRelationship links between spatial objects and classification concepts that assign geologic significance to spatial objects. This value is used as the RelationshipType to select the relevant classification links.
- OriginDate: Date/Time. Extra information field automatically filled with the date and time this record was added to the database.
ACKNOWLEDGMENTS
This database design has been developed over several years with the help of J.P. Thieme and S.M. Kneale. Discussions with Boyan Brodaric, Jon Matti, Gary Raines, and Bruce Johnson have sharpened my thinking and helped develop ideas for this design.
REFERENCES
Bernknopf, R. L., Brookshire, D. S., Soller, D. R., McKee, M. J., Sutter, J. F., Matti, J. C., and Campbell, R. H., 1993, Societal Value of Geologic Maps: Washington, D.C., U.S. Geological Survey Circular 1111, 53 pages.
Brodaric, B., 2000, Digital Geological Knowledge: From the Field to the Map to the Internet, in Soller, David R., Ed., Digital Mapping Techniques '00 -- Workshop Proceedings, U.S. Geological Survey Open-File Report 00-325, p. 3-12, https://pubs.usgs.gov/openfile/of00-325/brodaric.html.
Brodaric, B., and Gahegan, M., 2000, Geoscience Map Data Models, Open Systems GIS and Semantics, Proceedings, GeoCanada2000-The Millennium Geoscience Summit, Calgary, Alberta, p. 7. available at http://www.gisworld.org/gac-gis/2000/1147.pdf, Accessed June 14, 2001.
Brodaric, B. and Hastings, J., 2001, Evolution of an Object-Oriented, NADM-Based Data Model Prototype for the USGS National Geologic Map Database Project [web page, abstract]: Annual Conference of the International Association for Mathematical Geology, IAMG2001, Cancun, Mexico, Available at http://www.kgs.ku.edu/
Conferences/IAMG/Sessions/I/brodaric.html, Accessed June 14, 2001.
Brodaric, B., Journeay, M., Talwar, S., and others, June 18, 1999, CordLink Digital Library Geologic Map Data Model Version 5.2 (Web Page), Available at http://cordlink.gsc.nrcan.gc.ca/cordlink1/info_pages/
English/dm52.pdf, Accessed June 13, 2001.
Johnson, B. R., Brodaric, B., and Raines, G. L., 1998, Digital Geologic Maps Data Model, V. 4.3 (Web Page): Available at http://ncgmp.usgs.gov/ngmdbproject/, U.S. Geological Survey.
Palmer, A.R., compiler, 1983, The Decade of North American Geology 1983 Geologic Time Scale: Geology, v. 11, no. 9, p. 503-504.
Reynolds, S. J., Florence, F. P., Welty, J. W., and others, 1986, Compilation of Radiometric Age Determinations in Arizona: Tucson, Arizona Bureau of Geology and Mineral Technology Bulletin 197, 258 pages.
Richard, S. M., 2000, Proposal for Authorship and Citation Guidelines for Geologic Data Sets and Map Images in the Era of Digital Publication, in D.R. Soller, ed., Digital Mapping Techniques 2000--Workshop Proceedings: U.S. Geological Survey Open-File Report 00-325, p. 159-168, https://pubs.usgs.gov/openfile/of00-325/richard.html.
Richard, S. M. 1999, Geologic concept modeling, with examples for lithology and some other basic geoscience features, in D.R. Soller, ed., Digital Mapping Techniques 1999--Workshop Proceedings: U.S. Geological Survey Open-File Report 99-386, p. 59-75, https://pubs.usgs.gov/openfile/of99-386/richard.html.
Richard, S. M., 1998, Digital Geologic Database Model (Web Page): Available at http://www.azgs.state.az.us/GeoData_model.pdf, Accessed June 13, 2001.
Richard, S. M., and Thieme, J. P., 1997, Data structure for Arizona Geological Survey digital geologic maps: Tucson, Arizona Geological Survey Open-File Report 97-5, 15 p.
Soller, D. R., 1997, Proceedings of a Workshop on Digital Mapping Techniques: Methods for Geologic Map Data Capture, Management, and Publication, Lawrence, KS: U.S. Geological Survey Open-File Report 97-269, 120 p., https://pubs.usgs.gov/openfile/of97-269/.
Soller, D. R., 1998, Digital Mapping Techniques '98 -- Workshop Proceeding, Champaign, IL: U.S. Geological Survey Open-File Report 98-487, 134 p., https://pubs.usgs.gov/openfile/of98-487/.
Soller, D. R., 1999, Digital Mapping Techniques '99 -- Workshop Proceedings, Madison, WI: U.S. Geological Survey Open-File Report 99-386, 190 p., https://pubs.usgs.gov/openfile/of99-386/.
Soller, D. R., 2000, Digital Mapping Techniques '00 -- Workshop Proceedings, Lexington, KY: U.S. Geological Survey Open-File Report 00-325, 210 p., https://pubs.usgs.gov/openfile/of00-325/.
Trapp, R. A., and Reynolds, S. J., 1998, Physiographic areas in Arizona used by the Arizona Geological Survey: Tucson, Arizona Geol. Survey, Digital Information Series DI-10, 4 pages, 1 floppy disc.
Trapp, R. A., Schmidt, N., and Reynolds, S. J., 1996, AZGEOBIB, Version 2.1: A List of References on the Geology of Arizona: Arizona Geological Survey Open-File Report OFR-96-01, p. 308.
RETURN TO Contents
National Cooperative Geologic
Mapping Program | Geologic Division |
Open-File Reports
U.S. Department of the Interior, U.S. Geological Survey
URL: https://pubsdata.usgs.gov/pubs/of/2001/of01-223/richard2.html
Maintained by David R. Soller
Last modified: 18:24:54 Wed 07 Dec 2016
Privacy statement | General disclaimer | Accessibility