
Digital Mapping Techniques '01 -- Workshop Proceedings
U.S. Geological Survey Open-File Report 01-223
Progress Report on the National Geologic Map Database, Phase 3: An Online Database of Map Information
By David R. Soller1, Ron Wahl2, Jerry Weisenfluh3, Boyan Brodaric4, Jordan Hastings5, Robert Laudati6, and Roger Fredericks7
The provisions of the Geologic Mapping Act of 1992 and its reauthorizations in 1997 and 1999 (PL106-148) require the U.S. Geological Survey (USGS) to design and build a National Geologic Map Database (NGMDB), with the assistance of the state geological surveys and other entities participating in the National Cooperative Geologic Mapping Program. After discussion among the principal architects of the NGMDB, a general plan for its initial design and evolution was proposed (Soller and Berg, 1995); minor updates to the plan, enhancements, and progress reports have been presented annually since 1997 (for example, Soller and Berg, 2000, and this volume).
The NGMDB design identifies three complementary phases to the project. Because many geologic maps are not yet in digital form and because many organizations produce and distribute them, it was decided to first identify and catalog all geoscience maps in the United States, in either paper or digital format. This first phase, a searchable map catalog, is the most fundamental aspect of the NGMDB; it enables users to identify whether a map has been produced for their area and/or theme of interest. The map catalog presently is supported by two additional databases developed under the NGMDB project: 1) GEOLEX, a searchable geologic names lexicon; and 2) Geologic Mapping in Progress, which provides information on current mapping projects. When each mapping project concludes, their map products will be entered in the map catalog.
The second phase of the project focuses on public access to digital geoscience maps, which in turn requires the development of certain digital map standards and guidelines to improve the utility of those digital maps. This is an extremely important activity that requires a high level of interaction with all stakeholders to ensure that any proposed standards and guidelines are useful, necessary, and will be widely adopted.
Although these activities produce valuable information for the public and the geoscience community, the ultimate goal of the NGMDB project is to create an online database containing geologic map information that can be queried, customized for display, and downloaded. Further, the map information in the database would be a coherent whole composed of the best information compiled from various map sources. The database would be updated as new maps are published and so could be termed a "living", or dynamic database. The design and implementation of this database constitutes the project's third phase. Work on the third phase has begun, and is the subject of this paper.
GENERAL CONCEPTS AND REQUIREMENTS
The general concepts and requirements of the third phase are provided in Soller and others (2000). Numerous discussions with geoscientists and the general public have determined that this database should be:
- built from edge-matched geologic maps at various scales (mostly standard scales such as 1:100,000 and 1:24,000, but not excluding other scales),
- managed and accessed as a coherent body of map information, not just as a set of discrete map products,
- updated by mappers and/or a committee, "on the fly" when new information becomes available, with the "old" original data available as a version,
- standardized, adhering to a standard data model and with standard scientific terminology and symbols, and
- available to the public via Internet browsers and common GIS tools (e.g., ArcExplorer).
FIRST STEPS IN BUILDING THE DATABASE
Designs and implementations for this database are being evaluated through a series of prototypes. Each prototype is designed to prove key technical concepts, forge relations and agreements among the contributors to this database (i.e., principally, the nation's geological surveys), and amass a growing collection of geologic map information. In 1999, basic requirements for a prototype geologic map database were designed, and concepts were tested using some newly-developed digital data for the Greater Yellowstone Area of Wyoming and Montana (Wahl and others, 2000). That first prototype was presented for discussion at the Geological Society of America Annual Meeting, in October, 1999. The prototype was well-received, and plans were begun for a second prototype, with a more complex set of tasks.
In late 1999, a series of planning meetings occurred between the USGS, the Kentucky Geological Survey (KGS), and representatives of various state constituency groups, universities, and vendors. Following the meetings, the second prototype was designed. This effort involved a broad spectrum of expertise and cooperators, as indicated by the list of authors. The various parties agreed to this work because Kentucky has:
- a large amount of detailed (1:24,000-scale) map data available, which had been standardized and edge-matched into 1:100,000-scale quadrangles,
- a strong interest in designing a prototype and implementing a standard data model, and
- proven statewide economic benefits from the geologic mapping.
In 2000, funds were secured, contracts were written, and the work began in mid-year. The results of this "Kentucky prototype" are discussed in detail below.
Objectives of the "Kentucky" Prototype
The specific objective of the Kentucky prototype was to test applicability of the Greater Yellowstone Area research results in a production geologic mapping environment at the state level. Also, we intended to develop a firm foundation upon which subsequent prototypes are based, so that a publicly-accessible, online "living" NGMDB would evolve. After some preliminary work, the objective was refined into four tasks:
- Implement the North American draft standard conceptual geologic map data model, in an object-oriented software architecture (in this discussion, the term includes object-relational architecture). The current version of the data model endorsed by the North American Data Model Steering Committee (http://geology.usgs.gov/dm/), v.4.3, is relational. An object-oriented architecture was selected in order to explore its potentially greater facility for representing and managing complex spatial information. Because the map database may contain multiple source maps and multiple versions of maps generated as each map is compiled into the database, the selected O-O system must be capable of managing multiple versions of each object on a map (e.g., the outcrop belt of the "X" Formation as shown on various maps of a region), and a large number of editorial changes to each object as submitted by various authors, compilers, and editors.
- Manage information derived from multiple source maps. The KGS is conducting a program to convert to digital form the entire statewide coverage of published,1:24,000-scale geologic maps (Anderson and others, 1999). For this prototype, a few quadrangles were used, to demonstrate the system's capability.
- Develop and demonstrate in the database certain core capabilities for data management and user access. For example:
- Demonstrate links between the prototype map database and related geoscience databases (i.e., the KGS oil and gas database, the USGS geologic names lexicon). Conceptually, the user could select a map unit and, upon request, view the summary of information about the unit's geologic name, which is stored in a separate database.
- Develop the capability for users to extract selected areas of the prototype map database for downloading to a personal computer, in a selectable file format (e.g., georeferenced image or ArcView shapfiles).
- Evaluate the interagency, collaborative nature of this effort, especially mechanisms by which agencies can retain ownership of their data when held in a jointly-built database.
The first task, implementing an object-oriented data model and demonstrating its compliance with the North American Data Model, was emphatically the principal and overriding concern of this prototype.
Results
A preliminary presentation of the Kentucky prototype was made during the annual NGMDB evening presentation at the Geological Society of America's Annual Meeting in November, 2000. In the months following, the prototype system was designed and made available for demonstration and public comment at the Digital Mapping Techniques 2001 meeting. Below, progress toward the prototype's objectives is described.
- Implementing the North American draft standard conceptual geologic map data model in an object-oriented architecture
The first objective, implementation of an object-oriented data model and demonstrated compliance with the North American Data Model, was completed. A summary of this data model is provided in Hastings and Brodaric (2001), and briefly excerpted:
"The NADM v4.2 and v4.3 models were explicitly designed in an ERD-like notation, and have been implemented on traditional, relational DBMS platforms. The Canadian v5.x extensions had an object-oriented "flavour", although these, too, were realized in relational software. By contrast, our recent work for the NGMDB project is firmly object-oriented, and also seeks such an implementation. In this new conception, a geologic map database comprises four (near) top-level classes of objects:
- Symbols: The cartographic notations used to depict objects (explicit in the map legend and on the map figure)
- Concepts: The geologic formalisms selected for representation, e.g. formation and lithologic types (implicit in overall map construction)
- Occurrences: The geologic realities recognized in the field, and/or laboratory (summarized in the map legend, and/or exemplified on the map figure)
- Descriptors: the digital values chosen to characterize map Symbols, Concepts, and Occurrences (commonly apparent/derived from the map narrative).
These four meta-objects are related in the model's core "diamond diagram" (Figure 1). In summary, map Symbols cartographically depict both Concepts and Occurrences in manifold ways. Occurrences may be symbolized on the map figure, or, if (too) numerous, small, dense or sparse, etc., may be classified and symbolized as a group Concept through the legend. Descriptions, which may be either incidental or normative, can be applied to Concepts and Occurrences equally, and also to Symbols as needed. This entire meta-structure is infinitely mutable, but operates essentially in two major directions: elaboration of Concepts, which leads into geologic ontology (what we know); and elaboration of Occurrences, which leads into geologic epistemology (how we know)."
|
|
Figure 1. Core of the geologic map information meta-model. The rectilinear arrows indicate relationships between meta-objects, and the reflexive arrows indicate self-referential hierarchies within the meta-object classes.
|
This data model was implemented in a mature object-oriented GIS/database, GE-Smallworld. [See details at http://www.gepower.com/prod_servv/products/gis_software/en/]. This software, widely used for intricate map/database management in the electric utility industry, was tested for its applicability to geologic objects (i.e., features such as faults, contacts, and map units, and also regional names and sampling points). Preliminary results are encouraging, and the software will be further explored in the next prototype.
- Managing information derived from multiple source maps
The second objective also was completed, by loading four adjacent 1:24,000-scale geologic quadrangle maps and managing them as both discrete entities and as a coherent whole. In the future, a substantial number of such maps in Kentucky will be loaded into the system, to evaluate the ability to manage, query, and display a large collection of map data.
- Developing and demonstrating in the database certain core capabilities for data management and user access
The third objective was addressed via a demonstration of typical queries and functions that are made feasible with this data model and software (including the examples noted in Objectives, above). The demonstration was patterned on a typical user session, as follows:
- Display an orienting map showing available data
- Select a map area, zoom and pan
- Display and query external databases
- Perform spatial analyses
- Create derivative maps from analyses
- Export selected map data
- View exported map data in third-party GIS viewer.
The demonstration was conducted live, over the Internet, with a laptop "user" computer in Tuscaloosa, Alabama accessing the GE-Smallworld map server at the USGS offices in Denver, Colorado via a T-1 (1.544 Mbps) line. Several members of the audience remarked that performance was excellent.
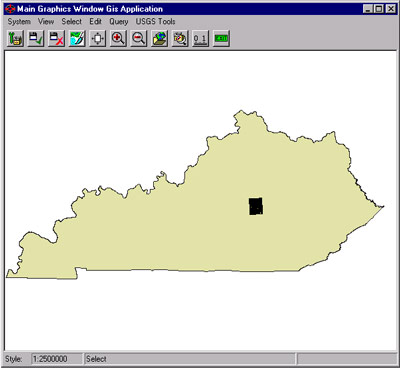
- Display an orienting map showing available data: Figure 2 shows an overview map of Kentucky with the available map data highlighted. This demonstrates a fundamental point - maps can be nested (i.e., a map of maps) and inter-related. Also, the system needs to store map footprints, as well as base maps, in the data model; these map objects can be related to metadata about the source documents to facilitate map-based queries.
|
Figure 2. Overview map showing prototype map area. [Task - demonstrate capability to display area of interest.]
|
|
|
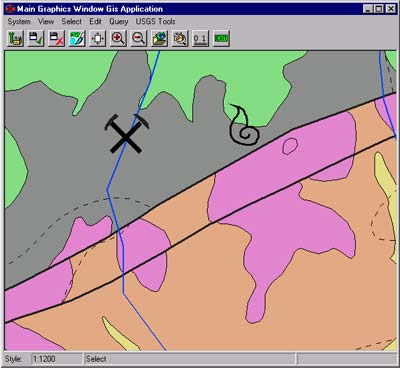
- Select a map area, zoom and pan: Figure 3 is a detailed view of the map area selected in step 1. To facilitate readability during zoom operations, the level of geologic detail must be appropriate to the map view (i.e., at larger scales, more detail is revealed). This requires several levels of map detail that can be accessed as the user increases the magnification. Also, map symbology must be scale-sensitive, thereby allowing the cartographic display to change according to the zoom level. In this demonstration, geologic features were assigned scale-dependent symbolization at the system level. Alternatively, software methods could be designed to achieve this functionality.
|
|
Figure 3. Detailed map area showing more features, including map units, geologic contacts, faults, structure contours, point features, and streams. [Task - demonstrate capability to zoom and pan.]
|
- Display and query external databases: To maximize the utility of a geologic map database, it must be useable in concert with the variety of other spatial and non-spatial databases (e.g., census/demographic and economic data; topographic and hydrologic data; and geoscience data including engineering, mineral occurrence, and seismic). Already, and increasingly in the future, access to these databases is via the World Wide Web. Accordingly: a) the geologic map display and database should be Web-enabled; b) there must be stable links to external databases; and c) the system must display, read, and manipulate spatial data in foreign formats. In the demonstration, two external databases were remotely accessed, and queried, in concert with the geologic map data (Figures 4a and 4b). The dynamic link to these databases was demonstrated by the instantaneous update of the display following modification of the external oil and gas database shown in figure 4a.
|
Figure 4a. Further detail of map area and a set of oil wells, whose information is maintained in an external relational database managed by the Kentucky Geological Survey. [Task - display and use various external data, without importing it into the data model.]
|
|
|
Figure 4b. Dynamic linkage from a selected geologic map unit to the corresponding entry in the NGMDB's Geologic Names Lexicon ("Geolex"), which is maintained by USGS on an Oracle server in Flagstaff, AZ. [Task - display and use various external data, without importing it into the data model.]
|
- Perform spatial analyses: New thematic information and interpretations can be derived from geology and other databases, on-the-fly. This is perhaps the most critical function of an online, user-accessible map database; it must be an efficient and user-friendly process, otherwise the map database serves as little more than a digital storehouse for previously-published maps. Figure 5 displays the map database (with rock units reclassified by lithologic composition) and external databases (oil and gas wells, and stream traces). The spatial analysis accessed information from all databases and returned a result that identified karst-prone geologic units that were proximal to oil and gas wells.
|
|
Figure 5. Analysis performed simultaneously on the map database and on external data. Pertinent questions might include: have active oil wells been spudded in a karst-prone unit, such as limestone? are streams near enough to transmit contaminants downstream to other karst-prone units? [Task - perform spatial analysis on map data and on various external data.]
|
- Create derivative maps from analyses: In order to generate a derivative map from database queries and analyses, either the user must compose a suitable map legend and symbology, or else the system must be capable of dynamically generating this information. The latter approach provides a powerful tool for the user, but it requires a system and data model capable of traversing and interpreting relations among the various data and data model tables. Figure 6 shows a map of primary lithology, where the symbology is automatically generated.
|
Figure 6. A map of primary lithology, automatically derived from the map database. The map extent can be defined to be the map boundary, the GIS view extent, or some arbitrary, user-designated boundary. [Task - create derivative maps from the spatial analysis.]
|
|
|
- Export selected map data: A database is most useful if data can be exported from it and imported into software of the user's choice, there to be manipulated in ways perhaps not anticipated by the database managers. These exported data can be either "raw" contents from the map database, or derivative information created by queries and analyses (above). To enable this feature:
- the system must be capable of reading and writing a wide variety of common standard file formats (i.e., investments in computer equipment and personnel training must be respected),
- the database system administrators must identify the appropriate data fields to be exported with various types of spatial data (e.g., all fields, or those judged to be pertinent and/or permitted to the type of spatial data requested for export), and
- strong coordination must exist among cooperating agencies and users, in order to ensure success of the above two items.
The prototype system uses a well-known import/export tool, FME (Feature Manipulation Engine, ), with support for essentially all the common GIS file formats.
- View exported map data in third-party GIS viewer: The selected set of map data represented by Figure 6 was exported to ESRI shape-file format, downloaded from the Web server to a local desktop computer, and viewed in ArcView (Figure 7). The downloaded data were then completely available to the user for further local analysis and display. [These data also can be used in many other commercial and freely-distributed software products.]
Figure 7. From the central map database to a local desktop, the derivative map may be exported to other GIS formats (for example, to ArcView, as shown here), to be available for further analysis by the end-user. [Task - export, view, and use the map data on the local desktop.]
|
- Evaluating the interagency, collaborative nature of this effort
As stipulated in the Geologic Mapping Act, the NGMDB is intended to be a State-Federal collaboration. It is therefore essential that each prototype draw together the collaborators, to ensure that together they study the project goals and the available technology, and define the scope of their involvement in it. This is perhaps the most important and challenging, yet ultimately rewarding, aspect of the project. The Kentucky prototype fulfilled this objective by bringing together a diverse group of scientists and technical experts to address the needs of both the Kentucky Geological Survey and the NGMDB. Although it is premature to describe the eventual design and content of this online database, the working relations built during this prototype indicate that a national, jointly-built and maintained database is feasible.
CONCLUSIONS
The Kentucky prototype demonstrates that a multi-map database supported by robust object-oriented concepts and technology can provide users with simple data access, complex queries, and derivative information and maps. This prototype begins to explore the nature of a mature system, where data can be exported, edited, and replaced into the database (i.e., a "closed loop"). Subsequent prototypes will further test the technology to develop a user-accessible database, and will explore among the NGMDB partners the extent to which this online database will serve the needs of both partners, their prospective customers, and the general public.
REFERENCES
Anderson, W.H., Sparks, T.N., Patton, J.A., Yang, Xin-Yue, and Sergeant, R.E.,1999, Integration of Relational Geologic Databases and a Spatial Map Database in Kentucky, in D.R. Soller, ed., Digital Mapping Techniques '99 - Workshop Proceedings: U.S. Geological Survey Open-File Report 99-386, p.123-125, https://pubs.usgs.gov/openfile/
of99-386/anderson1.html.
Hastings, Jordan, and Brodaric, Boyan, 2001, Evolution of an Object-Oriented, NADM-based Data Model Prototype for the USGS National Geologic Map Database Project: Proceedings of the 2001 Annual Conference of the International Association for Mathematical Geology, Sept. 6-12, Cancun, Mexico http//www.kgs.ukans.edu/Conferences/IAMG/Sessions/l/brodaric.html.
Soller, D.R., and Berg, T.M., 2000, The National Geologic Map Database: A Progress Report, in D.R. Soller, ed., Digital Mapping Techniques '00 - Workshop Proceedings: U.S. Geological Survey Open-File Report 00-325, p.27-30, https://pubs.usgs.gov/openfile/of00-325/soller2.html.
Soller, D.R., and Berg, T.M., 1995, Developing the National Geologic Map Database: Geotimes, v. 40, no. 6, p. 16-18.
Soller, D.R., Berg, T.M., and Wahl, Ron, 2000, Developing the National Geologic Map Database, Phase 3 - An Online, "Living" Database of Map Information, in D.R. Soller, ed., Digital Mapping Techniques '00 - Workshop Proceedings: U.S. Geological Survey Open-File Report 00-325, p.49-52, https://pubs.usgs.gov/openfile/of00-325/soller4.html.
Wahl, R.R., Soller, D.R., and Yeldell, Steven, 2000, Prototype Implementation of the NADMSC Draft Standard Data Model, Greater Yellowstone Area, in D.R. Soller, ed., Digital Mapping Techniques '00 - Workshop Proceedings: U.S. Geological Survey Open-File Report 00-325, p.57-63, https://pubs.usgs.gov/openfile/of00-325/wahl.html.
RETURN TO Contents
National Cooperative Geologic
Mapping Program | Geologic Division |
Open-File Reports
U.S. Department of the Interior, U.S. Geological Survey
URL: https://pubsdata.usgs.gov/pubs/of/2001/of01-223/soller2.html
Maintained by David R. Soller
Last modified: 18:24:45 Wed 07 Dec 2016
Privacy statement | General disclaimer | Accessibility