Open-File Report 02-396
CRUISE REPORT
RV MOANA WAVE CRUISE M-1-02-GM
June 17, through July 9, 2002 Pensacola, FL to Pensacola, FL
James V. Gardner-1, John E. Hughes Clarke-2, Larry A. Mayer-3,
This report is preliminary and has not been reviewed for conformity with U.S. Geological Survey editorial standards or with the North American Stratigraphic Code. Use of trade, product, or firm names in this report is for descriptive purposes only and does not imply endorsement by the U.S. Government.
| Background |
| Objectives |
| The Kongsberg Simrad Systems |
| Data Transformations |
| Patch Test |
| Navigation Filtering |
| Refraction Issues |
| Data Processing |
| The Maps |
| Daily Log |
| Cruise Participants |
| References |
| Appendix |
The mid to outer continental shelf off Mississippi-Alabama and off northwest Florida were the focus of US Geological Survey (USGS) multibeam echosounder (MBES) mapping cruises in 2000 and 2001 (Fig. 1, 141kb), respectively. These areas were mapped to investigate the extent of "deep-water reefs" first suggested by Ludwick and Walton (1957). The reefs off Mississippi and Alabama were initially described in water depths of 60 to 120 m (Ludwick and Walton, 1957) but the 2000 mapping found reef and hardgrounds to be much more extensive than previously thought (Gardner et al., 2001). The persistent trend of reef-like features along the outer shelf of Mississippi-Alabama suggested the trend might continue along the northwest Florida mid and outer shelf so a MBES-mapping effort was mounted in 2001 to test this suggestion. It is critical to determine the accurate location, geomorphology, and types of the ridges and reefs that occur in this region to understand the Quaternary history of the area and to assess their importance as benthic habitats for fisheries. The 2001 survey found a series of shelf-depth platforms with ridges (possibly reefs) constructed on their surfaces (Gardner et al., 2002).
The area known as the "head of De Soto Canyon" is the large unmapped region between the 2000 and 2001 mapped areas. The head of De Soto Canyon is an outer shelf zone with a relatively steep western wall and a much gentler eastern wall (Fig. 1, 141kb). It was unknown prior to this cruise whether the reefs of the Mississippi-Alabama shelf continue eastward into the head of De Soto Canyon and connect with the ridges and reefs mapped on the northwest Florida outer shelf. The existence of carbonate-cemented latest Quaternary to Holocene sandstones along the western wall of the head of De Soto Canyon (Shipp and Hopkins, 1978; Benson et al., 1997; W.W. Schroeder, personnel comm., 2002) is of interest because of the potential benthic habitats they may represent.
Precisely georeferenced high-resolution mapping of bathymetry is a fundamental first step in the study of an area suspected to be critical benthic habitats. Morphology is thought to be critical to define the distribution of dominant demersal plankton/planktivores communities. Community structure and trophodynamics of demersal fishes of the outer continental shelf of the northeastern Gulf of Mexico presently are focuses of a major USGS research project. A goal of the project is to answer questions concerning the relative roles played by morphology and surficial geology in controlling biological differentiation. Deep-water ridges, reefs, and outcrops are important because they are fish havens and key spawning sites, and are critical habitats for larval, juvenile, and economically important sport/food fishes.
The few deep-water reefs investigated by biologists off Mississippi-Alabama and northwest Florida revealed a lush fauna of ahermatypic hard corals, soft corals, black corals, sessile crinoids and sponges, that together form a living habitat for a well-developed fish fauna (KJ..Sulak, personnel comm., 2001). The fish fauna comprises typical Caribbean reef fishes and Carolinian shelf fishes, plus epipelagic fishes, and a few deep-sea fishes. The base of the megafaunal invertebrate food web is plankton, borne by essentially continuous semi-laminar currents generated by eddies spawned off the Loop Current that periodically travel across the shelf edge.
The head of De Soto Canyon has not been adequately mapped in the past 50+ years. Early mapping studies concentrated on the section of the canyon south of 29o30'N (Jordon, 1951; Harbison, 1968) or on the west wall (McBride and Byrnes, 1995). The shaded-relief image shown in Figure 1 was created from data from the NOAA GEODAS dataset (see references) but the resolution of these data is not sufficient to perform detailed geomorphological analyses. The existing bathymetric maps of the area (NOS NH16-5 and NOS NH16-8) were published in the 1970s and show no geomorphic expressions of outcrops or bathymetric irregularities.
This cruise is the result of a partnership composed of the USGS and the Minerals Management Service formed to complete the mapping of the 50- to 150-m zone of the mid and outer continental shelf of the northeastern Gulf of Mexico. The mapping was carried out under a Cooperative Agreement between the Center for Coastal and Ocean Mapping, University of New Hampshire and the USGS.
The objective of the cruise was to map the region between the 50- to 150-m isobaths from the eastern edge of the 2000 survey to the western edge of the 2001 survey. The mapping was accomplished with two state-of-the-art multibeam mapping systems (MBES). The cruise used both a Kongsberg Simrad EM3000D and EM1000 MBES owned and operated by C&C Technologies, Inc., Lafayette, LA and installed on the RV Moana Wave. Both MBESs simultaneously produce geodetically accurate georeferenced bathymetry and coregistered, calibrated, acoustic backscatter data. These data will be used to guide future remotely operated vehicle photographic and video surveys to relate dominant species groups to the geomorphology (e.g., hardgrounds, ridge/reef crest, ridge/reef/canyon wall, etc.).
EM3000D
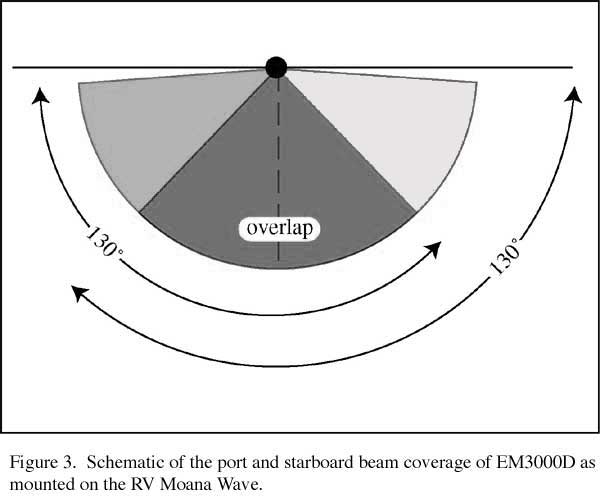
The EM3000D consists of two EM3000 transducers; one mounted facing to port and the other to starboard (Fig. 2, 21kb), each tilted 21o from the vertical. Each transducer provides up to 127 receive beams that span from +65o to -65o to the normal to the transducer (Fig. 3, 24kb) with a 60o overlap zone. To minimize port and starboard transducer interference, each transducer uses a different frequency. The port transducer used the lower frequency of 293 kHz, and the starboard transducer used 307 kHz.
Beam Spacings
The beams from each receiver are spaced according to the angular equivalent of the bins in a spatial Fast Fourier Transform (FFT) across the receive array. This results in a beam spacing that is neither equiangular nor equidistant because the beam angular spacing increases with range. The beam spacing orthogonal to the transducer face is 0.9o and increases with the secant of the beam steering angle. For a single EM3000 transducer, the resulting beam spacing at 60o is 1.8o apart, whereas for the dual transducer EM3000D with a mount angle of 21o, the beam spacing is only 1.04o At the maximum use angle of 75o from the orthogonal to the transducer face, the beam spacing for an EM3000D is 1.27o, with a resulting beam spacing that corresponds to 36% of the water depth (compared to only 1.6% at nadir). The spatial resolution in the bathymetric data is highly variable across the swath, ranging from excellent at nadir to poor in the outermost swath. This variable spatial resolution results in unusually poor small-scale resolution in bathymetry for the low grazing-angle solutions a far range. However, as will be discussed below, the backscatter imaging actually improves toward the low grazing angles. Because the beam spacing is fixed with reference to the array (because the FFT beam forming is accomplished according to the array element spacing), the physical beams rotate with the transducer during a vessel roll. Consequently, no electronic roll stabilization of the array can be attempted so vessel roll is compensated for in the processing.. In practice, because the combined beams from both transducers cover a sector from +95o to -95o, the beams within the usable sector are retained. Also, depending on the sound speed at the transducers, not all the beam locations (spatial frequency indices in the FFT) actually correspond to physically realizable angles in front of the receive array. In fact, only rarely will the system receive from all 127 beams.
Beam Widths
The transmit beam width of the EM3000D is 1.5o by ~140o for each transducer. The receive beams are all formed from a linear receive array so the narrowest beams are formed at broadside (in this case at +30o and -30o off the vertical). The beam widths grow with the secant of the transducer-relative steering angle. The dual-transducer EM3000D mounted at 21o requires only 21o of beam steering to project to 60o off vertical and generates a 1.73o beam at this angle, whereas a single-transducer EM3000 beam at 60o from the vertical would generate a beam width of 3.0o. At the widest-angle data used (~75o off vertical,) the receive beam widths of the EM3000D are only 2.12o.
Pulse Width and Bandwidth
The EM3000 allows user-selectable pulse widths from 0.05 to 0.20 ms and receive bandwidths from 4 to 8 kHz. In principle, these could be varied with water depth, going from shortest pulse length and broadest bandwidth at shallow depth, etc. However, it is clear that these changes are not properly compensated for in the EM3000 backscatter strength estimates. To avoid this problem, the pulse width was set at 0.15 ms and bandwidth at 8 kHz for all operations.
Together, the two transducers of the EM3000D, mounted as described above, should capture any echo over an arc from +95o to -95o. Obviously, for most of the shelf, no echoes exist above the horizontal. Operationally, if the sonar were to wait for echoes that might occur above 80o off the vertical, the ping rate would be greatly reduced. A feature of the EM3000 allows the sonar to wait for arrivals out only to an operator selectable incidence angle (measured with respect to the vertical). This allows the ping rate to be kept to reasonably fast limits. This also prevents acquisition of data at grazing angles that are unrealistic because of signal-to-noise levels. In addition, as the water depth gets deeper, attenuation quickly reduces the signal-to-noise level and the swath angular sector rapidly narrows. One drawback of the user-selectable sector is that the sonar waits for, and tries to process, echoes out at the operator-selected angle even though in deeper water there is nothing but noise from the far ranges. This results in very low ping rates and a high percentage of unreliable bathymetric data that must be edited out. For example, below ~80m, the only data recovered was within ~+40o to -40o of nadir, resulting in complete overlap between the two sectors.
Data output
The EM3000D provides a single depth telegram corresponding to the summed 254 possible beam locations. Each of the central overlapping beams overlaps adjacent beams. The sonar can achieve ping rates faster than 7 Hz in water depths shallower than 10 m.
EM1000
The EM1000 MBES is a 95-kHz system that uses a single transducer (Fig. 2, 21kb) hull mounted just off the keel of the RV Moana Wave. The EM1000 is similar in many aspects to the EM3000 except in frequency and pulse length. This system receives acoustic returns on 60-2.5ox2.5o beams, providing a 150o swath at maximum. The lower frequency and larger pulse length of the EM1000 compared to the EM3000 allows the EM1000 system to map areas deeper than 100 m, a zone below which the EM3000D does not perform well. The EM1000 also simultaneously produces geodetic-quality bathymetry and co-registered acoustic backscatter. The EM3000D and EM1000 MBESs were operated together and recorded separately to ensure the highest resolution data were recorded without data gaps, especially in water depths deeper than 100 m..
Ancillary Systems
In addition to the multibeam sonar array, a MBES survey requires a careful integration of a number of ancillary systems. These include: (1) A DGPS-aided inertial navigation system (INS); (2) an accurate measure the heave, pitch, roll, and heading of the vessel, all to better than 0.02o and the transformation of these measurements to estimates of the motion of the transducer at the times of transmission and reception (motion sensor); (3) a method to precisely determine the sound-speed structure of the water column, using measurements of temperature and salinity with depth or directly measuring sound speed versus depth.
Attitude Compensation
The head of De Soto Canyon survey was navigated with a DGPS-aided inertial navigation system using a TSS Applanix POS/MV model 320 (version 2) inertial motion sensor (IMU), dual Trimble model 4000 DGPS receivers, and commercial C-Nav satellite differential stations. Spatial accuracy (positions) for the mapping is ±0.3 m using these systems. In addition, the POS/MV records vehicle motion (pitch, roll, heading, and heave) at 100 Hz with an accuracy of 0.02° for roll, pitch, and heading, and 5% of heave amplitude or 5 cm, which ever is greater.
Sound Speed in WaterColumn
Sound-speed profiles were calculated several times each day so that ray-tracing techniques could be used to correct refraction of the acoustic wave through the water column. A SeaBird model 19-02 CTD (conductivity and temperature versus depth) was used to measure temperature and salinity versus depth and sound speed versus depth was calculated from these measurements. An additional sound-velocity sensor was installed on the RV Moana Wave to continuously determine the speed of sound in water at the transducer depth. All the sound-speed data (SVP) are fed directly into the Simrad processors for instantaneous beamforming and raytracing of the individual receive beams of both systems.
Data Sources and Type
Raw EM3000D and EM1000 data telegrams were acquired over a shipboard Ethernet network. A data stream is outlined in Table 1. In addition, a number of ancillary data sources were also acquired by C&C Technologies (Table 2).
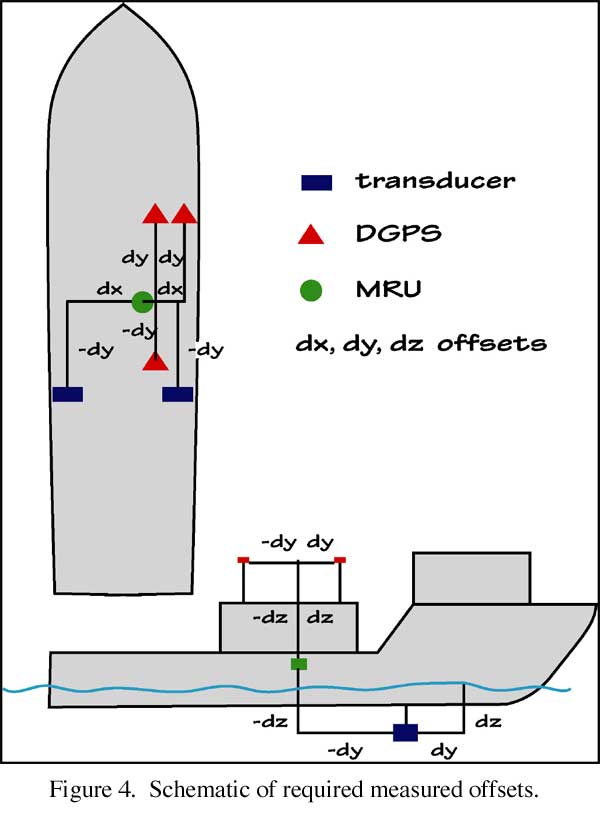
The accurate reduction of swath bathymetric data critically depends on a proper knowledge of the geometry and relative positions of the sonar transducer relative to the motion sensor, the ship, and the positioning-system antennae (Fig. 4, 32kb). C&C Technologies, using standard surveying techniques, measured these values (Table 3) before the survey began. All values are measured relative to the transducer.
Table 1. Kongsberg Simrad data stream.
| Entered static sonar alignment parameters. |
| Applied sound velocity profiles. |
| External navigation data (1-Hz DGPS) |
| Ship-relative bathymetric profile data. |
| Beam-relative backscatter intensity data |
Table 2. Ancillary data sources
| Transducer temperature, conductivity and (derived) sound speed data. |
| POS/MV 1-Hz position and attitude data . |
| Independent serial record of DGPS data stream (GPGGA format). |
| Original SeaBird SVP data |
Tides
At sea two separate tide corrections were used. During the major portion of the survey, initial processing used predicted 6-min tides from the Panama City Beach, FL tide station (872-9210). The predicted tide amplitudes were reduced by 4% with no time corrections, based on the suggestion by NOAA's Office of Tides. The corrections compensate for the distance to the operating area from the two tide stations. About 24 hr after the data collection, measured 6-min tides from the Panama City Beach tide station were emailed to the ship by NOAA. Periodically throughout the cruise, predicted and measured tides for a 24-hr period were compared. The phase between the two tide data never differed by more than 1 minute and typically the maximum tide amplitudes differed by less than 12 cm (Fig. 5, 26kb).
Bathymetry
All bathymetric data were adjusted through Kongsberg Simrad software for (1) transducer draft, (2) static roll, pitch and gyro misalignments, (3) roll at reception, (4) refracted ray path, and (5) beam steering at transducer interface. Post-logging transformations included (1) transformation of navigation from antenna to transducer, (2) correction for positioning to sonar time shifts, (3) tide, and (4) any unaccounted-for static attitude misalignments. The offsets applied to each MBES system are shown in Tables 3 and 4.
| Forward (X) | STRB(Y | Downward(Z) | |
|---|---|---|---|
| POS. Port 1 | 0 | 0 | 0 |
| POS. Port 3 | 0 | 0 | 0 |
| POS. Port 4 | 0 | 0 | 0 |
| POS. Ethernet | 0 | 0 | 0 |
| Sonar Head 1 | -4.89m | 4.42m | |
| Sonar Head 2 | -0.58m | -4.92m | 4.43m |
| Motion Sensor | 0 | 0 | 0 |
| Water Line | 0 | 0 | 1.5m |
| Roll (deg) | Pitch (deg) | Heading (deg) | |
|---|---|---|---|
| Sonar Head 1 | 20.65 | -1.5 | 0 |
| Sonar Head 2 | -21.00 | -1.5 | 0 |
| Roll (deg) | Pitch (deg) | Heading (deg) | ||
|---|---|---|---|---|
| Offset Angles | - | 0 | 0 | 0 |
| Delay | 0 | - | - | - |
| Roll Scaling | 1.0 | - | - | - |
| Roll (deg) | Pitch (deg) | Heading (deg) | |
|---|---|---|---|
| Sonar Head 1 | 20.65 | -1.5 | 0 |
| Sonar Head 2 | -21.00 | -1.5 | 0 |
GAMS Parameter Setup
| 2-antenna separation | 1.9968 m |
| heading calibration threshold | 1.0' |
| heading correction | 0.0' |
Tables 4. Offsets to EM1000 sensor alignments on the RV Moana Wave
| Forward (X) | STRB(Y | Downward(Z) | |
|---|---|---|---|
| POS. Port 1 | 0 | 0 | 0 |
| POS. Port 3 | 0 | 0 | 0 |
| POS. Port 4 | 0 | 0 | 0 |
| POS. Ethernet | 0 | 0 | 0 |
| Sonar Head 1 | -0.59m | -4.89m | 4.42m |
| Sonar Head 2 | -0.58m | -4.92m | 4.43m |
| Motion Sensor | 0 | 0 | 0 |
| Water Line | 0 | 0 | 1.5m |
| EM1000 | 4.0m | -1.6m | 4.78m |
| Roll (deg) | Pitch (deg) | Heading (deg) | |
|---|---|---|---|
| Sonar Head 1 | 20.65 | -1.5 | 0 |
| Sonar Head 2 | -21.00 | -1.5 | 0 |
| EM1000 | -0.35 | 0 | 0.5 |
| Roll (deg) | Pitch (deg) | Heading (deg) | ||
|---|---|---|---|---|
| Offset Angles | - | 0 | 0 | 0 |
| Delay | 0 | - | - | - |
| Roll Scaling | 1.0 | - | - | - |
| Bk Skater offset | Serial Number | Xmitt frequency (kHz) | |
|---|---|---|---|
| Sonar Head 1 | 0 | 604 | 307 |
| Sonar Head 2 | 0 | 605 | 293 |
| Seabird A | - | 1174 | - |
| Seabird B | - | 2645 | - |
Incoming positioning delay = 0.00
Backscatter
The Kongsberg Simrad MBESs provide a backscatter-intensity time series for each reception for each individual beams. A set of required backscatter data transformations is performed by specialized software written by the Ocean Mapping Group at the University of New Brunswick (Table 5). The transformations include conversion of each beam backscatter time series to a horizontal range equivalent, compiling the beam traces together to produce one full slant-range-corrected trace, and removal of residual beam-pattern effects. Although the system software corrects for average beam pattern, there are ± 2 dB ripples in the average beam pattern that vary from transducer to transducer.
The approach to processing backscatter was to stack several thousand pings to view the angular variation of received backscatter intensity as a function of beam angle. Inherent in this function is both the transmit and receive sensitivities, as well as the mean angular response of the seafloor. We then invert this function to minimize the beam pattern and angular variations.
Kongsberg Simrad uses a variable gain within 15° of vertical to reduce logged dynamic range at nadir and near-nadir. The backscatter data at this stage have had a Lambertian response backed out and the beam pattern has been corrected with respect to the vertical and all receive beams have been roll stabilized. Consequently, corrections have been made for variations in the beam-forming amplifiers but not variations in the stave sensitivities of the physical array. Additional transformations were required to produce calibrated backscatter measurements. These include (1) removal of Lambertian model, (2) true seafloor slope correction, (3) refracted ray-path correction, (4) residual beam-pattern correction, and (5) aspherical-spreading corrections.
Table 5. Corrections applied to each beam for backscatter.
| Source power adjustments. |
| Spherical spreading compensation. |
| Attenuation compensation (using operator entered 30 dB per km.). |
| TVG adjustments. |
| Designed beam-pattern compensation. |
| Calculation of insonified area (assuming a flat seafloor at the nadir depth). |
| Application of a Lambertian model using flat seafloor equivalent grazing angles) to reduce the dynamic range of the data (stored at 8 bit (0= -128dB, 255 = 0 dB.). |
Despite the careful measurements of transducer alignments and offsets, the true geometry of the installed systems can only be determined through the determination of the self-consistency of seafloor measurements. To facilitate such a determination, we conducted a series of "patch tests" for both the EM3000D and EM1000 that required three days of running the ship back and forth across various seafloor features (flat seafloor, seafloor target, steep slope) to determine if there were residual roll, pitch, heading, or timing offsets that required correction factors. The static adjustments determined from the patch test are listed in Tables 3 and 4.
Navigation FilteringThe 1-Hz DGPS and 100-Hz INS navigation data were logged with the Kongsberg Simrad acquisition software. The Bottom Detection Unit (BDU) time stamps the depth and backscatter telegrams and was slaved to a shipboard SUN Sparc 20 workstation that was synchronized to the GPS 1 pps. The navigation telegrams were externally stamped by the Trimble 4000 GPS receiver. The receiver antenna positions were shifted to the transducer positions according to the X and Y offsets using the POS/MV output (Table 3). Every 1-Hz navigation fix was checked for gross time and/or distance jumps by graphical examination during shipboard data processing. Outliers were interactively interrogated for time, flagged and rejected (or re-accepted). All navigation jumps greater than 20 s were automatically flagged as uninterpolatable.
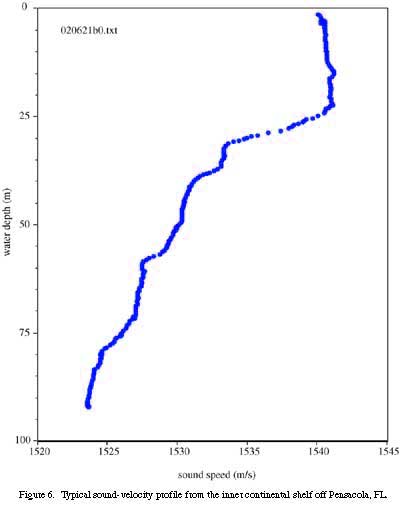
The single biggest limitation on the quality of bathymetric data is refraction of the sound wave in the water column. Refraction-related anomalies grow non-linearly with beam angle and the resulting artifacts can create short-wavelength topographic features that may be misinterpreted as seafloor relief. There was some fear prior to the cruise that a suspected strong water stratification would present a problem for the beam steering and ray tracing of individual beams. Although a strong thermocline was measured, repeated CTD casts allowed us to correct for refraction effects. A representative water-velocity profile is shown in Figure 6 (14kb). Minor additional empirical refraction corrections were applied during data processing. If all of the alignments are correctly determined, Kongsberg Simrad states that the depth resolution of the EM3000D is 5 cm (RMS), independent of water depth and beam pointing angle, and less than 0.5% of water depth for the EM1000.
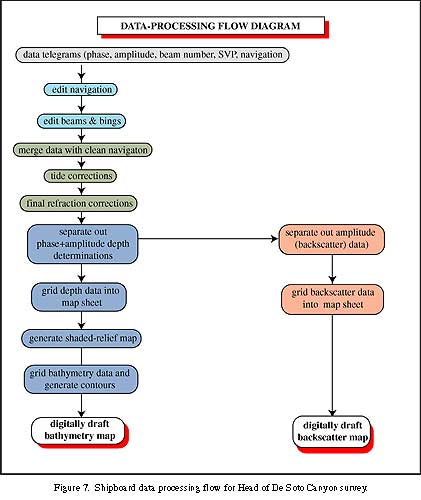
Shipboard data processing (Fig. 7, 28kb) for each data set (EM3000D and EM1000) consisted of (1) the editing the 1-Hz navigation fixes to flag bad fixes; (2) examining each ping of each beam to flag outlier beams, bad data, etc.; (3) merging the depth and backscatter data with the cleaned navigation; (4) correcting all depth values to mean lower low water tide datum; (5) performing additional refraction corrections, if necessary, for correct beam raytracing; (6) separating out the amplitude measurements for conversion to backscatter; (7) gridding depth and backscatter into a geographic projection at the highest resolution possible with water depth; (8) regridding individual subareas of bathymetry and backscatter into final georeferenced map sheets; (9) gridding and contouring the bathymetry; and (10) generation of the final maps. Nearly finalized maps were completed in the field during the transit to port and the final maps (Appendix I) were completed one week after the end of the cruise.
Overview and region maps of backscatter and shaded relief (Appendix) were generated from 39 larger-scale sub-area maps (Fig. 8, 37kb and Table 6). The 4-m-resolution subarea maps were regridded at 8 m/pixel to produce the series of region maps of the entire area (Appendix). The overview maps were regridded to 16 m/pixel. This re-gridding sacrifices resolution in the shallower areas but allows the entire area to be mapped. The detailed subarea maps are 3750 columns (14 km) by 2500 rows (10 km) in size and were produced at the maximum resolution as determined by water depths and beam angle.
A shaded-relief map (Appendix) is a pseudo-sun-illumination of a topographic surface using the Lambertian scattering law (equation 1), where SI is the pseudo-sun intensity, K is a constant that allows for even background, and F is the angle between the pseudo sun and the bathymetric surface.
SI = K * cos2 F (Eq. 1)
The backscatter map is a representation of the amount of acoustic energy scattered back to the receiver from the seafloor. The Kongsberg Simrad MBES systems were calibrated at the factory and all gains, power levels, etc. that are applied during signal generation and detection are recorded for each beam and are used to adjust the amplitude value prior to recording. Consequently, the backscatter is calibrated to an absolute reflectance of the seabed. However, the amount of energy, measured in decibels (dB), is some complex function of constructive and destructive interference caused by the interaction of an acoustic wave with a volume of sediment or, in the case of hard rock, the rock material. The backscatter from sediment represents volume reverberation to at least 5 cm depth caused by seabed and subsurface interface roughness above the Rayleigh criteria (a function of acoustic wave length), the composition of the sediment, and its bulk properties (water content, bulk density, etc.). Although, it is not yet possible to determine a unique geological facies from the backscatter value, reasonable predictions can be made from the backscatter based on the known local geology.
| map | resolution | size |
|---|---|---|
| area0 | 8 | 3750x2500 |
| area1 | 4 | 3750x2500 |
| area2 | 8 | 3750x2500 |
| area3 | 4 | 3750x2500 |
| area4 | 8 | 3750x2500 |
| area5 | 4 | 3750x2500 |
| area6 | 8 | 3750x2500 |
| area7 | 4 | 3750x2500 |
| area8 | 4 | 3750x2500 |
| area9 | 8 | 3750x2500 |
| area10 | 4 | 3750x2500 |
| area11 | 4 | 3750x2500 |
| area12 | 8 | 3750x2500 |
| area13 | 4 | 3750x2500 |
| area14 | 4 | 3750x2500 |
| area15 | 4 | 3750x2500 |
| area16 | 8 | 3750x2500 |
| area17 | 8 | 3750x2500 |
| area18 | 8 | 3750x2500 |
| area19 | 8 | 3750x2500 |
| area20 | 4 | 3750x2500 |
| area21 | 4 | 3750x2500 |
| area22 | 8 | 3750x2500 |
| area23 | 8 | 3750x2500 |
| area24 | 8 | 3750x2500 |
| area25 | 4 | 3750x2500 |
| area26 | 4 | 3750x2500 |
| area27 | 4 | 3750x2500 |
| area28 | 8 | 3750x2500 |
| area29 | 8 | 3750x2500 |
| area30 | 4 | 3750x2500 |
| area31 | 4 | 3750x2500 |
| area32 | 4 | 3750x2500 |
| area33 | 4 | 3750x2500 |
| area34 | 4 | 3750x2500 |
| area35 | 4 | 3750x2500 |
| area36 | 4 | 3750x2500 |
| area37 | 4 | 3750x2500 |
| area38 | 4 | 3750x2500 |
| area39 | 4 | 3750x2500 |
One of the great advantages of this survey is that every sounding of the bathymetry is accurately georeferenced to geodetic standards and is coregistered with the acoustic backscatter. Each pixel on the map has a latitude, longitude, depth, and backscatter value assigned to it. Consequently, there is no ambiguity in correlating the backscatter to the bathymetry, as is often the case when correlating sidescan sonar with bathymetry.
June 17, 2002 (JD 168)
We departed Pensacola, FL at 1100 hr local and headed for the northern part of the survey area to commence the patch test on the EM3000D. The EM1000 was inoperable because 11 receive boards tested bad. New boards were ordered from Norway but had not arrived by our sailing. The first patch test was to determine the extinction depth for the EM3000D. The system was set for 0.15 ms pulse length and 8 kHz bandwidth and tracked the bottom to 120 m water depths. We decided at this point that, because the EM3000D has a much higher resolution than the EM1000, we would run the entire survey with the EM3000D.
The transit lines and initial patch tests uncovered a series of motion artifacts and a heading bug that periodically jumped the heading to 350o for one or two pings then reset back to the actual heading, and a misalignment of the two transducer heads. The evening was spent finding the cause of these problems and correcting them. Another artifact was identified that is manifested as a heave artifact (Fig. 9, 23kb) that appears to be induced by a level-arm error. This artifact was eventually tracked down to a processing software bug.
June 18, 2002 (JD 169)
Survey lines were begun early in the morning even though several minor problems had not been solved. The most vexing unsolved problem was the sudden, one-ping jump that changes the heading to 350o then back again to the valid value. The jump occurs randomly and acted like a grounding problem. The seas were calm and ship speeds of 9.5 to 10 kts produced data of excellent quality. Swath widths averaged about 400 m in 50-m water depths.
Problem solving continued throughout the day. The one-ping jump was reduced but not eliminated by cleaning and reseating all the transducer connectors to the power supply. The next problem was the Simrad control computer locking up, sometimes with only the port transducer active, sometimes the starboard one, and sometimes locking both of them. The problem was investigated by first running with only the port transducer active, then with only the starboard transducer. However, regardless of the testing, we ran along the 45-m isobath and collected excellent-quality data that were used in the final maps. The power supply was changed and the wiring between the power supply and the Simrad control computer was replaced and the system ran with both port and starboard transducers active.
June 19, 2002 (JD 170)
Although trouble-shooting continued throughout the day, we ran mapping lines because high-quality data were being collected during the testing. The dual-mode EM3000D did not lock up during the afternoon and we essentially commenced the mapping at 1500 hr (local). Seas were calm and the temperature was warm.
June 20, 2002 (JD 171)
Routine day of mapping with the EM3000D.
June 21, 2002 (JD 172)
Mapping continued with the EM3000D until 1045 hr when we terminated mapping and headed for Pensacola to pick up the EM1000 boards and spares. Arrived Pensacola 1430 hr (local) in torrential downpour. Mayer and Calder were at the dock to catch lines. Gardner, Elston, and Hughes Clarke disembarked, and Mayer, Calder, Rzhanov, J.Glynn, and C. Glynn embarked.
June 22, 2002 (JD 173)
Departed Pensacola at 0237 hr (local). Welding on the EM1000 ram was completed and testing began on the EM1000. We steamed to southwest section of survey area, in vicinity of pipeline, to resume EM3000D work. During the transit, the EM1000 was repaired with the replacement of one of the new circuit boards. A patch test began at about 1000 hr (local) on the EM1000 over the pipe line. t. C&C patch tests results showed 2.5o pitch offset, whereas we saw a 1.27 s latency and only very small pitch (0.49o) and roll (0.34o) offset using OMG patch test tools. Using Caris tools, we saw a 1.6 s latency and about 0.4o pitch offests. C&C discovered that they were using an internal clock on the Simrad CPU rather than external clock, which explained their latency. We changed to external clock, undid all offsets, and reran the patch. This patch test showed no latency, a –0.35o static roll, and a 0.5o heading offset. These values were input at the EM1000 Simrad console.
The logging system was setup to run and log both the EM3000D and EM1000 simultaneously, but initially only the EM3000D data were processed.
The mapping commenced in the southwestern part of the area heading southwest at 1336 hr (local). The seas were rather rough causing lots of dropouts so the ship speed was reduced to 8 kts. Ship speed was further reduced to less than 7 kts before acceptable data were recorded. The one-ping dropouts continued despite change in power supply on EM3000D.
June 23, 2002 (JD 174)
All operations ran smoothly with both the EM3000D and EM1000 operating. Only the EM3000D data were processed at this point. Mapping stopped at 1100 hr (local) to head back to Pensacola to drop off Mayer, Dikjstra, Kleiner, Devall, and Alleman, and pick up Gardner. We arrived at the City Dock, Pensacola at 1630 Hr (local) and were back underway at 1830 hr. We reached the southwest area and commenced mapping at 2330 hr (local) with only the EM3000D.
June 24, 2002 (JD 175)
Mapping continued till 0211 (local) at 8kts. A moderate swell required a reduction in speed to 7 kts to ensure data quality. The swell subsided by mid afternoon and the speed was increased to 9.5 kts. Routine day of mapping with the EM3000D.
June 25, 2002 (JD 176)
Seas were calm all morning but the wind freshened in the afternoon, bringing clouds and rain showers. The worsening weather generated local swell that resulted in some rolling and pitching. The ship was slowed to 8 kts to keep the data in top quality. When lines collected in the southwest survey area were gridded into an overview map, they showed that the weigh_grid program was failing to grid the beams into the DTM that fall within the transducer-overlap zone (Fig. 10, 34kb). The problem appeared during day JD173 and, for the most part, affected most of the subsequent lines. However, as can be seen in Figure 10 (34kb) the problem seems to be intermittent. The processed merged files were checked and found to be uncorrupted so the problem was isolated to the weigh_grid program or a memory problem with the SGI processing workstation.
The Hydromap logging computer locked up in the middle of the afternoon while checking out the Ethernet connections. The Ethernet connection became the focus of attention because "check-sum errors" occurred when data packets were transferred from the Simrad console to the Hydromap console. The suspicion was that the data might be getting corrupted during transfer, thus causing the heading glitch that affects the starboard data. The Ethernet cable was replaced but the problem continued.
June 26, 2002 (JD 177)
The morning was bright and warm with calm seas but by afternoon clouds had built up and water spouts were seen on the horizon (Fig. 11, 7kb). Routine day of mapping with EM3000D. The progress to date was gridded and the nadir drop-out zone (see June 25) appears to come and go. The data collected over the last two days have incomplete refraction compensations. Additional refraction corrections will have to be applied back on the beach.
By 0930 hr (local) the water depths had reached 90+ m and the swath width began to narrow. The EM1000 was turned on and both systems were recorded to ensure complete coverage.
The EM1000 data was processed and it was discovered that the inner starboard beams are not tracking bottom. By late afternoon almost none of the EM1000 beams were tracking the bottom but the EM3000D was still performing to specifications. One problem with the EM1000 was discovered where the sound velocity profile was not being properly read in. Several hours were spent trying to figure out what was going wrong. The problem was eventually tracked down to the lack of a zero depth in the sound-velocity profile. The EM1000 data for lines 020626/204 through 020626/210 are all corrupted and unusable.
June 27, 2002 (JD 178)
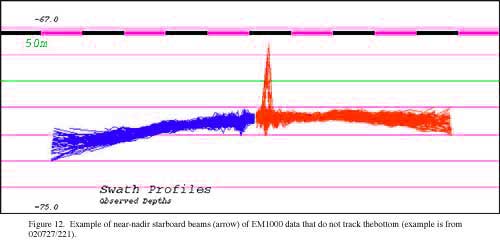
Routine day of mapping with simultaneous EM3000D and EM1000. The EM1000 data have a persistent starboard near-nadir series of beams that are not properly detecting the bottom (Fig. 12, 15kb). The problem occurs with a series of beam within the outer starboard edge of the amplitude detect zone and correlates with two bad staves in the transducer. Apparently, the bad staves are the principal ones for the beamforming in this sector and are resolving bad depth solutions. Unfortunately, because the problem is within the hull-mounted transducer, nothing can be done at sea to correct the problem other than editing out the bad data. Nevertheless, the EM1000 data were unraveled but left unedited so that the processing attention was focused on the EM3000D data. The EM1000 data will be edited post-cruise.
The weather was warm and partly cloudy with a small swell. Ship motion was negligible and the data quality for both systems was excellent. The EM1000 performed well in the shallow mode (60 beams, 0.2-ms pulse length) until water depths of about 100 m were reached. The system was then switched to medium mode (48 beams, 0.7-ms pulse length) for depths deeper than 100 m. The line spacings were determined by the EM3000D swath in water depths shallower than 100 m and by the EM1000 swath in depths deeper than 100 m.
An additional -0.150 roll offset was discovered in the EM1000 data. Once confirmed, all of the previous EM1000 lines were corrected with unrollOMG -roll_offset +0.150. An unrollOMG line was added to the unravel script so that all subsequent lines would be corrected. No corrections were made to the installation parameters of the Simrad console.
The CTD winch died at 2330 hr during a CTD dip. An expendable sound-velocity probe was checked out but the software to record the data kept crashing. For the time being, the CTD was lowered and retrieved by hand.
June 28, 2002 (JD 179)
Data collection continued during the night, with good quality in EM3000D but gradually varying quality in the EM1000. At line 253, it was noticed that a port side mid-beam on the EM1000 was dropping out continuously, leaving an along-track gap in the data. Data overlap is sufficient in this region (due to line spacing set by the EM3000D swath width) to allow this gap to be filled on subsequent passes, but the gap appears to worsen during the line and into line 254.
After line 255, the Hydromap computer refused to log EM1000 data. Attempts to resurrect the machine started at. 0730 hr, and continued until 0830 hr. After several reboots, Hydromap began to log data correctly, except that it would not talk to the Echotrack single-beam system that was being used as a check on depth. This was not considered essential, so the survey was continued from the break point.
Meanwhile, investigations continued into the source of isolated navigation issues with the EM1000. Analysis of the raw Simrad datagrams showed that the position packets being reported by the sonar have intermittent errors that change the time stamp format, and may also have introduced the occasional errors observed in the position information itself. We could not determine whether the problem occurred with data transmission to the EM1000 console, or with the output data stream; consequently, it was not clear what action to take.
Problems with EM1000 were tracked to SPB6 (Signal Processing Board, one of the receiver processors), that affects every sixth receive beam. The built-in test of the board appeared to reset the processors and the beams returned to normal operation. EM1000 data recovered significantly, to the state where they can be used for mapping. However, a persistent problem of the outer beams of the EM1000 flapping up and down (Fig. 13, 19kb) was tracked to a possible vibration in the transducer ram. A series of speed trials was run at 5 kt, 6 kts, etc. and the collection a few hundred pings to see if the problem was as a function of ship speed. Lines 020628/261 (5 kts), 262 (7 kts), and 263 (9 kts) conclusively showed that the outer-beam flapping is speed related. The flapping was not apparent at speeds slower 7 kts but very apparent at speeds faster than 7 kts. Upon further investigation of the transducer ram, it was discovered that the jam bolts are more than 5 m above the transducer and a "humming" of the ram could be detected at the faster speeds suggesting movement of the transducer ram at speeds above 7 kts
The progress of the area mapped to date was behind schedule by several days because of the unexpectedly flat and shallow seafloor and the slow mapping speeds so the cruise tactics were change. Prior to line 020628/265 the adjacent tracks were spaced for a good overlap of the EM3000D lines. This tactic generated line spacings of about 200 m. Starting with line 020628/265, the line spacing was dictated by the EM1000 coverage that generated a 400-m spacing. The result of this tactical change is that there are narrow gaps between EM3000D swaths but the gaps are completely covered by the EM1000 data. This will present a unique challenge for post-cruise processing on the beach.
The day was hot and still with calm seas. The SVP profiles continued to be collected by manually lowering and raising the CTD until mid afternoon when, to the relief of all, the CTD winch was repaired.
The POS/MV crashed at 1900 hr (local) and brought down the Simrad and Hydromap computers with it. None of the controller computers would reboot so both computers had to be torn apart and all boards checked and reseated. The problem was traced to a bad video card in the Hydromap computer. The systems were back up and running by 2000 hr.
Rapidly changing conditions of the sound-velocity structure of the water column began to be a problem. The refraction corrections applied for any given SVP profile only corrected the ray paths for a few 10s of minutes and then would start to cause refraction. Repeated SVP profiles showed a complex water structure (Fig. 14, 23kb) that was spatially and temporally varying.
June 29, 2002 (JD 180)
Weather was partly cloudy and warm, the seas were calm. At 1030 hr (local) we were at the northeast end of a line in the southwest block and it was decided to end the mapping in this area. We transited over to fill in two gaps in the southwest block and then headed to the southwest corner of the middle block and commenced mapping with both the EM1000 and EM3000D. Line spacing for the middle block was determined by the swath of the EM1000, realizing that there would be gaps between EM3000D lines. However, calculations showed that, with the EM3000D swath widths of 2x water depths, we would not be able to map much of the middle block in the time remaining. The EM1000 swath was consistently achieving 4 x water depth, providing a 400-m line spacing. Mapping commenced on the middle block at 1330 hr (local).
A progressively worsening beam pattern began to show on the EM1000 backscatter data. A plot of the average beam patter for line 020629/280 shows the problem (Fig. 15, 28kb). The transmit/receive boards were rotated one slot over but made no change in the beam pattern. At this stage, we were stumped as to the cause of the problem. The beam pattern appeared in the processed backscatter data regardless of whether a rolling 500-ping average or a simple beam pattern was used.
June 30, 2002 (JD 181)
Routine day of mapping with EM1000 and EM3000D. The weather was partly cloudy to sunny and hot and the seas were calm. Terraces (Fig. 16, 18kb) began to show up on the seaward-facing side of the large beach ridge (?) around the 55-m isobath. The terraces may be the outcrops described by Shipp and Hopkins (1978).
It was discovered in the afternoon that all EM1000 navigation files have the wrong month and day although the times are correct. Navigation data from a dozen lines of EM1000 were compared (using getBounds) with the same EM3000D data and the EM3000D data are all correct but none of the EM1000 data are correct. The GGA strings from the GPS satellites to the POS/MV were checked and they appear to be correct. The problem seems to be in the day data field being read in by the -em1000 subroutine of the RT program. At this point, the seriousness of the problem is unknown but the tide corrections will have to be reapplied once he problem is fixed.
July 1, 2002 (JD 182)
Routine day of mapping with EM1000 and EM3000D. The morning weather was partly cloudy with showers but the afternoon was sunny and hot; the seas were calm all day. The EM1000 month, day, and Julian day problem went away with the change in month from June to July. No explanation.
It became obvious that the EM1000 was not performing as expected. Once the 100±-m isobath was reach, the acoustic backscatter would abruptly drop by about -10 dB (Fig. 17, 13kb).
With the EM1000 in the automatic mode, it should have stayed in the "shallow" mode to about 200-m water depths. Although the console said the system stayed in the shallow mode with pulse length of 0.2 ms, the number of beams changed from 59 in the <100 m areas to 54 beams in the >100 m areas. The system console was put in the "manual" mode and the same thing happened. All configurations were tried (i.e., shallow, medium, automatic, manual) but the system continued to react independent of the settings.
The EM1000 control computer crashed at 1830 hr (local). The system would not read the controller software during reboot. Finally, after an hour of reseating boards and multiple reboots, the system came up and we were back in business.
July 2, 2002 (JD 183)
Routine day of mapping with EM1000 and EM3000D. The weather was clear and hot and the seas were calm. The abrupt shift in backscatter with water depth, similar to that shown in Figure 18, occurred on both the EM1000 and EM3000D although not at the same water depth. The cause of this gain change has yet to be determined.
Late in the evening the EM1000 started producing very noisy data in the southwest corner of the Central region (Fig. 18, 25kb). The EM3000D produced high-quality data in this region so the problem appeared to be with the EM1000 hardware/software. Once on a northeastern course and away from the southwestern corner, the noise on the EM1000 data disappeared.
July 3, 2002 (JD 184)
Routine day of mapping with EM1000 and EM3000D. The weather was clear and hot and the seas were calm. The EM1000 data in the southwest corner of the Central region continued to be very noisy whereas the EM3000D data in this area are excellent. No explanation has been successfully defended even though numerous hypotheses have been proposed.
A check of the preamplifier boards and voltage outputs on the EM1000 revealed that the preamplifier lights were not all lighting as the manual describes. In addition, the transmit voltage outputs were erratic and often below the required values. This suggests the power supply and/or the capacitors are not functioning properly. Neither of these observations would account for the noisy behavior of the EM1000 in the southwest corner of the Central region, although they may explain the poor performance of the EM1000 in general.
At the suggestion of John Hughes Clarke, from the leisure of his lab at the University of New Brunswick, we switched the EM1000 from the equiangular mode (EABS) to the equidistant mode (EDBS) at the start of a line. When in the EDBS mode, a series of rejected beams occurred in the midrange (Fig. 19, 47kb). When switched back to the EABS mode, the beams were not rejected. Consequently, we returned the system to the EABS mode.
July 4, 2002 (JD 185)
Routine day of mapping with EM1000 and EM3000D. Weather in the morning was cool with stormy 25-kt winds, dark clouds, torrential rain, and lightning but the afternoon was clear, warm with breezes. The seas became choppy throughout the morning but did not affect he data quality. The daily backup of the EM3000D merged files for day 020703 showed four times the data volume (~4.5 gb in tar.gz format) compared to previous days (~1.1 gb). There seemed to be no explanation for the huge increase in data volume; only 26 lines were run on day 020703. The EM3000D data for day 020703 were backed up on /work7 disk.
July 5, 2002 (JD 186)
Routine day of mapping with EM1000 and EM3000D. The morning was cool, cloudy, and drizzly but by mid afternoon it was clear, breezy and hot. A short-period 3-ft sea was running all day. All of the Central region, except for a plateau in the southern third of the area, was completed between the 50- and 100-m isobaths. Starting with line 448 (running north-east), the nose of the plateau was mapped to the 100-m isobath. A starboard roll was artificially introduced by ship's engineers during line 449 to aid in unblocking a fouled drain exhaust was causing a significant odor nuisance. This roll was slowly reduced during line 449 and eliminated by the end of the line
An analysis comparing depths determined by the EM3000D versus the EM1000 showed that the EM1000 soundings are consistently 0.35-m deeper than the EM3000D soundings. A program was written (blendsurfaces) that adds 0.35 m to all EM1000 soundings and then merges the two data sets together where gaps occur in the EM3000D coverage. The blending produces one continuous DTM surface.
At 1500 hr (local) it was obvious that we could not continue to map the long lines of the Central region and have any time to map the NE section. Consequently, the mapping was concentrated on the prominent nose of the shelf platform of the Central area. The mapping of the platform nose was completed at 1800 hr (local), however, the EM1000 computers promptly crashed at this time. It took more than 2 hours to get the computers rebooted and running. The EM1000 computers ran for about an hour before they all crashed again. We transited in deep water to the start of the northeast region not collecting any usable data.
Late in the evening prior to arriving at the northeast area, the Ethernet network bogged down to a condition where it was not operating with enough bandwidth to pass data. The problem was traced to a bad cable. When the cable was replaced, the data rates to all computers dramatically increased and timing problems with the EM1000 disappeared. In addition, the perception was that the EM1000 data quality improved as well.
July 6, 2002 (JD 187)
Routine day of mapping with EM1000 and EM3000D. The day was spent concentrating on the northeast area. The weather was clear, calm, and warm and the seas were less than 3 ft. Refraction was a problem in the northern end of the northeast area but not a problem in the southern end. Multiple SVP profiles were taken but the water masses kept changing spatially.
July 7, 2002 (JD 188)
Routine day of mapping with EM1000 and EM3000D. The weather was clear, calm, and warm and the seas were glassy flat.
July 8, 2002 (JD 189)
Routine mapping continued with EM1000 and EM3000D, working down the southern edge of the central section of the survey area, and then orthogonally across the northern ends of the south-west area survey lines towards the southern end of the work area. Towards the end of line 520, the EM1000 started to behave erratically and would only track bottom in Deep mode. The system was rebooted multiple times, but did not recover correctly. Built-in tests of the system were run, and all components except the pre-amplifiers reported good status. After some time, the system was found to operate adequately in medium mode, reporting 40-45 of 48 beams valid.. It was decided to run line 521 in medium mode in order to see whether a change of location would have any effect. Note that during difficulties in shallow mode, the Simrad BDU (bottom detector unit) indicated many more beams as being valid that the OPU (operator processing unit) did, potentially indicating some communication difficulty between the systems. Monitoring of the BDU displays at the console indicated that the BDU's estimation of the number of acceptable beams is more likely correct. Problems with time synchronization occurred at the same time, and the POS/MV was rebooted to allow for resynch, resolving the issue.
July 9, 2002 (JD 190)
The mapping was terminated at 0030 hr (local) and the transit began to Pensacola, FL We transited through the night and arrived at the City Dock, Pensacola, FL at 0600 hr (local), thus ending USGS cruise M1-02-GM.
| USGS Team | Leg 1: June 17 thru 21 | Leg 2: June 21 thru 23 | Leg 3: June 23 thru July 8 |
|---|---|---|---|
| James V. Gardner, Chief Scientist | X | X | |
| John E. Hughes Clarke, UNB | X | ||
| Larry A. Mayer, UNH | X | ||
| Brian Calder , UNH | X | X | |
| Semme Dijkstra, UNH | X | X | |
| Garreth Elston, UNH | X | ||
| Yuri Rzhanov | X | X | |
| James Glynn | X | X | |
| Chris Glynn | X | X | |
| C& C Team | |||
| Art Kleiner, Project Manager | X | X | |
| Tim Shannon, Field Project Manager | X | X | X |
| Craig Smith | X | X | X |
| Eric Ortego | X | X | X |
| Brad Daigles | X | X | X |
| Liz Kamp | X | X | X |
| Wes Kitt | X | X | X |
| Al Cousson | X | X | |
| Sam Alleman | X | X |
Anonymous, 1999, Northeastern Gulf of Mexico coastal and marine ecosystem program: Ecosystem monitoring, Mississippi/Alabama shelf, 3ed annual interim rept., Minerals Management Service, 210p.
Benson, D.J., Schroeder, W.W., and Shultz, A.W., 1997, Sandstone hardbottoms along the western rim of De Soto Canyon, northeast Gulf of Mexico, Gulf coast Assoc. Geol. Soc. Trans., v. 47, p. 43-48.
Gardner, J.V., Sulak, K.J., Dartnell, P., Hellequin, L., Calder, B., and Mayer, L.A, 2000, The bathymetry and acoustic backscatter of the Pinnacles area, northern Gulf of Mexico. US Geological Survey Open-File Rept. 00-350, 35 p.
Gardner, J.V., Dartnell, P., Sulak, K.J., , and Calder, B., and Hellequin, L., 2001, Physiography and Late Quaternary-Holocene Processes of Northeastern Gulf of Mexico Outer Continental Shelf off Mississippi and Alabama, Gulf of Mexico Science v. 20, p. 132-157.
Gardner, J.V., Dartnell, P., and Sulak, K.J., 2002, Multibeam mapping of the Pinnacles Region, Gulf of Mexico, U.S. Geological Survey Open-File Report, OF02-6 (CD-ROM).
GEODAS dataset, Geophysical data system for hydrographic survey data, National Geophysical Data Center, NOAA, CD-ROM vol. 1 and 2, version 4.0.
Harbison, R.N., 1968, Geology of De Soto Canyon, Jour. Geophys. Res., v. 73, p. 5175-5185.
Hughes-Clarke, J.E., Mayer, L.A., and Wells, D.E., 1996, Shallow-water imaging multibeam sonars: A new tool for investigating seafloor processes in the coastal zone and on the continental shelf. Marine Geophysical Researches, 18: 607-629.
Jordon, G.F., 1951, Continental slope off Apalachicola River, Florida, Bull. Amer. Assoc. Petroleum Geologists, v. 35, p. 1978-1993.
Ludwig, J.C and Walton, W.R., 1957, Shelf-edge calcareous brominences in northeastern Gulf of Mexico. Bull. Amer. Assoc. Petroleum Geologists, v. 41, p. 2054-2101.
McBride, R.A. and Byrnes, M.R., 1995, Surficial sediments and morphology of the southwestern Alabama/western Florida panhandle coast and self, Gulf Coast Assoc. Geol. Soc. Trans. V. 45, p. 393-404.
Scanlon K.M., 2000. Surficial Seafloor Geology of a Shelf-edge Area off West Florida. in: Briere, P.R., Scanlon K.M., Fitzhugh, G., Gledhill, C.T., and Koenig C.C., 2000. West Florida Shelf: Sidescan-sonar and sediment data from shelf-edge habitats in the northeastern Gulf of Mexico, U.S. Geological Survey Open-file Report 99-589. CD-ROM.
Shipp, R.L. and Hopkins, T.S., 1978, Physical and biological observations of the northern rim of the De Soto Canyon make from a research submersible. Northeast Gulf Science, v. 2, p. 113-121.
Appendix 1A (60kb). Color shaded-relief map of entire area mapped on cruise M1-02-GM. Close-ups of the threeAreas (SW, Central, and NE) follow on the next three pages.
Appendix 1B (81kb). Close-up of shaded-relief bathymetry map of Southwest (SW) area
Appendix 1C (54kb). Close-up of shaded-relief bathymetry map of Central area.
Appendix 1D (44kb). Close-up of shaded-relief bathymetry map of (NW) area.

![]() U.S. Department of the Interior |
U.S. Geological Survey
U.S. Department of the Interior |
U.S. Geological Survey
URL: http://pubsdata.usgs.gov/pubs/of/2002/0396/intro.html
Page Contact Information: GS Pubs Web Contact
Page Last Modified: Wednesday, 07-Dec-2016 19:27:43 EST
