
Coastal Vulnerability Assessment of Cape Cod National Seashore to Sea-Level Rise, USGS Open-File Report 02-233
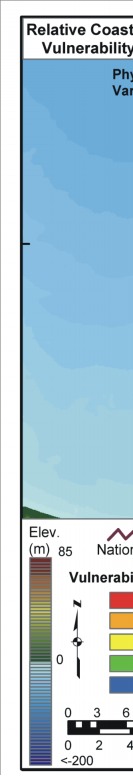
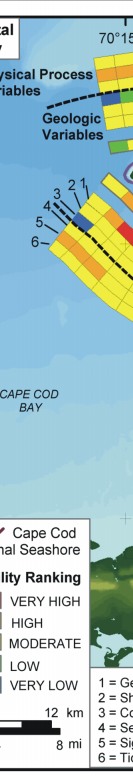
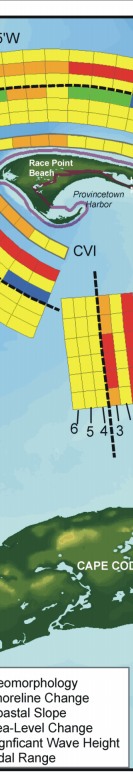
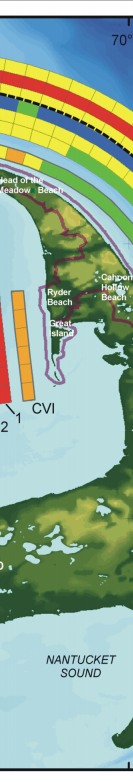
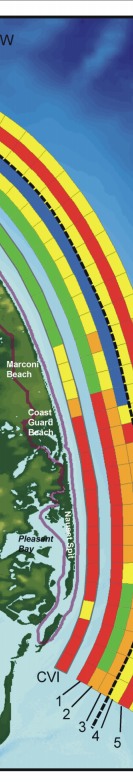
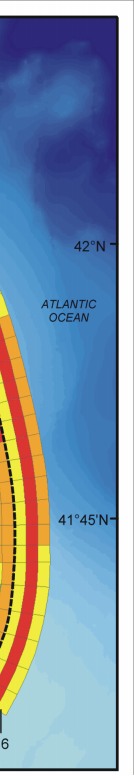
Figure 11: Relative Coastal Vulnerability for Cape Cod National Seashore. The innermost color bar is the relative coastal vulnerability index (CVI). The remaining color bars are separated into the geologic variables (1-3) and physical process variables (4 - 6). The very high vulnerability shoreline is along Nauset spit on the elbow of the Cape. High vulnerability shoreline is concentrated mostly within Cape Cod Bay. Moderate vulnerability shoreline is along the Provincetown spit complex, and the low vulnerability portion of the shore lies along the outer coast from Head of the Meadow Beach to Marconi Beach.
 |
 |
 |
 |
 |
 |
