
Coastal Vulnerability Assessment of Cape Cod National Seashore to Sea-Level Rise, USGS Open-File Report 02-233
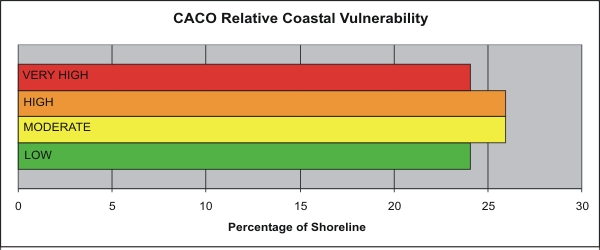
Figure 12: Percentage of Cape Cod National Seashore in each vulnerability category.

|
Coastal Vulnerability Assessment of Cape Cod National Seashore to Sea-Level Rise, USGS Open-File Report 02-233 Figure 12: Percentage of Cape Cod National Seashore in each vulnerability category.
|