METHODOLOGY
In order to develop
a GIS database for a park-wide assessment of coastal vulnerability,
data for each of the six variables described above were gathered from
state and federal agencies (Table
2). The database is based on that used by Thieler and Hammar-Klose
(1999) and loosely follows an earlier database developed by Gornitz
and White (1992). A comparable assessment of the sensitivity of the
Canadian coast to sea-level rise is presented by Shaw et al. (1998).
The database was constructed using a 1:70,000 Cape Cod shoreline that
was produced from the medium resolution digital vector U.S. shoreline
provided by the Strategic Environmental Assessments (SEA) Division
of NOAA's Office of Ocean Resources Conservation and Assessment (ORCA)
(http://seaserver.nos.noaa.gov
/projects/shoreline/shoreline.html). Data for each of the six variables
(geomorphology, shoreline change, coastal slope, relative sea-level
rise, significant wave height, and tidal range) were joined to the
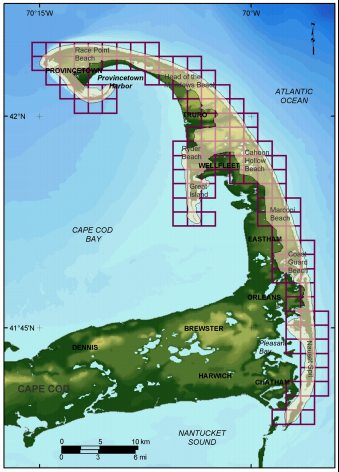
shoreline using a 1 minute (approximately 1.5 km) grid (Figure
2). The data were next assigned a relative vulnerability value
from 1-5 (1 is very low vulnerability, 5 is very high vulnerability)
based on the potential magnitude of its contribution to physical changes
on the coast as sea level rises (Table
1).
Figure 2. Shoreline grid for CACO.Click on figure for larger image.
Back to Top